Abstract
Hafnium-doped titania (Hf/Ti = 0.01; 0.03; 0.05) had been facilely synthesized via a template sol–gel method on carbon fibre. Physico-chemical properties of the as-synthesized materials were characterized by X-ray diffraction, Raman spectroscopy, scanning electron microscopy, energy-dispersive X-ray analysis, scanning transmission electron microscopy, X-ray photoelectron spectroscopy, thermogravimetry analysis and Brunauer–Emmett–Teller measurements. It was confirmed that Hf4+ substitute in the Ti4+ sites, forming Ti1–xHfxO2 (x = 0.01; 0.03; 0.05) solid solutions with an anatase crystal structure. The Ti1–xHfxO2 materials are hollow microtubes (length of 10–100 µm, outer diameter of 1–5 µm) composed of nanoparticles (average size of 15–20 nm) with a surface area of 80–90 m2 g–1 and pore volume of 0.294–0.372 cm3 g–1. The effect of Hf ion incorporation on the electrochemical behaviour of anatase TiO2 in the Li-ion battery anode was investigated by galvanostatic charge/discharge and electrochemical impedance spectroscopy. It was established that Ti0.95Hf0.05O2 shows significantly higher reversibility (154.2 mAh g–1) after 35-fold cycling at a C/10 rate in comparison with undoped titania (55.9 mAh g–1). The better performance offered by Hf4+ substitution of the Ti4+ into anatase TiO2 mainly results from a more open crystal structure, which has been achieved via the difference in ionic radius values of Ti4+ (0.604 Å) and Hf4+ (0.71 Å). The obtained results are in good accord with those for anatase TiO2 doped with Zr4+ (0.72 Å), published earlier. Furthermore, improved electrical conductivity of Hf-doped anatase TiO2 materials owing to charge redistribution in the lattice and enhanced interfacial lithium storage owing to increased surface area directly depending on the Hf/Ti atomic ratio have a beneficial effect on electrochemical properties.
Keywords: Li-ion battery, anatase TiO2, doping, anode, nanostructured material, sol–gel process
1. Introduction
Nowadays, rechargeable Li-ion batteries (LIBs) are used worldwide as power sources for portable electronics, operating tools, and implantable devices because of their excellence in terms of energy density, cycle life and reliability [1,2]. By contrast, the extensive application of LIBs for hybrid and electric vehicles, uninterruptible power supplies, unmanned underwater vehicles, renewable alternative energy systems is limited owing to a number of issues, foremost being power density and safety. The overwhelming majority of LIBs consist of a lithiated metal oxide cathode (e.g. LiCoO2, LiNiO2, LiMnO2 and LiFePO4) and a carbonaceous anode (usually graphitized carbon or graphite). Owing to strong oxidizing and reducing agents used as electrode-active materials, the LIBs’ operating voltage is high, e.g. 3.6–3.7 V for a LixC6/Li1–xCoO2 system. At the same time, because of the LixC6 potential being close to that of Li/Li+, the electrolyte undergoes reduction that leads to blocking of solid electrolyte interphase (SEI) formation on the anode surface. The latter results in both irreversible capacity loss and, more unfavourably, tree-like lithium dendrite growth (especially intensive at high C-rates) that has a negative effect on LIB safety [3,4]. In this case, the safety of LIBs is sufficient for traditional applications, whereas it is an insurmountable obstacle for medium- and large-scale energy storage requiring faster charge/discharge.
Titania polymorphs, mainly anatase and TiO2(B), are more suitable anode materials for high power density, high-safety LIBs owing to their higher Li+ insertion potentials (from 1.5 to 1.8 V) when compared with graphite (lower than 0.3 V). It is well known that, at the potential higher than 1.2 V (cathodic limit of the electrochemical window for the typical LIB electrolyte solution), the formation of SEI on the anode surface can be effectively avoided [5,6]. It may prevent lithium dendrite growth and improve greatly the LIB's power density and safety. Furthermore, anatase TiO2 has a better stability during cycling because of smaller volume changes (lower than 4%) in comparison with graphite (9–10%). On the other hand, because of a higher theoretical-specific capacity of 335 mAh g–1 titania possesses almost twice the energy density in comparison with Li4Ti5O12 that recently has received increasing interest for similar reasons [7]. The last but not least is the natural abundance, low cost (at least a third of Li4Ti5O12) and environmental friendliness of TiO2. Unfortunately, anatase TiO2 possesses slow diffusivity of Li+ ions (10–17–10–9 cm2 s–1) into the crystal lattice that hampers its application in the LIB anode [8]. Moreover, titania is a semiconductor-type material, possessing a wide band gap (3.2 eV for anatase) that results in poor conductivity (10–12–10–7 S cm–1) and additionally limited electrochemical performance of the LIB [9].
It was established elsewhere [10,11] that nanostructuring improves significantly the Li-storage properties of titania, e.g. facilitates the Li+ ion diffusion and intensifies the redox electrochemical reactions. However, as it turned out, the particles’ nanoscale size is not sufficient to design the anatase TiO2 suitable for commercialization in the LIB anode. A variety of methods has been proposed to improve the electrochemical performance of anatase TiO2, e.g. interconnection of titania with carbonaceous materials (single-wall carbon nanohorns [12], carbon nanofibres [13], graphene [14]) or conducting polymers (polyaniline [15], polypyrrole [16]), core-shell structures (MoS2/TiO2 [17], Sn/TiO2 [18], MnOx/TiO2 [19]). At the same time, it is difficult to provide reliable charge carrier transport pathways owing to illusive uniformity of composite materials and/or nanoparticle agglomeration. Additionally, most of the approaches are unprofitable, inconvenient and include a number of sophisticated stages.
Recently, substitutional metal ion (Mn+) doping of anatase TiO2 has attracted great attention as a promising way to improve its electrochemical performance [20–23]. It is well known that incorporation of Mn+ ions with an oxidation number more than 4+ (e.g. V5+ [24] or Mo6+ [25]) causes charge redistribution owing to reduction of Ti4+ to Ti3+ that enhances electronic conductivity of titania, whereas partial substitution of Ti4+ into the anatase TiO2 lattice by Mn+ ions with an oxidation number of less than 4+ (e.g. Ni2+ [26] or Fe3+[27]) creates an oxygen vacancy that additionally increases ionic conductivity of TiO2. On the other hand, as it was noted, in our earlier work [28], the ionic radius of the dopant is no less important in terms of anatase TiO2 electrochemical behaviour. In particular, differences in the ionic radius values of Ti4+ and Mn+ leads to changing crystal lattice parameters of TiO2 after doping that may result in the facilitation or slowing of Li+ ions’ diffusion kinetics. Thus, in order to design an efficient anatase TiO2 anode for high power density, high-safety LIBs, the balancing between the ionic radius and the oxidation number of the dopant is a key factor. Hence, a clear understanding of the doping strategy from the point of view of the Mn+ ionic radius is strongly required.
Here, the doping with Hf4+ of nanostructured anatase TiO2 tubes by an inexpensive template sol– gel method is reported. The relationship between the electrochemical behaviour of Ti1–xHfxO2 (x = 0.01; 0.03; 0.05) in the LIB anode and the ionic radius of a substitutional agent is investigated by charge/discharge tests and electrochemical impedance spectroscopy. Based on the results in this work coupled with the data published in our previous report [28], the importance of the dopant ionic radius is discussed in detail and a good grasp of the principles of TiO2 doping is achieved.
2. Experimental section
2.1. Synthesis procedure
Hf-doped anatase TiO2 in the form of nanoparticle-structured tubes was synthesized by a template sol–gel procedure, which had been developed by us earlier [29]. Analytical grade titanium tetrachloride (Component-Reaktiv, Russia) and hafnium oxychloride hydrate (Sigma-Aldrich, USA) were used as precursors without any purification. As a template, Busofit-T055 carbon fibre (Khimvolokno, Belarus) was applied. As the Busofit-T055 fibre contains approximately 0.01% silicon as an impurity, the preliminary autoclave treatment with NH4HF2 at 130°C was carried out. As a result, silicon concentration decreases by 30 times. In a typical synthesis process, 0.5 ml TiCl4 was added to 1 l distilled water under vigorous stirring until full dissolution. Subsequently, HfOCl2·8H2O was placed into the obtained solution with the Hf/Ti atomic ratios of 0.01 (Ti0.99Hf0.01O2), 0.03 (Ti0.97Hf0.03O2) and 0.05 (Ti0.95Hf0.05O2). After that, prepared solution was deposited on the surface of the treated Busofit-T055 carbon fibre template. Finally, slow annealing at 500°C under air for 2 h was performed for template removal. The undoped TiO2 was synthesized under the same conditions without the HfOCl2·8H2O for comparison.
2.2. Characterization
The particles’ surface morphology was observed by scanning electron microscopy (SEM) on a S5500 microscope (Hitachi, Japan) The samples for SEM were prepared by spreading the undoped or Hf-doped anatase TiO2 on sticky conductive adhesive tape. Additionally, the microstructure was investigated by transmission electron microscopy (TEM) on a Titan 80–300 (FEI, USA) equipped with a spherical aberration (Cs) corrector of an electron probe. The TEM was operated under an acceleration voltage of 300 kV in a bright-field imaging and high-angular dark field scanning (HAADF STEM) mode. For (S)TEM observations, the specimens were dispersed during 5 min in the ultrasonic bath with ultrapure water, which was obtained using a Milli-Qwater purification system (Millipore, USA). Then, a drop of suspension was applied to a copper grid with a lacy carbon support film. TEM samples were treated for 20 s in a Model 1020 plasma cleaner (Fischione, USA) using the Ar/O2 gas mixture to reduce carbohydrate contamination. The Gatan Digital micrograph software was used for image processing and analysis. STEM image simulation was performed with the JEMS electron microscopy software. Energy-dispersive X-ray (EDX) microanalysis was performed on the Versa 3D SEM (FEI, USA) equipped with the high-count rate silicon drift detector Octane-plus (EDAX, USA). The accelerating voltage for EDX mapping was set to 15 keV and the beam current was 1.7 nA. The specific surface area was determined using the ASAP 2020 V3.04 H (Micrometrics, USA) spectrometer from isotherms of low-temperature adsorption of nitrogen by the Brunauer–Emmett–Teller (BET) method. The pore diameter and total volume of pores were evaluated using the original density functional theory. The surface chemistry was revealed by X-ray photoelectron spectroscopy (XPS) on a Phoibos 150 hemispherical electrostatic energy analyser (SPECS, Germany). Mg Kα-radiation was used as the primary excitation source. The measurements were refined for possible charging effects by assigning a value of 285.0 eV to the C 1 s reference line resulting from the thin layer of residual hydrocarbon. To investigate the crystal structure of materials, X-ray diffraction (XRD) and Raman spectroscopy were used. The D8-Advance diffractometer (Bruker, Germany) with Cu Kα-radiation was applied for XRD measurements. Identification of the XRD data was performed using the EVA program with the PDF-2 (2006) powder database. Raman studies were conducted on the RFS-100/S spectrometer (Bruker, Germany) equipped with a Ge detector. As the excitation source an Nd:YAG laser with a wavelength of 1064 nm was applied. Thermogravimetry (TG) was carried out on the DTG-60H derivatograph (Shimadzu, Japan) at a heating rate of 5°C min–1 under an air atmosphere from room temperature to 1000°C.
2.3. Electrochemical tests
The working electrode was composed of anatase Ti1–xHfxO2 (x = 0; 0.01; 0.03; 0.05) as an active material, Super P carbon black (Alfa Aesar, USA) as a conductive additive and polyvinylidene fluoride (MTI, USA) as a binder at a weight ratio of 80 : 10 : 10. The mixture was homogenized in the N-methylpyrrolidone solvent (Ekos-I, Russia) using the C-MAG HS 7 magnetic stirrer (IKA, China) at a rate of 300 r.p.m. for 15 h to prepare a homogeneous viscous slurry. Then, the electrode slurry was spread onto a copper current collector sheet (thickness is 11 µm) by the doctor blade method using the AFA-I instrument (MTI, USA). The electrode sheet was dried at 70°C for 7 h in the DZF-6020-110P oven (MTI, USA). The T06 tool (MTI, USA) was used for the cutting of a round electrode disc (diameter is 1.5 cm) from the sheet. Finally, the working electrode was compacted at 1000 kg cm–2 on a C3851 press (Carver, USA) and dried under vacuum at 110°C overnight. The mass loading of active material was approximately 2 mg cm–2.
The half-cell was assembled in a 890-NB glove box (Plas-Labs, USA) under a dry (H2O < 1 ppm) Ar-filled (purity is 99.999%) atmosphere. A two-electrode ECC-STD cell (Bio-Logic, USA) was applied to test the electrochemical performance. Lithium metal (Lithium-Element, Russia) was used as a counter and reference electrode. A 1 M solution of LiClO4 in the mix of propylene carbonate and dimethoxyethane at a volume ratio of 5 : 1 (Ekotech, Russia) was applied as the electrolyte. To prevent short circuit, a Celgard 2400 polypropylene separator (Celgard, USA) was used.
Galvanostatic cycling tests at the rates of C/10 and 1C (C is equal to 335 mA g–1) were performed on a 1470E potentiostat/galvanostat (Solartron, UK) between the potentials of 1.0 and 3.0 V. In the experiments, because of applying half-cells, the discharge implies a lithiation process, while the charge implies de-lithiation. Electrochemical impedance spectroscopy (EIS) data were collected on a 1455 (Solartron, UK) frequency response analyser at room temperature for the fresh cells at open-circuit potential with an AC amplitude of 5 mV over a frequency range from 1 MHz to 100 mHz. The measurements were carried out on at least six half-cells for each test.
3. Results and discussion
3.1. Morphology, composition and crystal structure of Ti1–xHfxO2
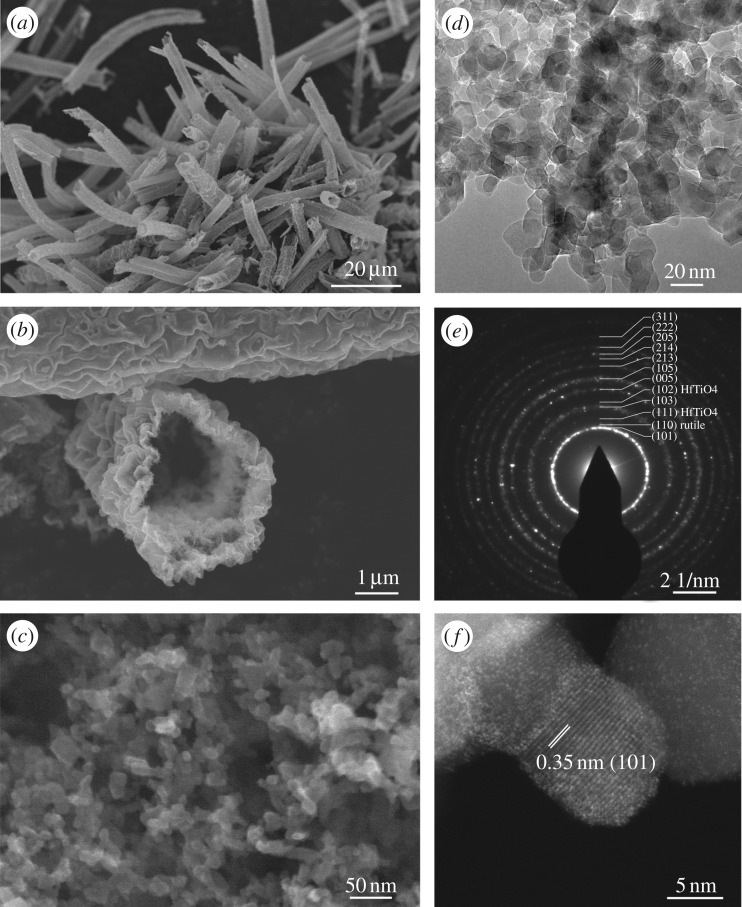
The SEM investigations show that as-synthesized undoped TiO2, Ti0.99Hf0.01O2, Ti0.97Hf0.03O2 and Ti0.95Hf0.05O2 samples have a similar microstructure. In this way, the Ti0.95Hf0.05O2 micrographs are presented as an example. Hence, the anatase TiO2-based materials consisted of tubes ranging in length from 5 to 50 µm (figure 1a). At the same time, some amounts of tubes with lengths up to 300 µm were observed. The outer diameter of tubes varies in the range 2–5 µm (figure 1b). Tubes have a nanostructured surface, their walls composed of nanoparticles (figure 1c). For a profound insight into the nanoparticulate morphology of anatase TiO2 doped with Hf4+, the (S)TEM investigations of Ti0.95Hf0.05O2 have been carried out. From the TEM images it can be seen that tubes consist of close-to-spherical nanoparticles with an average size of 15–20 nm (figure 1d). Additionally, TEM analysis demonstrates the structure of Ti0.95Hf0.05O2 presented by nanoparticles with inter-particle pores. The N2 adsorption isotherm and the corresponding evaluation of pore diameter and total volume of pores further confirm the porous microstructure of the Hf-doped TiO2. The average pore diameter for undoped titania is 1.48 nm and the total pore volume is 0.294 cm3 g–1. Ti0.95Hf0.05O2 possesses a pore diameter of 3.17 nm and total pore volume of 0.372 cm3 g–1. Furthermore, the Hf4+ doping of anatase titania increases the BET surface area from 80 m2 g–1 (undoped TiO2) to 90 m2 g–1 (Ti0.95Hf0.05O2), which seems due to the slightly reduced particle size. According to the literature [30], porosity and surface area have a beneficial effect on the electrochemical activity of anatase TiO2.
Figure 1.
(a–c) SEM micrographs, (d) TEM image in the bright-field mode, (e) corresponding SAED pattern, and (f) HAADF STEM picture for the Ti0.95Hf0.05O2 material.
The selective area electron diffraction (SAED) pattern (figure 1e) highlights the anatase TiO2 structure of nanoparticles: (101), (103), (005), (105), (213), (214), (205), (222) and (311) planes. The appearance of spots with inter-planar spacing of 0.32 nm associated with the (110) rutile plane indicates the existence of a rutile phase as an impurity. Spots with low intensity that could be measured as inter-planar spacings of 2.89 and 2.22 nm in the SAED pattern could be related to the (111) and (102) planes of HfTiO4 traces, and indicate that the maximum concentration of Hf into the TiO2 lattice is achieved for Ti0.95Hf0.05O2. Hence, the further increase of the Hf/Ti ratio (more than 0.05) is not rational.
From the HAADF STEM image of the Ti0.95Hf0.05O2 sample (figure 1f), showing TiO2 nanoparticles in different crystallographic orientation, one can see the inter-planar spacing of 0.35 nm assigned to the (101) plane of anatase TiO2. As is well known, the imaging in the HAADF STEM mode is atomic number-sensitive, so the contrast is proportional to Z2. Hence, owing to a large difference in atomic numbers (ZHf = 72 versus ZTi = 22), Hf atoms appear much brighter than the Ti species. Indeed, STEM imaging of Ti0.95Hf0.05O2 in the Z-contrast mode (figure 2a) reveals that, in some cases, Hf atoms occupy the positions of titanium in the anatase TiO2 crystal lattice. One of those Hf atoms is marked with a yellow circle in figure 2a, inset with higher magnification. Simulations of HAADF STEM images were performed to compare the difference in contrast presented at experimental images. The parameters of the microscope were set close to experimental ones. Two single Hf atoms were placed in the titanium atoms’ positions. Figure 2b and c, respectively, represents an experimental and simulated structure of anatase TiO2 in the (100) orientation, where the unit cell c direction aligned vertically. For qualitative interpretation, the intensity line profiles are shown in both images. It can be concluded that simulated data are in a good agreement with experimental ones and it is obvious that Hf atoms are incorporated into the lattice in the position of titanium atoms. In this study, we did not aim to visualize the oxygen atoms in anatase TiO2 structure, as it was previously reported [31]. Moreover, in the case of the nanoparticles, it is rather difficult to obtain exactly the predetermined zone axis, and also the weak scattering intensity of oxygen atoms makes them invisible in the presented micrographs.
Figure 2.
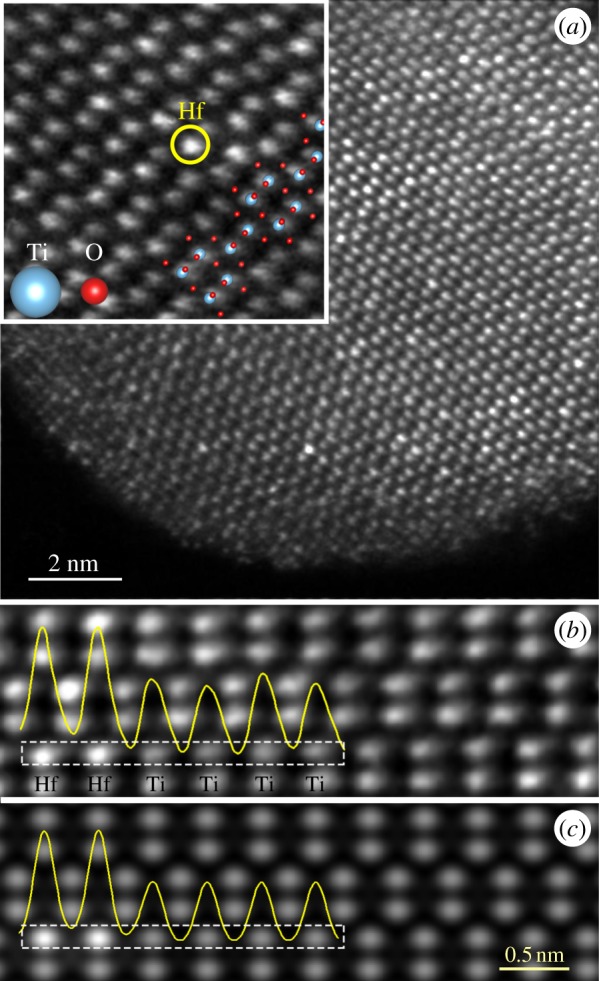
(a) Z-contrast image of Ti0.95Hf0.05O2 in the (100) orientation with a higher magnification picture (inset) of one individual dislocation core, (b) experimental, and (c) simulated crystal structure of anatase TiO2. The bright spots represent the Ti and Hf columns; pure O columns are not visible.
According to the elemental mapping, Ti, Hf and O elements (electronic supplementary material, figure S1) are uniformly distributed in Ti0.95Hf0.05O2. Thus, Hf is incorporated homogeneously into the anatase TiO2 crystal lattice. Moreover, EDX measurements give the Hf/Ti atomic ratio to be equal to 0.047, which is close to the aspired ratio of 0.05. Additionally, Si traces of 1.8 ± 0.2 at.% that originated from the Busofit-T055 fibre template were detected as an impurity for all TiO2 samples. In view of the atomic concentrations of Ti, Hf, Si and O, the presence of silicium in the form of SiO2 can be assumed.
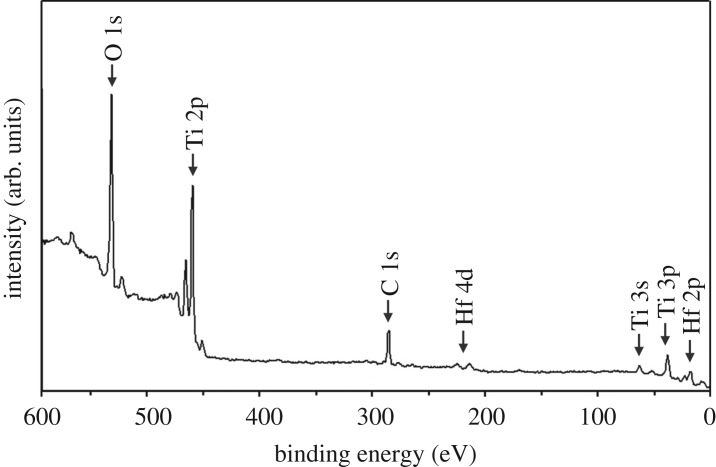
To examine the oxidation state of the Hf dopant, XPS analysis was carried out for the Ti0.95Hf0.05O2 sample. The XPS survey spectrum (figure 3) shows that Ti, O, Hf and C elements are clearly detected in the material, which is in accordance with EDX data. By contrast, Si was not found, which seems to be owing to a lower penetration depth (30 Å) of the XPS method in comparison with EDX (approx. 1 µm). The high-resolution spectrum of Ti 2p (electronic supplementary material, figure S2a) shows two peaks of Ti 2p3/2 at 459.1 eV and Ti 2p1/2 at 464.8 eV, indicating that titanium is present as Ti4+ [32]. Note that, for Hf-doped TiO2, there are no signals of Ti3+ (approx. 455.0 eV 27) in the Ti 2p spectrum results. This seems to indicate that the Ti oxidation state has not been changed owing to Hf doping. The O 1 s peak (electronic supplementary material, figure S2b) exhibits two main contributions. In particular, the binding energy of 530.6 eV belongs to oxygen atoms of the TiO2 lattice [33], whereas the band at 532.5 eV corresponds to chemisorbed water, and C─O and O═C─O bonds [34]. From the XPS results (electronic supplementary material, table S1), note that the O/Ti atomic ratio is close to 2 (46.0/20.5). The Hf 4f7/2 and Hf 4f5/2 peaks located at 16.8 eV and 18.4 eV (electronic supplementary material, figure S2c), respectively, indicate that the Hf oxidation state in the as-synthesized Hf-doped anatase TiO2 is 4+ [35]. The Hf/Ti atomic ratio in Ti0.95Hf0.05O2 was estimated to be 0.054 (electronic supplementary material, table S1), which is in agreement with EDX measurements and the synthesis procedure. The XPS data processing shows the multicomponent character of the high-resolution C 1 s spectrum (electronic supplementary material, figure S2d). The binding energies of 287.3 and 289.5 eV are associated with the C─O and O═C─O groups [34], respectively, while the value of 285.0 eV was related to the C─C or/and C─H bonds [36].
Figure 3.
XPS survey scan for the Ti0.95Hf0.05O2 sample.
Figure 4 shows the XRD patterns of undoped anatase TiO2 as well as of samples with different Hf-doping levels. The as-synthesized TiO2-based materials are well ascribed to the (101), (003), (004), (012), (200), (105), (211), (213), (204), (116), (220), (215), (301) and (224) reflections of the anatase phase with a tetragonal structure (JSCD no. 00-021-1272, space group I41/amd (figure 4a)). All the diffraction peaks are sharp, indicating favourable crystallinity. As expected, it is observed that the XRD peaks shift with increase in Hf concentration (figure 4b). This phenomenon indicates changing anatase TiO2 unit cell parameters. The ionic radius of Hf4+ is equal to 0.71 Å (CN = 6), while the radius of Ti4+ is equal to 0.604 Å (CN = 6) [37]. In accordance with the DFT model of Koudriachova et al. [38], it can be assumed that the Hf4+ dopant substitutes the Ti4+ ions in the crystal lattice of the TiO2 host and retains the original coordination number. As a result of Hf4+ ion incorporation into the anatase TiO2 structure, the difference in the ionic radius of metal ions increases lattice parameters. Indeed, the analysis of XRD patterns of undoped TiO2, Ti0.99Hf0.01O2, Ti0.97Hf0.03O2 and Ti0.95Hf0.05O2 samples shows that doping with Hf4+ results in increase in the a and с lattice constants of the anatase TiO2 unit cell. This confirms that metal ion substitution in the Ti4+ sites forms anatase Ti1–xHfxO2 (x = 0.01; 0.03; 0.05) solid solutions. The unit cell volume (V) of Ti1–xHfxO2 increases in the range 136.914–138.062 Å3 (table 1), directly depending on the Hf/Ti atomic ratio. As reported previously [26], the latter is favourable for reversible Li+ ion intercalation. From the XRD patterns there are no peaks attributed to the HfTiO4 phase, which clearly confirms its trace quantity. The low-intensity peak at 27.4° (figure 4a, asterisk) corresponds to (110) reflection of the rutile phase (JSCD no. 00-021-1276, space group P42/mnm), which coexisted with the anatase as the main phase.
Figure 4.
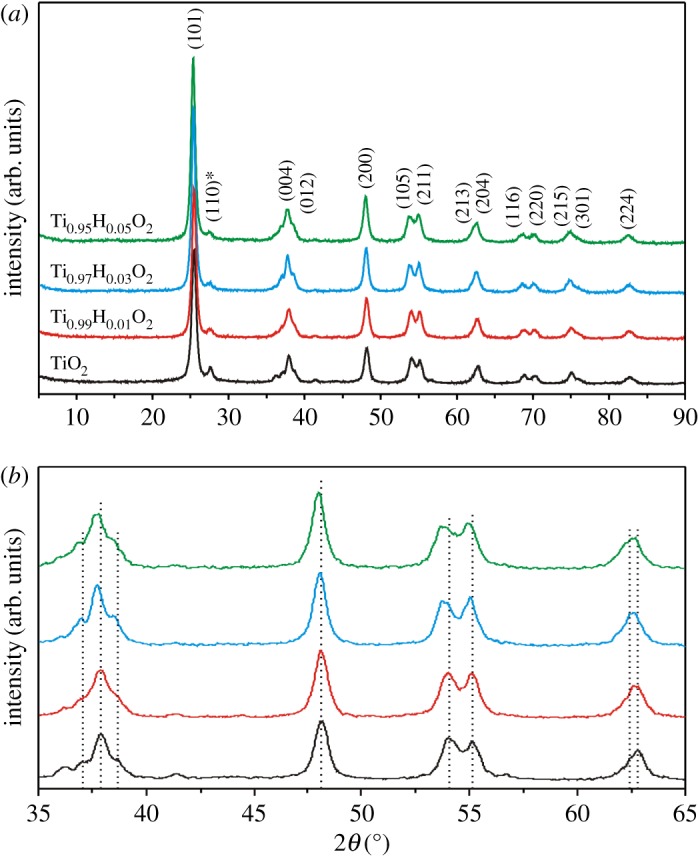
(a) XRD patterns for the Ti1–xHfxO2 samples with different Hf/Ti ratios from 0 to 0.05 and (b) magnified picture between 2θ values of 35° and 65°, obviously representing the peak shifts.
Table 1.
Changing a and с lattice constants and unit cell volume V of undoped and Hf-doped anatase TiO2.
| sample | a (Å) | c (Å) | V (Å3) |
|---|---|---|---|
| TiO2 | 3.785 | 9.514 | 136.914 |
| Ti0.99Hf0.01O2 | 3.792 | 9.520 | 136.891 |
| Ti0.97Hf0.03O2 | 3.798 | 9.550 | 137.796 |
| Ti0.95Hf0.05O2 | 3.801 | 9.556 | 138.062 |
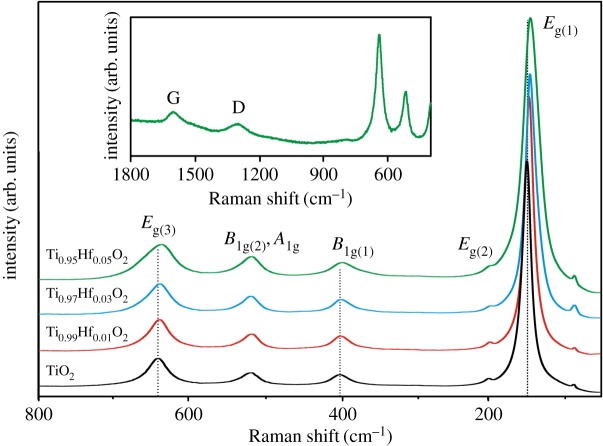
The Raman spectra (figure 5) of as-synthesized undoped TiO2, Ti0.99Hf0.01O2, Ti0.97Hf0.03O2 and Ti0.95Hf0.05O2 correspond to the crystallization of nanoparticles with anatase crystal structure. The results confirmed that incorporation of Hf4+ ions has a significant influence on the TiO2 unit cell. Indeed, for Hf-doped anatase TiO2 the shift of Eg(1), B1 g(1) and Eg(3) peaks to lower frequencies was found (electronic supplementary material, table S2). The shift of the Eg(3) peak from 638.7 to 636.1 cm–1 in the Raman spectra of Ti1–xHfxO2 (x = 0; 0.01; 0.03; 0.05) corresponds to the stretching vibrations associated with a weakening of Ti─O bonds, confirming the fact that Hf4+ is incorporated as a substitutional dopant. The main contribution to the energy of the B1 g(1) deformation mode originates from Ti4+ ions. Hence, because of Hf4+ substitution in the Ti4+ sites, the average distance between ions increased, which results in the low-frequency shift (between 396.9 and 395.1 cm–1) of B1 g(1). The high-intensity Eg(1) peak undergoes the greatest shift (from 147.5 to 143.4 cm–1) because of its sensitivity to changes in unit–cell parameters of TiO2 owing to the incorporation of Hf4+ ions. Additionally, the shift of Eg(1) may also indicate the existence of oxygen vacancies caused by increasing a and c lattice parameters. The appearance of oxygen vacancies in TiO2 results in reduction of some Ti4+ to Ti3+ in order to maintain the charge balance [23]. However, no Ti3+ signal has been detected from XPS data for Ti0.95Hf0.05O2, probably owing to the instability of the surface Ti3+ species in air [39]. The Raman measurements support the negligible concentrations of both rutile TiO2 and HfTiO4. Moreover, in spite of the EDX data in the Raman spectra of all samples there are no bands of crystalline silica. Possibly, because of its high crystallization temperature (1350°C [40]), the SiO2 is amorphous. At the same time, it should be noted that all samples displayed the typical low-intensity D (1305 cm–1) and G (1590 cm–1) peaks (figure 5, inset) associated with the annealed carbon template in the amorphous and graphitized states [41].
Figure 5.
Raman spectra for undoped TiO2, Ti0.99Hf0.01O2, Ti0.97Hf0.03O2 and Ti0.95Hf0.05O2 materials. The inset displays the D and G bands in the Raman spectrum for Ti0.95Hf0.05O2.
To evaluate the concentration of carbon originated from the pyrolysis of Busofit-T055 fibre, thermogravimetric analysis (TGA) was performed. As shown in figure 6, the TGA curves of Ti1–xHfxO2 (x = 0; 0.01; 0.03; 0.05) samples depict three steps of weight loss. The first region below 200°C is associated with the release of H2O adsorbed on the TiO2 surface [42]. The second interval from 200 to 650°C is related to the removal of residual carbon because the Busofit-T055 carbon fibre is fully decomposed at approximately 650°C (figure 6, inset). The third weight loss step between 650 and 850°C can be attributed to the dehydration of surface Ti(OH)2 [43]. Thus, the overall weight loss for all samples varies between 2.5% and 5.5%.
Figure 6.
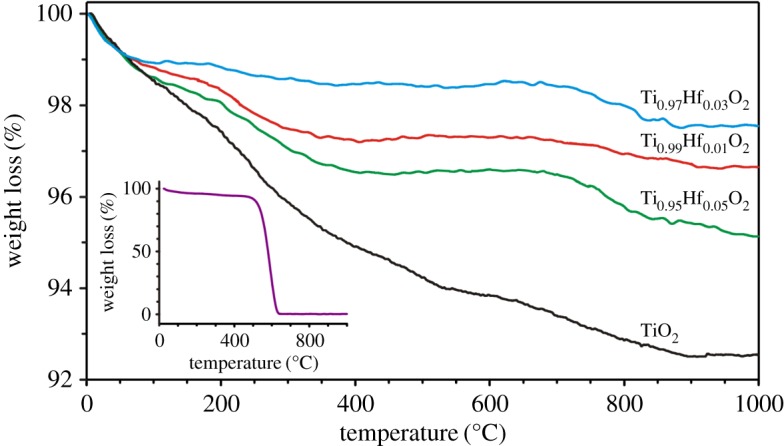
TGA curves for Ti1–xHfxO2 samples with different Hf concentrations as well as for the Busofit-T055 carbon fibre template (inset).
3.2. Electrochemical performance of Ti1–xHfxO2
Figure 7a presents the charge/discharge profiles of undoped TiO2, Ti0.99Hf0.01O2, Ti0.97Hf0.03O2 and Ti0.95Hf0.05O2 for the first cycle. Note that initial specific capacity values for all samples are within the range of 300–325 mAh g–1. On the other hand, the theoretical capacity of TiO2 reaches 335 mAh g–1 (equation (3.1)). Possibly, lower first discharge capacities result from the presence of impurities (amorphous SiO2, HfTiO4). Additionally, limited Li+ ion diffusivity into TiO2 crystal structure is not ruled out. The first charge cycle characterizes the Li+ de-intercalation from TiO2-based samples. The reversible capacity of undoped TiO2 is equal to 111.3 mAh g–1 (insertion of 0.34 Li+ ions into the TiO2 structural unit). At the same time, Ti0.99Hf0.01O2, Ti0.97Hf0.03O2 and Ti0.95Hf0.05O2 samples yielded 130.5, 135.7 and 170.1 mAh g–1, respectively, which corresponds to de-intercalation of 0.39 Li+, 0.41 Li+ and 0.50 Li+ per titania unit. The obtained data represent the better Li+ ions pathways through Ti0.95Hf0.05O2 structure, which seem to be because of increase of the unit cell parameters after Hf4+ doping:
| 3.1 |
Figure 7.
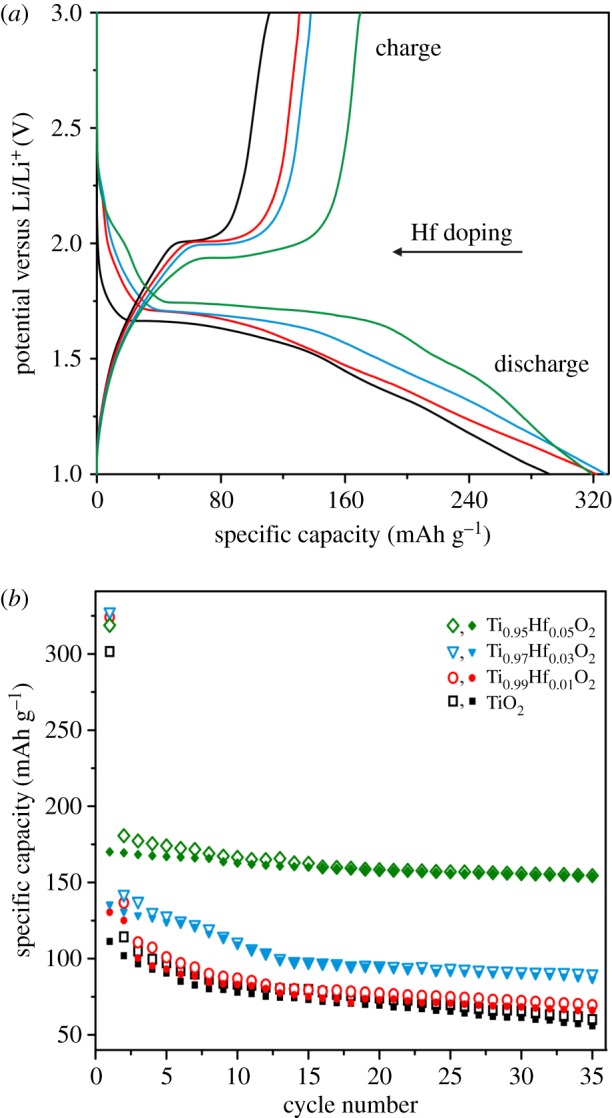
(a) First charge/discharge profiles and (b) cycling performances (open symbols, discharge; filled, charge) for Ti1–xHfxO2 (x = 0.01; 0.03; 0.05) samples at C/10 in the voltage range of 1.0–3.0 V.
After the 35th cycle (figure 7b), the reversible capacities stabilized at 55.9 mAh g–1 (TiO2), 66.1 mAh g–1 (Ti0.99Hf0.01O2), 86.4 mAh g–1 (Ti0.97Hf0.03O2) and 154.2 mAh g–1(Ti0.95Hf0.05O2). Thus, the Ti0.95Hf0.05O2 material shows higher stability during Li+ intercalation/de-intercalation into/from the crystal structure. The obtained results are in a good accordance with ones for nanostructured Zr-doped anatase TiO2 tubes published previously [28]. In particular, based on the Raman spectroscopy and charge/discharge tests, the effect of the dopant ionic radius on doped TiO2 electrochemical behaviour was established. At the same time, Ti0.95Zr0.03O2, which was the best sample, exhibited a reversible capacity of only 135 mAh g–1 after 35 cycles at a C/10 rate. Such worse performance can be explained by the slightly larger ionic radius of Zr4+ (0.72 Ǻ) when compared with that of Hf4+, which may cause the undesirable excessive lattice strain in anatase TiO2. This suggestion is also confirmed by our unsuccessful efforts to increase the Zr to Ti ratio to more than 0.03.
Overall, the capacity of nanostructured Hf-doped anatase TiO2 tubes is higher than that of Nb-doped TiO2 nanofibres (128 and 92 mAh g–1 for the 20th cycle at rates of C/20 and C/5, respectively), as demonstrated by Fehse et al. [44]. On the other hand, Wang et al. [32] reported an enhanced cycling performance (160 mAh g–1 after the 100 cycles at a C/6 rate) for mesoporous Nb-doped anatase titania with a specific surface of 128 m2 g–1. Hence, the relationship between the synthesis technique as well as morphology and electrochemical behaviour of the material is very strong. Note that, in the present work, the direct comparison of nanostructured undoped and Hf-doped anatase titania tubes reveals a superior cycling performance of the doped samples.
To understand the reasons of higher performance behaviour of Hf-doped anatase TiO2 electrodes, the EIS method was applied. As shown in figure 8, the Nyquist plot consists of the high-frequency semicircle and the low-frequency arc. The EIS spectra have been fitted (table 2) using an equivalent circuit (figure 8, inset) composed of internal resistance Rs, charge transfer resistance Rct at the double layer CPEdl (and, possibly, Li+ migration through the SEI) and Warburg impedance Zw associated with diffusion of Li+ ions into the solid phase. The collected data demonstrate that the incorporation of Hf4+ ions into the anatase TiO2 crystal lattice enhances conductivity. Indeed, Ti0.95Hf0.05O2 presents the shorter diameter of a high-frequency semicircle, implying a smaller Rct (60.9 Ω) in comparison with undoped TiO2 (249.2 Ω), Ti0.99Hf0.01O2 (204.4 Ω) and Ti0.97Hf0.03O2 (123.8 Ω). This shows that charge redistribution associated with Hf4+ doping is achieved by creation of oxygen vacancies in the anatase TiO2 lattice, and, possibly, owing to reduction of some Ti4+ ions to Ti3+ in order to maintain the charge balance.
Figure 8.
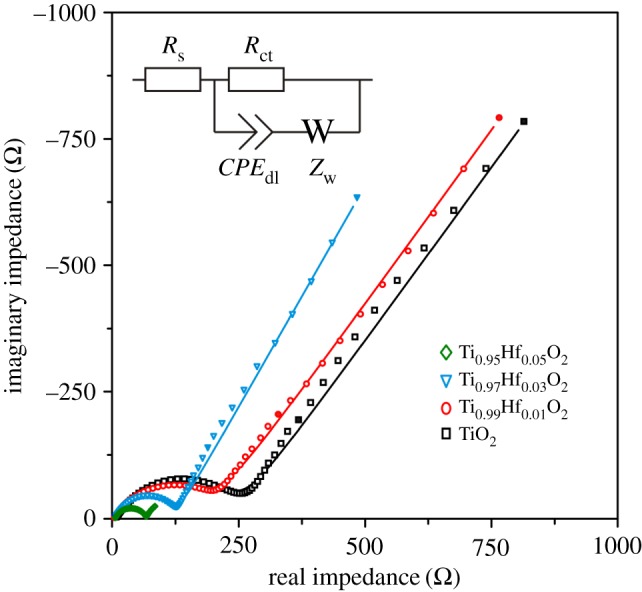
EIS spectra (the frequencies of 0.1 Hz and 1 Hz are marked by filled symbols) for undoped TiO2, Ti0.99Hf0.01O2, Ti0.97Hf0.03O2 and Ti0.95Hf0.05O2 electrodes fitted (solid lines) with equivalent circuits (inset).
Table 2.
Calculated EIS parameters for Ti1–xHfxO2 (x = 0.00; 0.01; 0.03; 0.05) electrodes.
| sample | Rs (Ω) | Rct (Ω) | σw (Ω s–1/2) | DLi (cm2 s–1) |
|---|---|---|---|---|
| TiO2 | 6.2 | 249.2 | 516.8 | 7.3 × 10⁻¹⁷ |
| Ti0.99Hf0.01O2 | 5.9 | 204.4 | 506.1 | 7.7 × 10⁻¹⁷ |
| Ti0.97Hf0.03O2 | 6.1 | 123.8 | 342.1 | 1.7 × 10⁻¹⁶ |
| Ti0.95Hf0.05O2 | 6.0 | 60.9 | 16.8 | 6.9 × 10⁻¹⁴ |
For further insight into improved cyclability of the Hf-doped anatase TiO2, low-frequency Warburg contribution in the Nyquist EIS spectra was analysed. The diffusion coefficients DLi (cm2 s–1), calculated (table 2) from the Warburg factor σw (Ω s–1/2) equation (equation (3.2)), were 7.3 × 10⁻¹⁷ cm2 s–1 (TiO2), 7.7 × 10⁻¹⁷ cm2 s–1 (Ti0.99Hf0.01O2), 1.7 × 10⁻¹⁶ cm2 s–1 (Ti0.97Hf0.03O2) and 6.9 × 10⁻¹⁴ cm2 s–1 (Ti0.95Hf0.05O2). Hence, it is evident that Hf-doping improves Li+ diffusivity. The undoped TiO2 is characterized by almost three orders of magnitude slower solid-state diffusion of Li+ when compared with Ti0.95Hf0.05O2:
| 3.2 |
where R is the gas constant (J mol−1 K−1), T is the temperature (K), S is the contact area between the electrode and electrolyte (cm2), n is the charge transfer number, F is the Faraday constant (C mol−1) and CLi is the concentration of Li+ in TiO2 (mol cm–3). The Warburg factor was found (table 2) from the slope of the fitting line in the plot of the real axis impedance values Z′ versus the reciprocal square root of the angular frequencies ω–1/2 (electronic supplementary material, figure S3) according to the following relationship:
| 3.3 |
Figure 9 reveals the reversibility of Li+ ion intercalation/de-intercalation into/from the Ti0.95Hf0.05O2 electrode after its cycling at different C-rates. Ti0.95Hf0.05O2 was first cycled at C/10 and, after seven cycles, the rate was increased up to 1C. A reversible capacity of 165.0 mAh g–1 was obtained at a C/10 rate after the seventh cycle. However, during the further charge/discharge cycling (8–14 cycles) at a rate of 1C, the capacity decreases down to 56.7 mAh g–1. At the same time, the specific capacity of Ti0.95Hf0.05O2 is restored up to about 151.8 mAh g–1 in the range from 15 to 21 cycles. The results show good durability of the Hf-doped anatase TiO2 electrode to the increased loading. The material shows that stable coulombic efficiency slightly depended on the current density.
Figure 9.
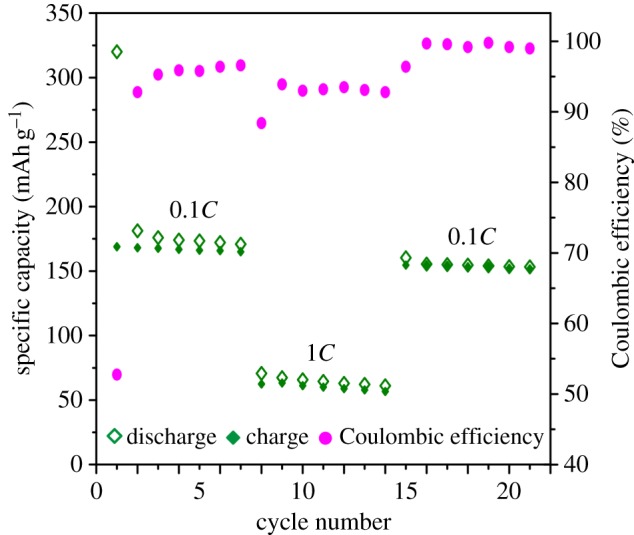
Specific capacity retention during Ti0.95Hf0.05O2 cycling at rates of C/10 and 1C.
4. Conclusion
In this work, a promising facile way of TiO2 modification by Hf-doping via a template sol–gel route in order to improve its Li+ storage properties is suggested. It was found that the as-synthesized Ti1–xHfxO2 (x = 0.01; 0.03; 0.05) materials are microtubes (length of 10–100 µm, outer diameter of 1–5 µm) composed of nanoparticles with an average size of 15–20 nm. The surface areas of the Ti1–xHfxO2 microtubes are in the range of 80–90 m2 g–1 and the pore volumes are 0.294–0.372 cm3 g–1. Results indicate that the Ti0.99Hf0.01O2, Ti0.97Hf0.03O2 and Ti0.95Hf0.05O2 materials have an anatase crystal structure. As demonstrated, the Hf4+ ions are homogeneously incorporated into the titania lattice by substitution of Ti4+. Owing to the incorporation of Hf ions the titania unit cell parameters are increased. When the Ti1–xHfxO2 materials are used as LIB anodes, the lithiation and de-lithiation capacities as well as cycling performance of the as-synthesized TiO2-based materials significantly improved by Hf4+ doping. Indeed, 35-fold charge/discharge cycling at a C/10 rate in the range 1.0–3.0 V shows that the reversible capacity for Hf-doped TiO2 is significantly higher (e.g. 154.2 mAh g–1for Ti0.95Hf0.05O2) than that for the undoped titania (55.9 mAh g–1). The Hf4+ substitution of the Ti4+ in TiO2 structure leads to the charge transfer resistance Rct decreasing (62.1 versus 280.1 Ω for Ti0.95Hf0.05O2 and undoped TiO2 respectively), which seems to be because of enhancement of conductivity. Moreover, the diffusion coefficient DLi of Li+ ions is increased by almost three orders of magnitude from 7.33 × 10⁻¹⁷ cm2 s–1 (TiO2) up to 6.91 × 10⁻¹⁴ cm2 s–1 (Ti0.95Hf0.05O2). Overall, the better reversibility of the electrochemical process occurring in Hf-doped anatase TiO2 electrodes is associated with: (i) changing of the unit cell parameters, which facilitates Li+ ion diffusion; (ii) charge redistribution in the lattice, which improves conductivity of TiO2; and (iii) increased surface area, which enhances interfacial lithium storage. Comparison of the obtained results with those for Zr-doped anatase TiO2 published earlier demonstrates that ionic radius of dopant Mn+ partially substituted with Ti4+ in the anatase TiO2 lattice is a key factor for the design of advanced anodes for high-safety LIBs.
Supplementary Material
Acknowledgements
The authors are grateful to colleagues from the Institute of Chemistry of FEB RAS (Vladivostok, Russia), V.Yu. Mayorov (for BET and DFT analysis), D.V. Mashtalyar (for TGA measurements), T.A. Kaydalova (for XRD calculations) and Y.V. Sushkov (for Raman spectra recording).
Data accessibility
Our data have been deposited in the Dryad Digital Repository: (http://dx.doi.org/10.5061/dryad.gf63r) [45].
Authors' contributions
S.V.G., S.L.S. and V.V.Z. designed the study. S.V.G., S.L.S. and D.P.O. carried out the material laboratory work, interpreted the XRD, BET and TGA data, participated in data analysis and drafted the manuscript. V.V.Z. synthesized the materials. E.B.M. carried out the microstructure characterization and analysis. E.I.V. interpreted the Raman data. A.Y.U. collected and analysed XPS data. D.P.O. and A.A.S. carried out the electrochemical investigations and obtained data interpretation. V.I.S. coordinated the study and helped draft the manuscript. All the authors gave their final approval for publication.
Competing interests
The authors declare no competing interests.
Funding
The studies were carried out with the support of Russian Science Foundation (grant no. 17-73-10131).
References
- 1.Zhang H, Mao C, Li J, Chen R. 2017. Advances in electrode materials for Li-based rechargeable batteries. RCS Adv. 7, 33 789–33 811. (doi:10.1039/C7RA04370H) [Google Scholar]
- 2.Morgan BJ. 2017. Lattice-geometry effects in garnet solid electrolytes: a lattice-gas Monte Carlo simulation study. R. Soc. open sci. 4, 170824 (doi:10.1098/rsos.170824) [DOI] [PMC free article] [PubMed] [Google Scholar]
- 3.Zhao S, Zhang MM, Xian XC, Ka O, Wang ZH, Wang J. 2016. Insight into the formation mechanism of Li4Ti5O12 microspheres obtained by a CTAB-assisted synthetic method and their electrochemical performances. J. Mater. Chem. A 5, 13 740–13 747. (doi:10.1039/C7TA03734A) [Google Scholar]
- 4.Nikiforova PA, Stenina IA, Kulova TL, Skundin AM, Yaroslavtsev AB. 2016. Effect of particle size on the conductive and electrochemical properties of Li2ZnTi3O8. Inorg. Mater. 52, 1137–1142. (doi:10.1134/S002016851611011X) [Google Scholar]
- 5.Jing M-x, Li J-q, Han C, Yao S-s, Zhang J, Zhai H-a, Chen L-l, Shen X-q, Xiao K-s. 2017. Electrospinning preparation of oxygen-deficient nano TiO2−x/carbon fibre membrane as a self-standing high performance anode for Li-ion batteries. R. Soc. open sci. 4, 170323 (doi:10.1098/rsos.170323) [DOI] [PMC free article] [PubMed] [Google Scholar]
- 6.Ding M, Liu H, Zhao X, Pang L, Deng L, Li M. 2017. Composite with TiO2 and extension of discharge voltage range for capacity enhancement of a Li4Ti5O12 battery. RCS Adv. 7, 43 894–43 904. (doi:10.1039/C7RA07390A) [Google Scholar]
- 7.Bresser D, Paillard E, Passerini S. 2015. Chapter 7. Lithium-ion batteries (LIBs) for medium- and large-scale energy storage. In Advances in batteries for medium and large-scale energy storage (eds Menictas C, Skyllas-Kazacos M, Lim TM), pp. 213–289. Sawston, UK: Woodhead Publishing. [Google Scholar]
- 8.Weng Z, Guo H, Liu X, Wu S, Yeung KWK, Chu PK. 2013. Nanostructured TiO2 for energy conversion and storage. RCS Adv. 3, 24758 (doi:10.1039/C3RA44031A) [Google Scholar]
- 9.Liang K, Chen X, Guo Z, Hou T, Zhang X, Li Y. 2016. Lithium intercalation and diffusion in TiO2 nanotubes: a first-principles investigation. Phys. Chem. Chem. Phys. 18, 24 370–24 376. (doi:10.1039/C6CP03830A) [DOI] [PubMed] [Google Scholar]
- 10.Zhu P, Wu Y, Reddy MV, Nair AS, Chowdari BVR, Ramakrishna S. 2012. Long term cycling studies of electrospun TiO2 nanostructures and their composites with MWCNTs for rechargeable Li-ion batteries. RCS Adv. 2, 531–537. (doi:10.1039/C1RA00514F) [Google Scholar]
- 11.Lewis CS, Li YR, Wang L, Li J, Stach EA, Takeuchi KJ, Marschilok AC, Takeuchi ES, Wong SS. 2016. Correlating titania nanostructured morphologies with performance as anode materials for lithium-ion batteries. ACS Sustainable Chem. Eng. 4, 6299–6312. (doi:10.1021/acssuschemeng.6b00763) [Google Scholar]
- 12.Xu W, Wang Z, Guo Z, Liu Y, Zhou N, Niu B, Shi Z, Zhang H. 2013. Nanoporous anatase TiO2/single-wall carbon nanohorns composite as superior anode for lithium ion batteries. J. Power Sources 232, 193–198. (doi:10.1016/j.jpowsour.2012.12.115) [Google Scholar]
- 13.Teng D, Yu Y, Yang X. 2014. Hierarchical flower-like TiO2/MPCNFs as a free-standing anode with superior cycling reversibility and rate capability. RCS Adv. 4, 12309 (doi:10.1039/C3RA47685E) [Google Scholar]
- 14.Dong L, et al. 2014. Hydrothermal synthesis of mixed crystal phases TiO2–reduced graphene oxide nanocomposites with small particle size for lithium ion batteries. Int. J. Hydrogen Energ. 39, 16 116–16 122. (doi:10.1016/j.ijhydene.2014.01.029) [Google Scholar]
- 15.Zheng H, Ncube NM, Raju K, Mphahlele N, Mathe M. 2016. The effect of polyaniline on TiO2 nanoparticles as anode materials for lithium ion batteries. SpringerPlus 5, 2905 (doi:10.1186/s40064-016-1908-z) [DOI] [PMC free article] [PubMed] [Google Scholar]
- 16.Lai C, Li GR, Dou YY, Gao XP. 2010. Mesoporous polyaniline or polypyrrole/anatase TiO2 nanocomposite as anode materials for lithium-ion batteries. Electrochim. Acta 55, 4567–4572. (doi:10.1016/j.electacta.2010.03.010) [Google Scholar]
- 17.Xu W, Wang T, Yu Y, Wang S. 2016. Synthesis of core-shell TiO2/MoS2 composites for lithium-ion battery anodes. J. Alloy. Compd 689, 460–467. (doi:10.1016/j.jallcom.2016.07.185) [Google Scholar]
- 18.Vassiliev SYu, Yusipovich AI, Rogynskaya YuE, Chibirova FKh, Skundin AM, Kulova TL. 2005. Nanostructured SnO2-TiO2 films as related to lithium intercalation. J. Solid State Electrochem. 9, 698–705. (doi:10.1007/s10008-005-0646-x) [Google Scholar]
- 19.Su Y, Zhang J, Liu K, Huang Z, Ren X, Wang C-A. 2017. Simple synthesis of a double-shell hollow structured MnO2/TiO2 composite as an anode material for lithium ion batteries. RCS Adv. 7, 46 263–46 270. (doi:10.1039/C7RA09628C) [Google Scholar]
- 20.Liu Y, Yang Y. 2016. Recent progress of TiO2-based anodes for Li ion batteries. J. Nanomater. 2016, 1–15. (doi:10.1155/2016/8123652) [Google Scholar]
- 21.Wang Y, Chen T, Mu Q. 2011. Electrochemical performance of W-doped anatase TiO2 nanoparticles as an electrode material for lithium-ion batteries. J. Mater. Chem. 21, 6006 (doi:10.1039/C0JM04275G) [Google Scholar]
- 22.Duan J, Hou H, Liu X, Yan C, Liu S, Meng R, Hao Z, Yao Y, Liao Q. 2016. In situ Ti3+-doped TiO2 nanotubes anode for lithium ion battery. J. Porous Mater. 23, 837–843. (doi:10.1007/s10934-016-0139-6) [Google Scholar]
- 23.Zhang J, Zhang J, Ren H, Yu L, Wu Z, Zhang Z. 2014. High rate capability and long cycle stability of TiO2−δ–La composite nanotubes as anode material for lithium ion batteries. J. Alloy. Compd 609, 178–184. (doi:10.1016/j.jallcom.2014.04.115) [Google Scholar]
- 24.Anh LT, Rai AK, Thi TV, Gim J, Kim S, Shin E-C, Lee J-S, Kim J. 2013. Improving the electrochemical performance of anatase titanium dioxide by vanadium doping as an anode material for lithium-ion batteries. J. Power Sources 243, 891–898. (doi:10.1016/j.jpowsour.2013.06.080) [Google Scholar]
- 25.Thi TV, Rai AK, Gim J, Kim S, Kim J. 2014. Effect of Mo6+ doping on electrochemical performance of anatase TiO2 as a high performance anode material for secondary lithium-ion batteries. J. Alloy. Compd 598, 16–22. (doi:10.1016/j.jallcom.2014.02.019) [Google Scholar]
- 26.Zhang W, Gong Y, Mellott NP, Liu D, Li J. 2015. Synthesis of nickel doped anatase titanate as high performance anode materials for lithium ion batteries. J. Power Sources 276, 39–45. (doi:10.1016/j.jpowsour.2014.11.098) [Google Scholar]
- 27.Lai Y, Liu W, Fang J, Qin F, Wang M, Yu F, Zhang K. 2015. Fe-doped anatase TiO2/carbon composite as an anode with superior reversible capacity for lithium storage. RCS Adv. 5, 93 676–93 683. (doi:10.1039/C5RA19518G) [Google Scholar]
- 28.Opra DP, Gnedenkov SV, Sinebryukhov SL, Voit EI, Sokolov AA, Modin EB, Podgorbunsky AB, Sushkov YuV, Zheleznov VV. 2017. Characterization and electrochemical properties of nanostructured Zr-doped anatase TiO2 tubes synthesized by sol–gel template route. J. Mater. Sci. Technol. 33, 527–534. (doi:10.1016/j.jmst.2016.11.011) [Google Scholar]
- 29.Zheleznov VV, Voit EI, Sushkov YV, Sarin SA, Kuryavyi VG, Opra DP, Gnedenkov SV, Sinebryukhov SL, Sokolov AA. 2016. Nanostructured microtubes based on TiO2 doped by Zr and Hf oxides with the anatase structure. IOP Conf. Ser.: Mater. Sci. Eng. 112, 012016 (doi:10.1088/1757-899X/112/1/012016) [Google Scholar]
- 30.Zhu W, Yang H, Nakanishi K, Kanamori K, Guo X. 2015. Sol–gel synthesis of nanocrystal-constructed hierarchically porous TiO2 based composites for lithium ion batteries. RCS Adv. 5, 24 803–24 813. (doi:10.1039/C5RA03491D) [Google Scholar]
- 31.Lu W, Bruner B, Casillas G, Mejía-Rosales Se, Farmer PJ, José-Yacamán M. 2012. Direct oxygen imaging in titania nanocrystals. Nanotechnol. 23, 335706 (doi:10.1088/0957-4484/23/33/335706) [DOI] [PubMed] [Google Scholar]
- 32.Wang Y, Smarsly BM, Djerdj I. 2010. Niobium doped TiO2 with mesoporosity and its application for lithium insertion. Chem. Mater. 22, 6624–6631. (doi:10.1021/cm1020977) [Google Scholar]
- 33.Benjwal P, Kar KK. 2015. Removal of methylene blue from wastewater under a low power irradiation source by Zn, Mn co-doped TiO2 photocatalysts. RCS Adv. 5, 98 166–98 176. (doi:10.1039/C5RA19353B) [Google Scholar]
- 34.Kyeremateng NA, Vacandio F, Sougrati M-T, Martinez H, Jumas J-C, Knauth P, Djenizian T. 2013. Effect of Sn-doping on the electrochemical behaviour of TiO2 nanotubes as potential negative electrode materials for 3D Li-ion micro batteries. J. Power Sources 224, 269–277. (doi:10.1016/j.jpowsour.2012.09.104) [Google Scholar]
- 35.Reddy BM, Bharali P, Saikia P, Park S-E, van den Berg MWE, Muhler M, Grünert W. 2008. Structural characterization and catalytic activity of nanosized CexM1–xO2 (M = Zr and Hf) mixed oxides. J. Phys. Chem. C 112, 11729 (doi:10.1021/jp802674m) [Google Scholar]
- 36.Gnedenkov SV, Opra DP, Sinebryukhov SL, Kuryavyi VG, Ustinov AYu, Sergienko VI. 2015. Structural and electrochemical investigation of nanostructured C:TiO2–TiOF2 composite synthesized in plasma by an original method of pulsed high-voltage discharge. J. Alloy. Compd 621, 364–370. (doi:10.1016/j.jallcom.2014.10.023) [Google Scholar]
- 37.Shannon RD. 1976. Revised effective ionic radii and systematic studies of interatomic distances in halides and chalcogenides. Acta Cryst. 32, 751–767. (doi:10.1107/S0567739476001551) [Google Scholar]
- 38.Koudriachova MV, Harrison NM. 2006. Li sites and phase stability in TiO2-anatase and Zr-doped TiO2-anatase. J. Mater. Chem. 16, 1973 (doi:10.1039/B600794P) [Google Scholar]
- 39.Hoang S, Berglund SP, Hahn NT, Bard AJ, Mullins CB. 2012. Enhancing visible light photo-oxidation of water with TiO2 nanowire arrays via cotreatment with H2 and NH3: synergistic effects between Ti3+ and N. J. Am. Chem. Soc. 134, 3659–3662. (doi:10.1021/ja211369s) [DOI] [PubMed] [Google Scholar]
- 40.Cadoret L, Rossignol C, Dexpert-Ghys J, Caussat B. 2010. Chemical vapor deposition of silicon nanodots on TiO2 submicronic powders in vibrated fluidized bed. Mater. Sci. Eng. B 170, 41–50. (doi:10.1016/j.mseb.2010.02.024) [Google Scholar]
- 41.Roy D, Barber ZH, Clyne TW. 2002. Ag nanoparticle induced surface enhanced Raman spectroscopy of chemical vapor deposition diamond thin films prepared by hot filament chemical vapor deposition. J. Appl. Phys. 91, 6085–6088. (doi:10.1063/1.1469206) [Google Scholar]
- 42.Lai Y, Liu W, Li J, Zhang K, Qin F, Wang M, Fang J. 2016. High performance sodium storage of Fe-doped mesoporous anatase TiO2/amorphous carbon composite. J. Alloy. Compd 666, 254–261. (doi:10.1016/j.jallcom.2016.01.101) [Google Scholar]
- 43.Han C, et al. 2015. Hollow titanium dioxide spheres as anode material for lithium ion battery with largely improved rate stability and cycle performance by suppressing the formation of solid electrolyte interface layer. J. Mater. Chem. A 3, 13 340–13 349. (doi:10.1039/C5TA02070K) [Google Scholar]
- 44.Fehse M, et al. 2013. Nb-doped TiO2 nanofibers for lithium ion batteries. J. Phys. Chem. C 117, 13 827–13 835. (doi:10.1021/jp402498p) [Google Scholar]
- 45.Gnedenkov SV, Sinebryukhov SL, Zheleznov VV, Opra DP, Voit EI, Modin EB, Sokolov AA, Ustinov AYu, Sergienko VI. 2017. Data from: Effect of Hf-doping on Electrochemical performance of anatase TiO2 as an anode material for lithium storage Dryad Digital Repository. (http://dx.doi.org/10.5061/dryad.gf63r) [DOI] [PMC free article] [PubMed]
Associated Data
This section collects any data citations, data availability statements, or supplementary materials included in this article.
Data Citations
- Gnedenkov SV, Sinebryukhov SL, Zheleznov VV, Opra DP, Voit EI, Modin EB, Sokolov AA, Ustinov AYu, Sergienko VI. 2017. Data from: Effect of Hf-doping on Electrochemical performance of anatase TiO2 as an anode material for lithium storage Dryad Digital Repository. (http://dx.doi.org/10.5061/dryad.gf63r) [DOI] [PMC free article] [PubMed]
Supplementary Materials
Data Availability Statement
Our data have been deposited in the Dryad Digital Repository: (http://dx.doi.org/10.5061/dryad.gf63r) [45].


