Abstract
Acetylcarnitine has been identified as one of several urinary biomarkers indicative of radiation exposure in adult rhesus macaque monkeys (non-human primates, NHPs). Previous work has demonstrated an up-regulated dose-response profile in a balanced male/female NHP cohort1. As a contribution toward the development of metabolomics-based radiation biodosimetry in human populations and other applications of acetylcarnitine screening, we have developed a quantitative, high-throughput method for the analysis of acetylcarnitine. We employed the Sciex SelexIon DMS-MS/MS QTRAP 5500 platform coupled to flow injection analysis (FIA), thereby allowing for fast analysis times of less than 0.5 minutes per injection with no chromatographic separation. Ethyl acetate is used as a DMS modifier to reduce matrix chemical background. We have measured NHP urinary acetylcarnitine from the male cohorts that were exposed to the following radiation levels: control, 2 Gy, 4 Gy, 6 Gy, 7 Gy and 10 Gy. Biological variability, along with calibration accuracy of the FIA-DMS-MS/MS method, indicate LOQ of 20 μM, with observed biological levels on the order of 600 μM and control levels near 10 μM. There is an apparent onset of intensified response in the transition from 6 Gy to 10 Gy. The results demonstrate that FIA-DMS-MS/MS is a rapid, quantitative technique that can be utilized for the analysis of urinary biomarker levels for radiation biodosimetry.
INTRODUCTION
Acetylcarnitine (CAS 14992-62-2, acetyl-L-carnitine) has been identified as one of several urinary biomarkers indicative of radiation exposure in adult rhesus macaque monkeys (non-human primates, NHPs). Previous work has demonstrated an up-regulated dose-response profile in a balanced male/female NHP cohort 1. Unfortunately, data on the human acetylcarnitine response to radiation are quite limited, with the exception of a recent publication that found acetylcarnitine to be down-regulated at 6 hours after a 1.25 Gy exposure 2. However, this human study did not cover the radiation exposure range that was covered in the NHP study that we report here. In addition, the human study did not include a 7-day post-exposure delay. Therefore, NHP results should be used to approximate the human metabolic response to radiation exposure.
In addition to their involvement in radiation exposure, acylcarnitines are markers of oxidation and are quantitatively assessed for the diagnosis of metabolic disorders. Type 2 Diabetes Mellitus (T2DM) is a metabolic disease that is typically characterized by elevated blood glucose and increased insulin resistance, and can often lead to the accumulation of various lipid species 3. Since the role of fatty acid and glucose oxidation in the pathogenesis of T2DM is unclear, specific markers of oxidation, such as acylcarnitines, are often quantitatively assessed. In addition, acylcarnitine profiling is routinely performed during newborn screening in order to diagnose particular metabolic disorders 4. In this context, accurate and precise measurements of acylcarnitines are critical in understanding the progression of several disease states, including more than 20 fatty acid disorders 5.
Historically, acylcarnitines have been measured by gas chromatography-mass spectrometry (GC-MS) 6, or liquid chromatography –tandem mass spectrometry (LC-MS/MS) 7–9. However, GC-MS requires chemical modification steps, and both GC-MS and LC-MS/MS typically require significant amounts of time for chromatography. Consequently, a simpler analytical technique is desirable for high-throughput acylcarnitine analysis.
The need for examination of small molecule metabolites from non-invasively obtained biological samples has become particularly important as a result of the identification of diagnostic biomarkers for radiation exposure 1,10–22. These studies have emphasized the importance of rapid methods for screening large populations of patients who might require medical treatment due to radiation injury from industrial accidents or terrorist attacks 23,24. In line with these considerations, we have explored a non-chromatographic approach: the use of differential mobility spectrometry (DMS) in combination with mass spectrometry (MS), as a high throughput method for the analysis of acetylcarnitine in urine. The analysis of this biomarker in NHPs exposed to radiation was set as a specific goal of the study.
Ion mobility analyzers used with mass spectrometry are of two general types: low field ion mobility systems in which the applied field is of low or moderate intensity so that the ion cross-section is the most important characteristic, as described in the monograph by Eiceman, Hill and Karpas 24, and differential mobility spectrometry (DMS) systems which detect the change in ion mobility with field strength, often in the presence of a vapor modifier, so that polar character and gas phase interactions are important 25–29. DMS separates ions prior to mass analysis at atmospheric pressure based on the ion’s differential mobility through an asymmetrical electric field with essentially no additional delay due to the continuous nature of the filtration 30. DMS has been found to be especially useful in reducing chemical noise and analysis time in small molecule detection and quantitation.
While DMS can be coupled to chromatographic separation methods 31, certain applications can be performed without chromatography in a standalone DMS-MS mode, thereby leading to quick analysis times. DMS requires the application of an alternating radio frequency (RF) voltage, also known as separation voltage (SV), between two planar parallel electrodes where ions are passed continuously 32. In the asymmetric waveform, ions experience a short period of high field followed by a longer period of low field causing a net ion displacement. In addition to the SV, a direct current (DC) voltage, also known as the compensation voltage (COV), is applied, which allows for the transmission of selected ions through the electric field without electrode neutralization. Prior works have reported on considerable improvements in DMS separation power through the addition of chemical modifiers to the transport gas, a process which is commonly known as the dynamic cluster/decluster model 33–37. This process involves the clustering of analyte ions with modifier molecules during the lower field portion of the waveform, and declustering during the higher field portion of the waveform. The effects of transport gas modifiers have been extensively documented by Schneider et al., with particular attention given to the separation selectively introduced by the judicious selection of modifiers and improvements in peak capacity 27.
Given the high throughput capabilities of FIA-DMS-MS/MS and the potential benefits associated with radiation biodosimetry, we chose to investigate its utility in the analysis of acetylcarnitine in the urine of NHPs exposed to total body irradiation (TBI). Toward that goal, we developed an analytical platform around the SelexIon triple quadrupole MS which incorporates a DMS filter on the front end of the MS inlet. Here we report a high- throughput, quantitative FIA-DMS-MS/MS method that demonstrates significant value in the separation, identification and quantitation of NHP urinary acetylcarnitine. This methodology could be applied toward human patient screening following a radiological or nuclear event, or toward preclinical pharmacodynamic assay screening of compounds during the drug discovery process.
EXPERIMENTAL SECTION
Chemicals
Glacial acetic acid and HPLC grade water were obtained from Fisher Scientific (Agawam, MA, USA). Optima LC-MS grade methanol, acetonitrile, ethyl acetate, acetone, isopropanol and formic acid were also obtained from Fisher Scientific. Acetyl-DL-carnitine hydrochloride and acetyl-L-carnitine (N-methyl-d3) hydrochloride were obtained from Sigma Aldrich (St. Louis, MO, USA).
Animals
Various animal models were used during the development of these methods, including Sprague-Dawley (SD) rats and NHPs [Rhesus macaque (Macaca mulatta)]. All animal work conformed to the Public Health Service (PHS) Policy on Humane Care and Use of Laboratory Animals, incorporated in the Institute for Laboratory Animal Research (ILAR) Guide for Care and Use of Laboratory Animals, and experimental protocols were reviewed and approved by the Institutional Animal Care and Use Committee (IACUC).
NHP Study and Urine Collection
A dose response study was performed in male rhesus monkeys1. In brief, 3 control NHPs were compared to NHP cohorts exposed to the following escalating doses of radiation: 2 Gy exposed (n=3); 4 Gy exposed (n=3); 6 Gy exposed (n=3); 7 Gy exposed (n=3); 10 Gy exposed (n=3). Urine was collected from each NHP on day 7 post irradiation and shipped to our laboratory for acetylcarnitine analysis.
NHP Urinary Acetylcarnitine Sample Preparation
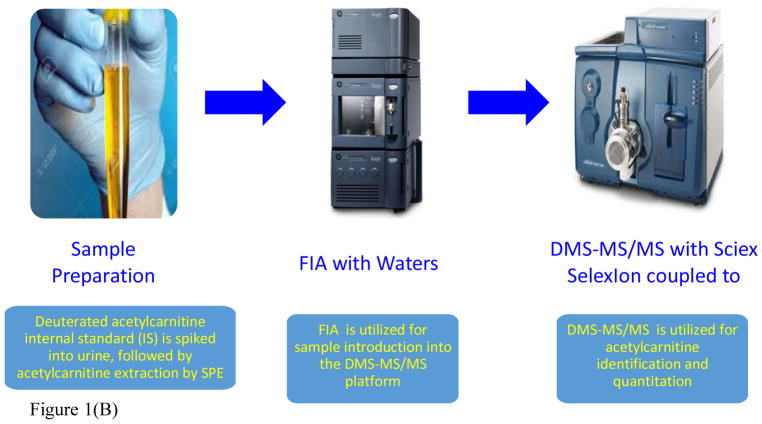
Firstly, 5.26 μL of 120 μM deuterated acetylcarnitine internal standard solubilized in water (100%) was spiked into 100 μL of NHP urine (final concentration of IS = 6 μM), dried down under nitrogen (N2) at 60°C, resuspended in 105 μL of methanol, vortexed and centrifuged at 14,000 rpm for 5 minutes at room temperature. Acetylcarnitine was then extracted by solid-phase extraction using SEP-PAK VAC 6cc silica gel cartridges (Waters, Milford, MA, USA). Acetylcarnitine was eluted with 1.5 mL methanol:water:acetic acid (50:45:5, v/v/v)38. The extract was then dried down under N2, resuspended in 526.3 μL of methanol:water:formic acid (70:30:0.1, v/v/v), vortexed, centrifuged at 14,000 rpm for 5 minutes and transferred to LC-MS vials (Agilent, Palo Alto, CA, USA). Flow injection analysis (FIA) enabled sample introduction into the mass spectrometer for DMS-MS/MS analysis (Figure 1).
Figure 1.
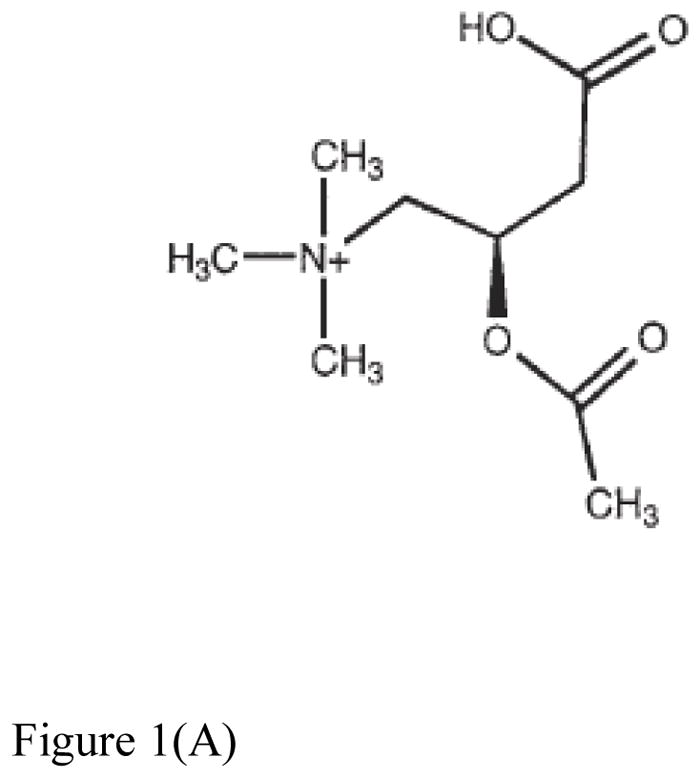
Figure 1(A). Structure of acetylcarnitine37.
Figure 1(B). Assay workflow for the analysis of NHP urinary acetyl-L-carnitine by FIA-DMS-MS/MS. DMS-MS/MS allowed for the reduction of chemical background, along with a reduced run time of less than 0.5minutes.
NHP Urinary Creatinine Sample Preparation
The following extraction solvent was prepared for urinary creatinine extraction: acetonitrile:water:formic acid (50:50:0.1, v/v/v). Specifically, 995 μL of the creatinine extraction solvent was added to 5 μL of urine. 16 μL of this solution was then further diluted with 84 μL of the creatinine extraction solvent. 100 μL of deuterated creatinine was then spiked into the solution, thereby achieving a final 2500-fold dilution in total. This level of dilution is documented to be more than sufficient to eliminate all matrix effects, whether suppression or enhancement, for both calibration and analysis, and has left the final concentration in a convenient range40–42. The solution was centrifuged at 10,000 rcf (g) for 5 minutes before analysis to remove particulates.
Flow Injection Analysis (FIA)
An Acquity UPLC and Sample Manager (Waters, Milford, MA, USA) were utilized. The Acquity UPLC was operated via the Acquity console driver within Analyst software version 1.6.2 (Sciex, Framingham, MA, USA). The FIA mobile phase was methanol:water:formic acid (70:30:0.1, v/v/v). The FIA flow rate was 0.050 mL/min. The weak wash consisted of water:acetonitrile (50:50, v/v). The strong wash was water. The injection volume was 10 μL.
Differential Mobility Spectrometry
The DMS instrument utilized was a SelexIon (Sciex, Framingham, MA, USA). The DMS conditions were as follows: DMS temperature (DT), low (150°C); modifier (MOD), ethyl acetate; modifier composition (MDC), low (1.5% v/v); DMS offset (DMO), −3.0 V; DMS resolution enhancement (DR), off. Optimal signal for acetylcarnitine was determined by varying the separation voltage (SV) and the compensation voltage (COV). With this system, we found that COV values for acetylcarnitine should be optimized daily. As a result, the COV values used for our analyses ranged from −46V to −37V. This change did not make any significant change to intensities. DMS data were acquired with Analyst 1.6.2.
Mass Spectrometry
MS data and MS/MS data were acquired on a QTRAP 5500 mass spectrometer (Sciex, Framingham, MA, USA). The mass spectrometer was tuned with 2 μM solution of acetylcarnitine. Acetylcarnitine was analyzed using positive ion electrospray ionization (ESI+) in the multiple reaction monitoring (MRM) mode. The source conditions were as follows: collision gas (CAD), medium; curtain gas (CUR), 20 PSI; ion source gas 1 (GS1), 60 PSI; ion source gas 2 (GS2), 60 PSI; ion spray voltage (IS), 4500 V; temperature (TEM), 600°C. Acetylcarnitine was infused into the ion source at a rate of 0.020 mL/min for tuning. Optimal signal for the precursor ion in Q1 was determined by varying the declustering potential (DP) and the entrance potential (EP). After the Q1 settings were determined, optimal product ion spectra were generated by manipulating DP, EP, collision energy (CE) and collision cell exit potential (CXP). Acetylcarnitine (2:0 AC) and deuterated acetylcarnitine (2:0-d3-AC) were analyzed in the multiple reaction monitoring mode with the following mass transitions: 2:0 AC, 204.2>85.1; 2:0-d3-AC, 207.2>85.1. The m/z 85 product ion (+CH2-CH=CH-CO-OH) is common in MS/MS spectra of acylcarnitines 43. It is important to note that the tuning flow rate was not able to reach the minimum UPLC pressure required for a given FIA experiment. Consequently, the FIA flow rate was increased to 0.050 mL/min. Due to the change in flow rate, additional optimization was performed during the injection of neat standards into the FIA-DMS-MS/MS platform. Protonated creatinine and deuterated creatinine were monitored in MS scan mode: creatinine, 114.1, and deuterated creatinine, 117.1. All MS and MS/MS data were acquired with Analyst 1.6.2. All FIA peak integration was done with MultiQuant software version 2.1 (Sciex, Framingham, MA, USA). All data reduction was performed with Microsoft Excel.
RESULTS AND DISCUSSION
Optimization of DMS-MS and DMS-MRM Conditions
The aims of this research project included the following: (i) the development of a high-throughput analytical method capable of determining the absolute quantification of urinary acetylcarnitine; (ii) the evaluation of DMS for the enhancement of signal-to-noise; (iii) the investigation of various matrices for the generation of calibration curve data; (iv) the consideration of current urine normalization practices. Critical in this regard was the optimization and the validation of the DMS parameters, particularly in terms of the selection of the appropriate modifier(s) (MOD) that would provide a COV shift for the analyte in a domain of best sensitivity and minimal matrix interference. Campbell et al, 44 investigated nitrogen as a MOD and had observed minimal DMS separation effectiveness due to its weaker propensity for ion-molecule clustering. Based on essentially similar experiences, we proceeded to evaluate three small molecules (isopropanol, ethyl acetate, and acetone), which had been previously used as modifiers in related studies in our laboratory 45–48. In addition, because of the limited quantities of control (non-irradiated) NHP urine, rat urine was used to test the effectiveness of the MODs and establish the optimal DMS-MS conditions for the analysis as described next.
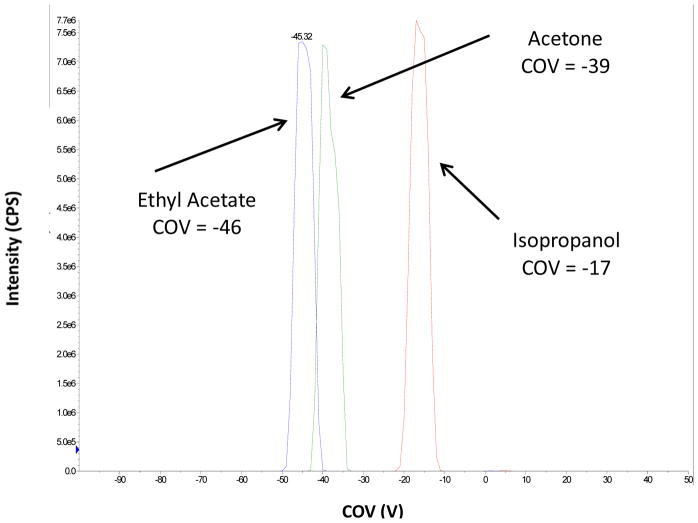
An acetylcarnitine standard was diluted in methanol:water:formic acid (70:30:0.1, v/v/v) to a concentration of 20 μM and infused. The COV shift at SV 3500 V of each modifier was examined. In agreement with the results reported by Campbell, et al. 44, the COV shifts for IPA and acetone followed the same trends 44. In all three cases, a strong modifier effect was observed, with the most significant COV shift (−46V) arising from the use of ethyl acetate compared to −39 V and −17 for acetone and isopropanol respectively, as shown in Figure 2. It should be noted that the separation of chemical interferences is an important function of modifier addition. In addition, COV shifts can be affected by matrix or other effects such as temperature fluctuations, and may need to be re-determined periodically. Ultimately, ethyl acetate provided the lowest limit of quantitation and the best linear dynamic range. Consequently, we proceeded to move forward with ethyl acetate as the MOD.
Figure 2.
Various DMS modifiers were investigated, including isopropanol, ethyl acetate and acetone. The optimal DMS MOD COV values for 20 μM acetylcarnitine solubilized in methanol:water:formic acid (70:30:0.1, v/v/v) are highlighted.
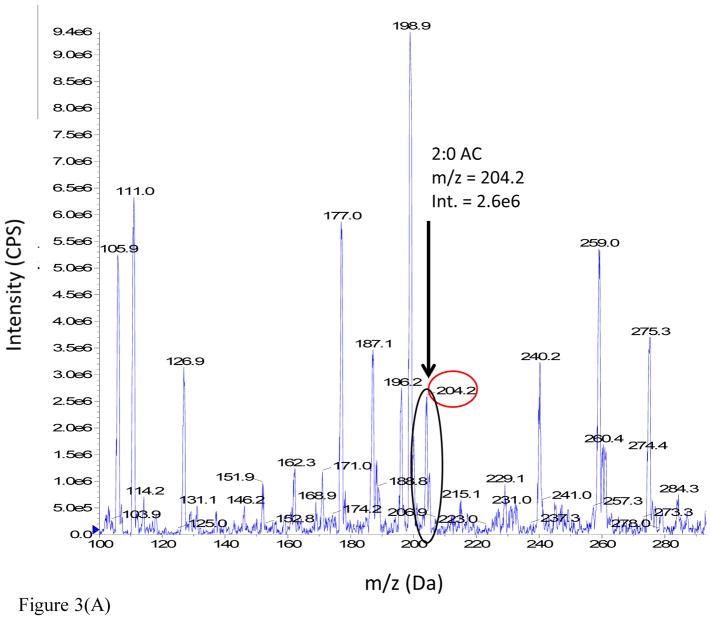
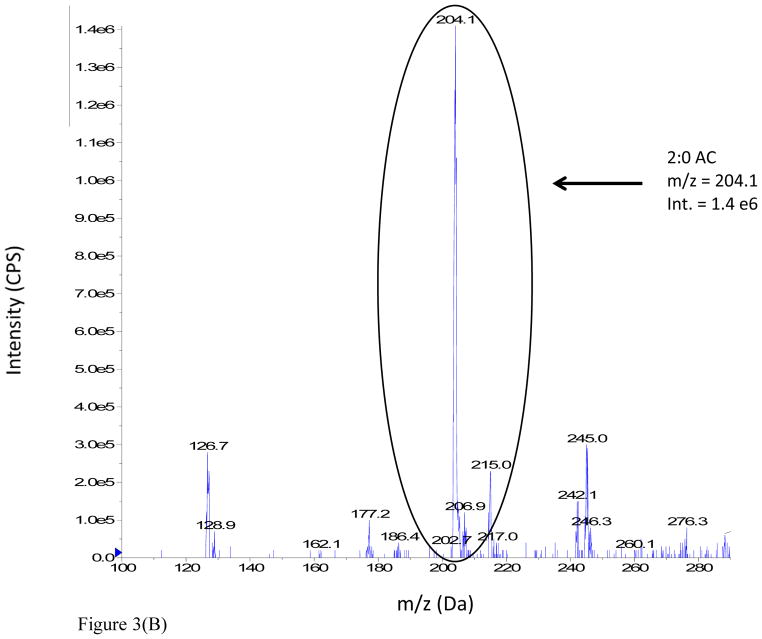
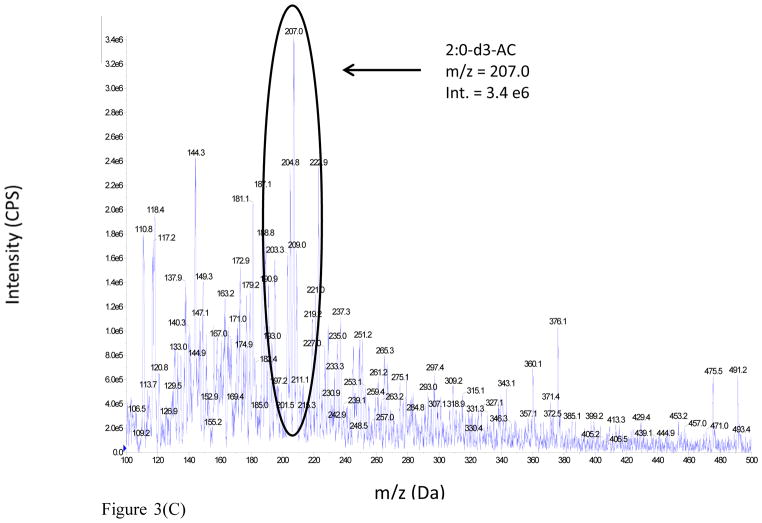
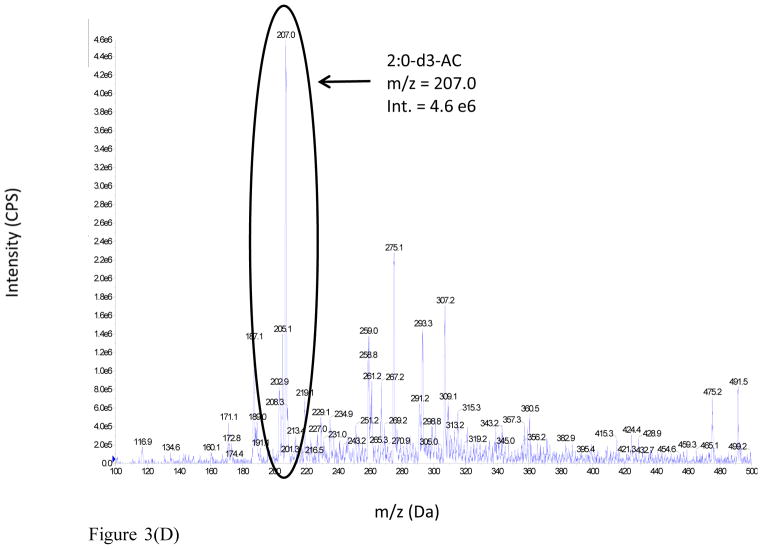
The advantages realized under the latter conditions are illustrated from the DMS-MS analysis of a 100 μM acetylcarnitine standard spiked into rat urine. The full scan mass spectra of the sample were analyzed under two different conditions: (i) MS Scan, DMS off and (ii) MS Scan, DMS on, with COV optimized at −37 V, as shown in Figure 3 (Panels A and B respectively). The mass spectrum of the rat urine extract in MS Scan, DMS off displays a large number of ions, but the signal intensity of urinary acetylcarnitine appears to be considerably suppressed. However, the mass spectrum of the rat urine extract obtained with MS Scan, DMS on illustrates a reduction in chemical background which results in signal-to-noise improvement by a factor of 3 fold due to DMS.
Figure 3.
Figure 3(A). Full scan mass spectrum of 100 μM acetylcarnitine spiked into male SD rat urine: MS Scan, DMS Off, with no DMS field applied.
Figure 3(B). Full scan mass spectrum of 100 μM acetylcarnitine spiked into male SD rat urine: MS Scan, DMS On.
Figure 3(C). Full scan mass spectrum of 100 μM deuterated acetylcarnitine IS spiked into male SD rat urine: MS Scan, DMS Off, with no DMS field applied.
Figure 3(D). Full scan mass spectrum of 100 μM deuterated acetylcarnitine IS spiked into male SD rat urine: MS Scan, DMS On.
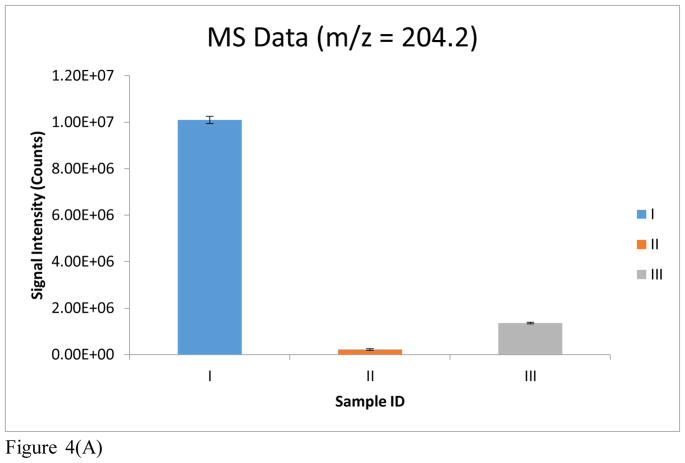
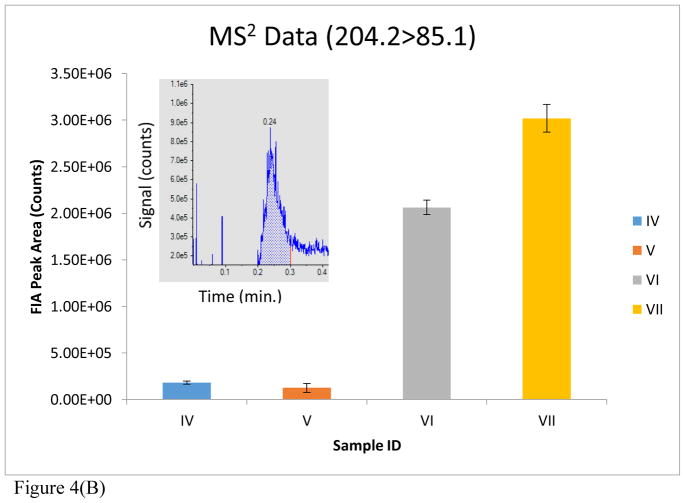
A quantitative evaluation of the improvement realized by the use of DMS is further shown in Figure 4. Bar I depicts the signal of m/z 204 for a blank rat urine extract with MS Scan, DMS off. A dramatic reduction in matrix contribution to the signal at m/z 204 is observed (bar II) with MS Scan, DMS on. The addition of 100 μM acetylcarnitine to the urine matrix and analysis with MS Scan, DMS on, produced the signal shown in bar III. Bar IV represents the signal of acetylcarnitine for a blank rat urine extract operated in MS2, DMS off mode. A slight reduction in matrix contribution with MS2, DMS on, is observed in bar V. The addition of 100 μM acetylcarnitine to the urine matrix led to an increase in signal with MS2, DMS off. However, a greater increase in signal occurred with MS2, DMS on, as can be seen in bar VII. The data acquisition for each sample/condition (i.e. Bars I–VII) were run in triplicate and the average signal intensities are plotted in Figure 4.
Figure 4.
Figure 4(A). MS data reported for the following samples: (I) Blank rat urine extract, MS scan (m/z = 204.2), DMS off; (II) Blank rat urine extract, MS scan (m/z = 204.2), DMS on; (III) Rat urine extract with 100 μM acetylcarnitine spiked in, MS scan (m/z = 204.2), DMS on.
Figure 4(B). MS2 data reported for the following samples: (IV) Blank rat urine extract, MS2 (204.2>85.1), DMS off; (V) Blank rat urine extract, MS2 (204.2>85.1), DMS on; (VI) Rat urine extract with 100 μM acetylcarnitine spiked in, MS2 (204.2>85.1), DMS off; (VII) Rat urine extract with 100 μM acetylcarnitine spiked in, MS2 (204.2>85.1), DMS on. MS data and MS2 data demonstrate a reduction of chemical background in SD rat urine through the utilization of DMS. MS2 data demonstrates a clear enhancement of acetylcarnitine signal intensity through the utilization of DMS. The error bars represent the standard error of the mean (SEM) for each technical replicate. An FIA distribution (signal vs. time) of the MS2 experiment (204.2>85.1) is also shown in (B) for sample (VII).
The blank rat urine background observed in the MS scan, DMS off mode, is at least one order of magnitude greater than in the MS scan, DMS on mode. Furthermore, the additional chemical background in MS scan, DMS off mode, would exceed the signal of the 100 μM acetylcarnitine standard spiked into rat urine, as shown in bar graphs I–III. In addition, the MRM DMS-on mode demonstrates a reduction in chemical background for the blank rat urine extract, leading to a signal/noise enhancement of a factor of 3 for acetylcarnitine in rat urine. When the DMS ion filter is tuned to acetylcarnitine, that ion passes through the filter while other species are neutralized. This near-exclusive selection of the acetyl carnitine for transfer into the MS and removal of unrelated background ions provides the additional benefit of maintaining a clean MS interface over the long term of instrument use, as shown in Figure 7 of Schneider et al. 32.
Construction of Calibration Curve and Evaluation of Assay Quantitation
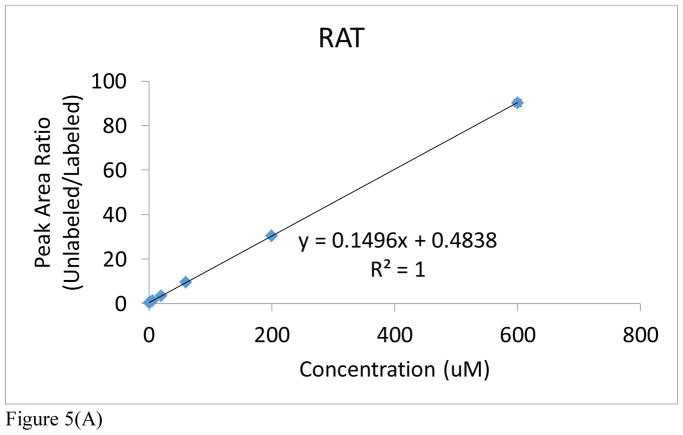
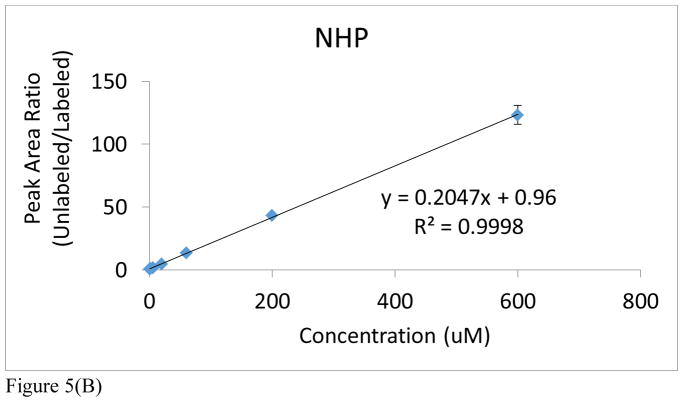
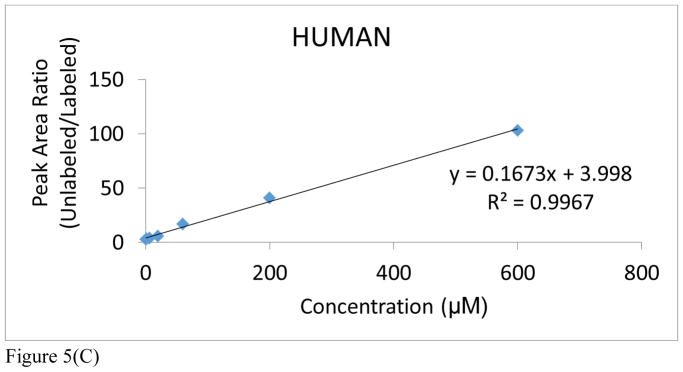
It is an accepted procedure that the matrix used for construction of a calibration curve should match the one in which the analyte is present. However, as stated earlier, all of the preliminary optimization studies had to be conducted with rat urine because of the lack of adequate control NHP urine from the in vivo radiation studies (Figure 5A and Supplemental Table S1A). An attempt to use human urine proved unsatisfactory because of the high endogenous levels of acetylcarnitine in human urine (Figure 5C and Supplemental Table S1C). At a later date, we were able to obtain a small aliquot of male control NHP urine that was sufficient to also construct a new calibration curve, covering a dynamic range from 0.6μM to 600μM in both cases (Figure 5B and Supplemental Table S1B). As a result, only rat and NHP urine were used for calibration purposes. Notable in both rat and NHP is the excellent linearity over a dynamic range of three orders of magnitude (R2>0.999). In addition, it’s important to note the excellent reproducibility of this methodology in view of the observed standard deviation and coefficient of variation for each technical replicate of each individual NHP from each cohort (See Supplemental Table S3). The NHP calibration curve has a steeper slope and higher y-intercept than that of the rat urine. It may be inferred from this that rats have lower levels of endogenous acetylcarnitine in their urine. However, given their close similarities, either calibration was considered in the subsequent quantitation of the radiation effects in NHPs.
Figure 5.
Figure 5(A). Acetylcarnitine calibration curve spiked into rat urine.
Figure 5(B). Acetylcarnitine calibration curve spiked into NHP urine.
Figure 5(C). Acetylcarnitine calibration curve spiked into human urine. Peak area ratios (analyte/IS) are reported for each calibration curve point, with the IS concentration = 6 μM. The average of each calibration curve replicate, along with the standard error of the mean (SEM), have been calculated (see Supplemental Information). The slope and intercept values, along with their uncertainties, are also reported (uncertainties found in parentheses). Calibration curves from all species were linear across 3 orders of magnitude (0.6–600 μM).
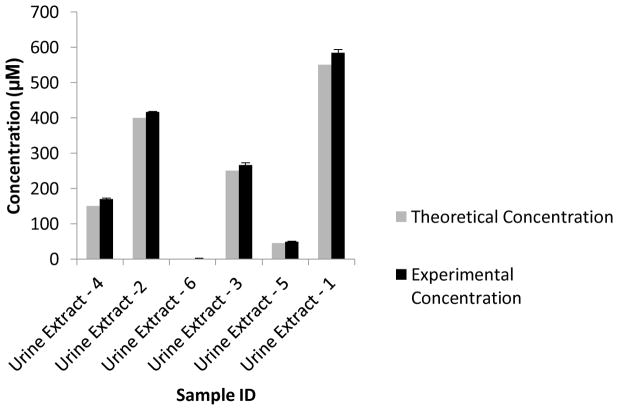
Given the similarity of the two calibration curves, the feasibility for quantitative analysis was confirmed in a “blind” study against a calibration curve spiked into the rat urine matrix. Urine samples were spiked with known amounts of acetylcarnitine by one analyst and analyzed in a blind manner by a different analyst. The experimentally determined concentrations of acetylcarnitine were comparable to the theoretical concentrations, thereby demonstrating the utility of the FIA-DMS-MS/MS method for the accurate quantitation of urinary acetylcarnitine (Figure 6).
Figure 6.
Blind DMS-MS/MS urine analysis of male SD rat urine spiked with varying concentrations of acetylcarnitine. Experimental concentrations of urinary acetylcarnitine are compared to their known theoretical concentrations. The experimental concentration error bars represent the standard error of the mean (SEM) for each technical replicate.
NHP Urinary Acetylcarnitine Analysis
Once the precision of the FIA-DMS-MS/MS method had been confirmed, we proceeded to apply this methodology toward the analysis of NHP urine samples collected from a dose response study that was aimed at investigating the effects of radiation exposure1. In brief, male control (0 Gy exposed) NHPs (n=3) were compared to male NHP cohorts exposed to the following doses of radiation: 2 Gy exposed (n=3); 4 Gy exposed (n=3); 6 Gy exposed (n=3); 7 Gy exposed (n=3); 10 Gy exposed (n=3). Urine was collected from each NHP on day 7 post irradiation and shipped to our laboratory for acetylcarnitine analysis.
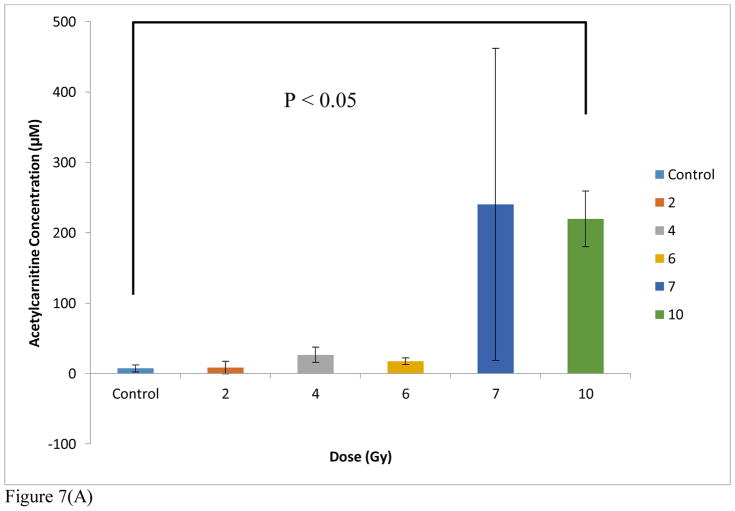
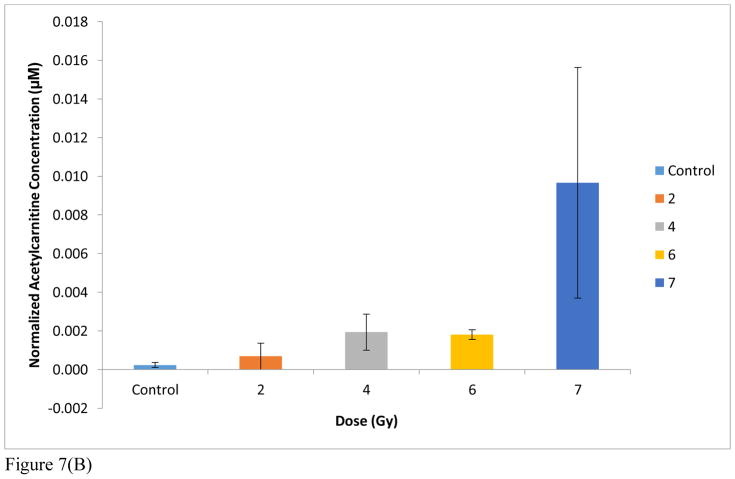
The arithmetic means from triplicate analyses of each subject were then averaged in order to account for biological variations and used to derive the urinary acetylcarnitine concentrations at each exposure level. It is important to note that the SEM’s observed in these data can be attributed to biological variation given the excellent technical reproducibility discussed earlier regarding the generation of the calibration curves (Figure 5B and Supplemental Table S1B). When the NHP urine data were quantified to the NHP urine calibration curve, the acetylcarnitine concentration values for each cohort were distinctly lower than those that were generated from the rat urine calibration curve. Thus, despite almost identical trends, absolute concentration levels calculated using the rat calibration curve were lower than the LOQ at the low exposure levels but differed less than 20% at the high levels (7 Gy). These results are summarized in Table 1 and emphasize the need for a judicious selection of a calibration matrix as it is preferred to match the species under examination. It is important to note that the only difference in structure between acetylcarnitine and our internal standard was 3 deuteriums. As a result, ions of both acetylcarnitine and the IS are subject to the same chemical noise. In other words, no isotope effect can occur. The NHP data are also visualized in Microsoft Excel in the bar graphs found in Figure 7A and 7B. A very moderate change is observed at the exposure levels ranging from 2–6 Gy compared to control, but a threshold of tolerance is reached effectively at 7 Gy. One subject exhibited an unusually higher response to exposure at 7 Gy, which we attribute to biological variability. However, it is important to note the excellent reproducibility achieved from each technical replicate. Before normalization to creatinine, the difference between the control cohort and the 10 Gy exposed cohort was found to be statistically significant by Welch’s t test (Figure 7A). When quantified to a calibration curve spiked into human urine, the NHP urinary acetylcarnitine concentrations were found to be negative for both the control and 2 Gy exposed cohorts (Table 1). The negative values can most likely be attributed to the high levels of endogenous acetylcarnitine found in human urine.
Table 1.
FIA-DMS-MS/MS analysis of urinary acetylcarnitine from healthy male NHPs exposed to levels of radiation from 0 Gy (control) to 10 Gy. NHP urinary acetylcarnitine quantification was performed using calibration curves spiked into urine from three different species. Concentrations are reported in μM units. The above table demonstrates species-dependent differences in quantification and confirms that NHP urinary acetylcarnitine concentrations should be determined from a calibration curve using urine from the same species.
| Control (n=3) | 2 Gy (n=3) | 4 Gy (n=3) | 6 Gy (n=3) | 7 Gy (n=3) | 10 Gy (n=3) | |
|---|---|---|---|---|---|---|
| NHP | 7 μM | 9 μM | 27 μM | 17 μM | 240 μM | 220 μM |
| SEM | 5 | 9 | 11 | 5 | 222 | 40 |
| Rat | 13 μM | 15 μM | 40 μM | 27 μM | 332 μM | 310 μM |
| SEM | 7 | 12 | 15 | 6 | 248 | 47 |
| Human | −9 μM | −7 μM | 14 μM | 3 μM | 276 μM | 256 μM |
| SEM | 6 | 11 | 13 | 6 | 221 | 42 |
Figure 7.
Figure 7(A). DMS-MS/MS analysis of urinary acetylcarnitine from healthy male NHPs exposed to levels of radiation from 0 Gy (control) to 10 Gy quantified using a NHP-urine acetylcarnitine calibration curve, with the IS concentration = 6 μM. Creatinine normalization was not done. Significance was determined using Welch’s t-test.
Figure 7(B). NHP urinary acetylcarnitine normalized to corresponding creatinine data. No creatinine data was available for the 10 Gy exposed cohort. The error bars represent the standard error of the mean (SEM) of three biological replicates
Since the concentrations of urinary excreted compounds are often reported after normalization to creatinine 49, it was of interest to also compare the trends in marker concentrations to those of creatinine. Creatinine concentrations were calculated based on a calibration curve (See Supplemental Figure S1, Supplemental Table S2) for each NHP cohort: 0 Gy (25.1 mM), 2 Gy (13.9 mM), 4 Gy (17.6 mM), 6 Gy (9.3 mM), 7 Gy (11.3 mM). The data in Figure 7A were thus also normalized to creatinine in the exposure range from 0 Gy to 7Gy (no creatinine data was available for the 10 Gy exposed cohort) and are presented in Figure 7B. As shown in Figure 7B, after normalization to creatinine, the trend remains the same except that an earlier threshold appears to be reached at 2Gy. However, these data do not allow for identification of the exact role of creatinine. Creatinine is certainly affected by radiation exposure, and thus, can be viewed as a potential marker. In addition, creatinine is involved in kidney function, fluid intake and kidney damage. As a result, the use of creatinine for normalization has become a controversial topic. Consequently, we have presented the data both normalized and unnormalized to creatinine.
It still remains unclear what particular mechanism leads to increased urinary acetylcarnitine or what the tissue of origin is. In contrast to NHP samples, human TBI urinary samples showed decreased excretion levels in the urine 2, although different time points and dose effects most likely contributed to those differences. In the past, several plasma acylcarnitine species have been identified as biomarkers for various fatty acid oxidation disorders 50, and long chain acylcarnitines (LCACs) have been shown to modulate inflammation. In addition, the accumulation of LCACs is presumed to modify the activities of various enzymes, transporters and receptors within the cell, which can potentially lead to cell death. However, the mechanisms by which these cellular functions are modulated are still unknown. Nevertheless, it is certainly possible that medium chain acylcarnitines (MCACs) and short chain acylcarnitines (SCACs), such as acetylcarnitine, also play an important role within the cell.
The tricarboxylic acid (TCA) cycle is an essential part of cellular metabolism that is used to generate energy. Ionizing radiation is known to increase oxidative stress which affects the mitochondria, and ultimately, the TCA cycle51–53. Previous work by Barjaktarovic, et al, revealed decreased respiratory capacity in the heart mitochondria of C57BL/6N mice that were exposed to local irradiation54. Coenzyme A (CoA) is directly involved in the TCA cycle in mitochondria 55. CoA is formed during the de-acetylation of acetyl-CoA and the subsequent formation of acetylcarnitine. When fuel delivery is greater than energy generation, acyl-CoA intermediates accumulate upstream of the TCA cycle and are eventually converted to acetate, ketone bodies and acetylcarnitine. Previous work by Lanz, et al, demonstrated a downregulation of TCA cycle intermediates in Wistar rats exposed to 3 Gy gamma radiation56. In addition, Liu, et al, reported on a comparable downregulation of TCA cycle intermediates in the serum of rats exposed to escalating doses of Gy gamma radiation57. Upon taking these data into consideration, we conjecture that radiation exposure may adversely affect the TCA cycle by increasing fuel delivery and reducing energy generation, thereby leading to an overabundance of acetylcarnitine that is ultimately excreted through the urine. This could potentially explain the increasing levels of urinary acetylcarnitine that were observed with increasing doses of radiation exposure. Alternatively, the greater excretion of acetylcarnitine in the urine could be attributed to the increased damage and levels of apoptosis that occur during radiation exposure.
CONCLUSIONS
Here we present a FIA-DMS-MS/MS method for the analysis of urinary acetylcarnitine. The FIA-DMS-MS/MS method is linear across 4 orders of magnitude and it has an extremely rapid run time of 0.5 minutes, as opposed to established LC-MS/MS methods with much longer run times. The FIA-DMS-MS/MS method was applied toward the analysis of NHP urine samples collected from a dose response study that was aimed at investigating the consequence of radiation exposure. The male NHP 10 Gy exposed cohort exhibited over a 20-fold elevation in urinary acetylcarnitine compared to the male NHP control cohort. With regard to quantitation, we demonstrated that not all matrices can be utilized in the generation of calibration curves. The optimal matrix to be used for calibration curve generation and quantitation should always be the same matrix found in the unknown biological sample. In this case, NHP urine was the optimal matrix. Thus, FIA-DMS-MS/MS is capable of detecting elevated NHP urinary acetylcarnitine and providing insight into the effect of radiation exposure.
LC-MS/MS and GC-MS coupled to tandem mass spectrometry are currently the accepted methods for acylcarnitine profiling in a variety of applications including newborn screening4,6–7. However, the incorporation of DMS on the front end of a mass spectrometer provides an additional level of selectivity, leading to a high-throughput technique for the quantitation of acetylcarnitine. It is important to note that the reported sample preparation method is somewhat laborious and time-consuming; however, the SPE step can certainly be automated through the use of liquid handling devices. Thus, the rate determining step for the overall procedure is the FIA-DMS-MS/MS analysis, which is much shorter than an LC-MS run. In conclusion, FIA-DMS-MS/MS could certainly be applied toward acylcarnitine profiling in future human studies and, given its high throughput capability, should be well suited for screening large numbers of samples, especially for the identification and quantitation of diagnostic biomarkers.
Supplementary Material
Table S1(A). Acetylcarnitine calibration curve spiked into rat urine. Peak area ratio (Analyte/IS) for triplicate data. SEM and %CV indicate technical variation.
Table S1(B). Acetylcarnitine calibration curve spiked into NHP urine. Peak area ratio (Analyte/IS) for triplicate data. SEM and %CV indicate technical variation.
Table S1(C). Acetylcarnitine calibration curve spiked into human urine. Peak area ratio (Analyte/IS) for triplicate data. SEM and %CV indicate technical variation. The slope and intercept values, along with their uncertainties, are also reported (uncertainties found in parentheses). Calibration curves from all 3 species were linear across 3 orders of magnitude (0.6–600 μM).
Table S2. Neat creatinine calibration curve run in triplicate. The average peak area ratio (Analyte/IS) and standard deviation (SD) are reported for each concentration.
Figure S1. Neat creatitine calibration curve. 0.8 μM deuterated creatinine (IS) was added to escalating concentrations of creatinine, and then diluted with the creatinine extraction solvent: acetonitrile:water:formic acid (50:50:0.1, v/v/v).
Acknowledgments
This work was supported by grant NIH 1R01AI101798 (P.I. Albert J. Fornace, Jr.) with additional assistance from the National Institutes of Health (National Institute of Allergy and Infectious Diseases) grant U19 AI067773 (P.I. David J. Brenner), and Dr. Pannkuk was supported by the training grant in the Tumor Biology Program 5T32CA9686-20. We would also like to acknowledge Shaokun Pang from Sciex for his technical support.
Footnotes
See Supplementary Material for calibration curves, and additional data.
Author Contributions
The manuscript was written through contributions of all authors.
References
- 1.Pannkuk EL, Laiakis EC, Authier S, Wong K, Fornace AJ., Jr Global metabolomic identification of long-term dose-dependent urinary biomarkers in nonhuman primates exposed to ionizing radiation. Radiat Res. 2015;184:121–133. doi: 10.1667/rr14091.1. [DOI] [PMC free article] [PubMed] [Google Scholar]
- 2.Laiakis EC, Mak TD, Anizan S, Amundson SA, Barker CA, Wolden SL, Brenner DJ, Fornace AJ., Jr Development of a metabolomic radiation signature in urine from patients undergoing total body irradiation. Radiat Res. 2014;181:350–361. doi: 10.1667/RR13567.1. [DOI] [PMC free article] [PubMed] [Google Scholar]
- 3.Lin Y, Sun Z. Current views on type 2 diabetes. J Endocrinol. 2010;204:1–11. doi: 10.1677/JOE-09-0260. [DOI] [PMC free article] [PubMed] [Google Scholar]
- 4.Yoon HR. Screening newborns for metabolic disorders based on targeted metabolomics using tandem mass spectrometry. Ann Pediatr Endocrinol Metab. 2015;20:119–124. doi: 10.6065/apem.2015.20.3.119. [DOI] [PMC free article] [PubMed] [Google Scholar]
- 5.Hoppel C. The role of carnitine in normal and altered fatty acid metabolism. Am J Kidney Dis. 2003;41:S4–12. doi: 10.1016/s0272-6386(03)00112-4. [DOI] [PubMed] [Google Scholar]
- 6.Costa CG, Struys EA, Bootsma A, Brink HJ, Dorland L, Almeida IT, Duran M, Jakobs C. Quantitative analysis of plasma acylcarnitines using gas chromatography chemical ionization mass fragmentography. J Lipid Res. 1997;38:173–182. [PubMed] [Google Scholar]
- 7.Kidouchi K, Sugiyama N, Morishita H, Wada Y, Nagai S, Sakakibara J. Analytical method for urinary glutarylcarnitine, acetylcarnitine and propionylcarnitine with a carboxylic acid analyser and a reversed-phase column. J Chromatogr. 1987;423:297–303. doi: 10.1016/0378-4347(87)80354-7. [DOI] [PubMed] [Google Scholar]
- 8.Giesbertz P, Ecker J, Haag A, Spanier B, Daniel H. An LC-MS/MS method to quantify acylcarnitine species including isomeric and odd-numbered froms in plasma and tissues. J Lipid Res. 2015;56(10):2029–2039. doi: 10.1194/jlr.D061721. [DOI] [PMC free article] [PubMed] [Google Scholar]
- 9.Ruiz M, Labarthe F, Fortier A, Bouchard B, Legault JT, Bolduc V, Rigal O, Chen J, Ducharme A, Crawford PA, Tardif JC, Des Rosiers C. Circulating acylcarnitine profile in human heart failure: a surrogate of fatty acid metabolic dysregulation in mitochondria and beyond. Am J Physiol Heart Circ Physiol. 2017;313:H768–H781. doi: 10.1152/ajpheart.00820.2016. [DOI] [PubMed] [Google Scholar]
- 10.Coy SL, Cheema AK, Tyburski JB, Laiakis EC, Collins SP, Fornace AJ. Radiation metabolomics and its potential in biodosimetry. Int J Radiat Biol. 2011;87:802–823. doi: 10.3109/09553002.2011.556177. [DOI] [PMC free article] [PubMed] [Google Scholar]
- 11.Cheema AK, Suman S, Kaur P, Singh R, Fornace AJ, Datta K. Long-term differential changes in mouse intestinal metabolomics after γ and heavy ion radiation exposure. PLoS One. 2014:9. doi: 10.1371/journal.pone.0087079. [DOI] [PMC free article] [PubMed] [Google Scholar]
- 12.Laiakis EC, Pannkuk EL, Diaz-Rubio ME, Wang YW, Mak TD, Simbulan-Rosenthal CM, Brenner DJ, Fornace AJ., Jr Implications of genotypic differences in the generation of a urinary metabolomics signature. Mutat Res. 2016;788:41–49. doi: 10.1016/j.mrfmmm.2016.03.003. [DOI] [PMC free article] [PubMed] [Google Scholar]
- 13.Pannkuk EL, Laiakis EC, Mak TD, Astarita G, Authier S, Wong K, Fornace AJ., Jr A lipidomic and metabolomic serum signature from nonhuman primates exposed to ionizing radiation. Metabolomics. 2016;12 doi: 10.1007/s11306-016-1010-0. [DOI] [PMC free article] [PubMed] [Google Scholar]
- 14.Pannkuk EL, Laiakis EC, Authier S, Wong K, Fornace AJ., Jr Targeted metabolomics of nonhuman primate serum after exposure to ionizing radiation: potential tools for high-throughput biodosimetry. RSC Adv. 2016;6:51192–51202. doi: 10.1039/C6RA07757A. [DOI] [PMC free article] [PubMed] [Google Scholar]
- 15.Suman S, Kallakury BVS, Fornace AJ, Jr, Datta K. Protracted upregulation of leptin and IGF1 is associated with activation of PI3K/Akt and JAK2 pathway in mouse intestine after ionizing radiation exposure. Int J Biol Sci. 2015;11:274–283. doi: 10.7150/ijbs.10684. [DOI] [PMC free article] [PubMed] [Google Scholar]
- 16.Mak TD, Tyburski JB, Krausz KW, Kalinich JF, Gonzalez FJ, Fornace AJ. Exposure to ionizing radiation reveals global dose- and time-dependent changes in the urinary metabolome of rat. Metabolomics. 2015;11:1082–1094. doi: 10.1007/s11306-014-0765-4. [DOI] [PMC free article] [PubMed] [Google Scholar]
- 17.Laiakis EC, Strassburg K, Bogumil R, Lai S, Vreeken RJ, Hankemeier T, Langridge J, Plumb RS, Fornace AJ, Astarita G. Metabolic phenotyping reveals a lipid mediator response to ionizing radiation. J Proteome Res. 2014;13:4143–4154. doi: 10.1021/pr5005295. [DOI] [PMC free article] [PubMed] [Google Scholar]
- 18.Goudarzi M, Mak TD, Chen CJ, Smilenov LB, Brenner DJ, Fornace AJ. The effect of low dose rate on metabolomic response to radiation in mice. Radiat Environ Biophys. 2014;53:645–657. doi: 10.1007/s00411-014-0558-1. [DOI] [PMC free article] [PubMed] [Google Scholar]
- 19.Laiakis EC, Hyduke DR, Fornace AJ. Comparison of mouse urinary metabolic profiles after exposure to the inflammatory stressors γ radiation and lipopolysaccharide. Radiat Res. 2012;177:187–199. doi: 10.1667/rr2771.1. [DOI] [PMC free article] [PubMed] [Google Scholar]
- 20.Tyburski JB, Patterson AD, Krausz KW, Slavik J, Fornace AJ, Jr, Gonzalez FJ, Idle JR. Radiation metabolomics. 2. Dose-and time-dependent urinary excretion of deaminated purines and pyrimidines after sublethal gamma-radiation exposure in mice. Radiat Res. 2009;172:42–57. doi: 10.1667/RR1703.1. [DOI] [PMC free article] [PubMed] [Google Scholar]
- 21.Tyburski JB, Patterson AD, Krausz KW, Slavik J, Fornace AJ, Jr, Gonzalez FJ, Idle JR. Radiation metabolomics. 1. Identification of minimally invasive urine biomarkers for gamma-radiation exposure in mice. Radiat Res. 2008;170:1–14. doi: 10.1667/RR1265.1. [DOI] [PMC free article] [PubMed] [Google Scholar]
- 22.Goudarzi M, Mak TD, Jacobs JP, Moon BH, Strawn SJ, Braun J, Brenner DJ, Fornace AJ, Li HH. An integrated multi-omic approach to assess radiation injury on the host-microbiome axis. Radiat Res. 2016;186:219–234. doi: 10.1667/RR14306.1. [DOI] [PMC free article] [PubMed] [Google Scholar]
- 23.Brenner DJ, Chao NJ, Greenberger JS, Guha C, McBride WH, Swartz HM, Williams JP. Are we ready for a radiological terrorist attach yet? Report from the centers for medical countermeasures against radiation network. Int J Radiat Oncol Biol Phys. 2015;92:504–505. doi: 10.1016/j.ijrobp.2015.02.042. [DOI] [PMC free article] [PubMed] [Google Scholar]
- 24.Eiceman GA, Hill HH, Karpas Z. Ion Mobility Spectrometry, Third Edition. CRC Press; Boca Raton: 2014. pp. XV–XVI.pp. 428 [Google Scholar]
- 25.Shvartsburg AA. Differential ion mobility spectrometry: nonlinear ion transport and fundamentals of FAIMS. CRC Press; Boca Raton: 2008. p. xxix.p. 299. ill. [Google Scholar]
- 26.Schneider BB, Covey TR, Coy SL, Krylov EV, Nazarov EG. Chemical effects in the separation process of a differential mobility/mass spectrometer system. Anal Chem. 2010;82:1867–1880. doi: 10.1021/ac902571u. [DOI] [PMC free article] [PubMed] [Google Scholar]
- 27.Schneider BB, Nazarov EG, Covey TR. Peak capacity in differential mobility spectrometry: effects of transport gas and gas modifiers. Int J Ion Mobil Spec. 2012;15:141–150. [Google Scholar]
- 28.Kafle A, Coy SL, Wong BM, Fornace AJ, Jr, Glick JJ, Vouros P. Understanding gas phase modifier interactions in rapid analysis by differntial mobility-tandem mass spectrometry. J Am Soc Mass Spectrom. 2014;25:1098–1113. doi: 10.1007/s13361-013-0808-5. [DOI] [PMC free article] [PubMed] [Google Scholar]
- 29.Varesio E, Yves Le Blanc JC, Hopfgartner G. Real-time 2D separation by LC x differential ion mobility hyphenated to mass spectrometry. Anal Bioanal Chem. 2012;402:2555–2564. doi: 10.1007/s00216-011-5444-y. [DOI] [PubMed] [Google Scholar]
- 30.Coy SL, Krylov EV, Schneider BB, Covey TR, Brenner DJ, Tyburski JB, Patterson AD, Krausz KW, Fornace AJ, Jr, Nazarov EG. Detection of radiation-exposure biomarkers by differential mobility prefiltered mass spectrometry (DMS-MS) Int J Mass spectrom. 2010;291:108–117. doi: 10.1016/j.ijms.2010.01.013. [DOI] [PMC free article] [PubMed] [Google Scholar]
- 31.Campbell JL, Le Blanc JC, Kibbey RG. Differential mobility spectrometry: a valuable technology for analyzing challenging biological samples. Bioanalysis. 2015;7:853–856. doi: 10.4155/bio.15.14. [DOI] [PMC free article] [PubMed] [Google Scholar]
- 32.Schneider B, Covey T, Coy S, Krylov E, Nazarov E. Planar differential mobility spectrometer as a pre-filter for atmospheric pressure ionization mass spectrometry. Int J Mass spectrom. 2010;298:45–54. doi: 10.1016/j.ijms.2010.01.006. [DOI] [PMC free article] [PubMed] [Google Scholar]
- 33.Krylov EV, Coy SL, Nazarov EG. Temperature effects in differential mobility spectrometry. Int J Mass spectrom. 2009;279:119–125. [Google Scholar]
- 34.Krylov EV, Nazarov EG. Electric field dependence of the ion mobility. Int J Mass spectrom. 2009;285:149–156. [Google Scholar]
- 35.Krylov EV, Nazarov EG, Miller RA. Differential mobility spectrometer. Int J Mass spectrom. 2007;266:76–85. doi: 10.1016/j.ijms.2010.01.006. [DOI] [PMC free article] [PubMed] [Google Scholar]
- 36.Schneider BB, Nazarov EG, Londry F, Vouros P, Covey TR. Differential mobility spectrometry/mass spectrometry history, theory, design optimization, simulations, and applications. Mass Spectrom Rev. 2016;35:687–737. doi: 10.1002/mas.21453. [DOI] [PubMed] [Google Scholar]
- 37.Beach DG, Melanson JE, Purves RW. Analysis of paralytic shellfish toxins using high-field asymmetric waveform ion mobility spectrometry with liquid chromatography-mass spectrometry. Anal Bioanal Chem. 2015;407:2473–2484. doi: 10.1007/s00216-015-8488-6. [DOI] [PubMed] [Google Scholar]
- 38.Heinig K, Henion J. Determination of carnitine and acylcarnitines in biological samples by capillary electrophoresis-mass spectrometry. J Chromatogr B. 1999;735:171–188. doi: 10.1016/s0378-4347(99)00417-x. [DOI] [PubMed] [Google Scholar]
- 39.Pettegrew JW, Levine J, McClure RJ. Acetyl-L-carnitine physical-chemical, metabolic, and therapeutic properties: relevance for its mode of action in Alzheimer’s disease and geriatric depression. Mol Psychiatry. 2000;5:616–632. doi: 10.1038/sj.mp.4000805. [DOI] [PubMed] [Google Scholar]
- 40.Stahnke H, Kittlaus S, Kempe G, Alder L. Reduction of matrix effects in liquid chromatography-electrospray ionization-mass spectrometry by dilution of the sample extracts: how much dilution is needed? Anal Chem. 2012;84:1474–1482. doi: 10.1021/ac202661j. [DOI] [PubMed] [Google Scholar]
- 41.Dams R, Huestis MA, Lambert WE, Murphy CM. Matrix effect in bio-analysis of illicit drugs with LC-MS/MS: Influence of ionization type, sample preparation, and biofluid. J Am Soc Mass Spectrom. 2003;14:1290–1294. doi: 10.1016/S1044-0305(03)00574-9. [DOI] [PubMed] [Google Scholar]
- 42.Ferrer C, Lozano A, Aguera A, Giron AJ, Fernandez-Alba AR. Overcoming matrix effects using the dilution approach in multiresidue methods for fruits and vegetables. J Chromatogr A. 2011;1218:7634–7639. doi: 10.1016/j.chroma.2011.07.033. [DOI] [PubMed] [Google Scholar]
- 43.Chace DH, Hillman SL, Van Hove JL, Naylor EW. Rapid diagnosis of MCAD deficiency: quantitative analysis of octanoylcarnitine and other acylcarnitines in newborn blood spots by tandem mass spectrometry. Clin Chem. 1997;43:2106–2113. [PubMed] [Google Scholar]
- 44.Campbell JL, Zhu M, Hopkins WS. Ion-molecule clustering in differential mobility spectrometry: lessons learned from tetraalkylammonium cations and their isomers. J Am Soc Mass Spectrom. 2014;25:1583–1591. doi: 10.1007/s13361-014-0939-3. [DOI] [PubMed] [Google Scholar]
- 45.Levin DS, Vouros P, Miller RA, Nazarov EG. Using a nanoelectrospray-differential mobility spectrometer-mass spectrometer system for the analysis of oligosaccharides with solvent selected control over ESI aggregate ion formation. J Am Soc Mass Spectrom. 2007;18:502–511. doi: 10.1016/j.jasms.2006.10.008. [DOI] [PMC free article] [PubMed] [Google Scholar]
- 46.Hall AB, Coy SL, Nazarov EG, Vouros P. Rapid separation and characterization of cocaine and cocaine cutting agents by differential mobility spectrometry-mass spectrometry. J Forensic Sci. 2012;57:750–756. doi: 10.1111/j.1556-4029.2011.02033.x. [DOI] [PubMed] [Google Scholar]
- 47.Hall AB, Coy SL, Nazarov EG, Vouros P. Development of rapid methodologies for the isolation and quantitation of drug metabolites by differential mobility spectrometry-mass spectrometry. Int J Ion Mobil Spec. 2012;15:151–156. doi: 10.1007/s12127-012-0111-3. [DOI] [PMC free article] [PubMed] [Google Scholar]
- 48.Chen Z, Coy SL, Pannkuk EL, Laiakis EC, Hall AB, Fornace AJ, Jr, Vouros P. Rapid and high-throughput detection and quantitation of radiation biomarkers in human and nonhuman primates by differential mobility spectrometry-mass spectrometry. J Am Soc Mass Spectrom. 2016;27:1626–1636. doi: 10.1007/s13361-016-1438-5. [DOI] [PMC free article] [PubMed] [Google Scholar]
- 49.Waikar SS, Sabbisetti VS, Bonventre JV. Normalization of urinary biomarkers to creatinine during changes in glomerular filtration rate. Kidney Int. 2010;78:486–494. doi: 10.1038/ki.2010.165. [DOI] [PMC free article] [PubMed] [Google Scholar]
- 50.McCoin CS, Knotts TA, Adams SH. Acylcarnitines – old actors auditioning for new roles in metabolic physiology. Nature Reviews Endocrinology. 2015;11:617–625. doi: 10.1038/nrendo.2015.129. [DOI] [PMC free article] [PubMed] [Google Scholar]
- 51.Azzam EI, Jay-Gerin JP, Pain D. Ionizing radiation-induced metabolic oxidative stress and prolonged cell injury. Cancer Lett. 2012;327(0):48–60. doi: 10.1016/j.canlet.2011.12.012. [DOI] [PMC free article] [PubMed] [Google Scholar]
- 52.Kam WWY, Banati RB. Effects of ionizing radiation on mitochondria. Free Radic Biol Med. 2013;65:607–619. doi: 10.1016/j.freeradbiomed.2013.07.024. [DOI] [PubMed] [Google Scholar]
- 53.Alves TC, Pongratz RL, Zhao X, Yarborough O, Sereda S, Shirihai O, Cline GW, Mason G, Kibbey RG. Integrated, step-wise, mass-isotopometric flux analysis of the TCA cycle. Cell Metab. 2015;22(5):936–947. doi: 10.1016/j.cmet.2015.08.021. [DOI] [PMC free article] [PubMed] [Google Scholar]
- 54.Barjaktarovic Z, Schmaltz D, Shyla A, Azimzadeh O, Schulz S, Haagen J, Dorr W, Sarioglu H, Schafer A, Atkinson MJ, Zischka H, Tapio S. Radiation-induced signaling results in mitochondrial impairment in mouse heart at 4 weeks after exposure to X-rays. PLoS ONE. 2011;6(12):e27811. doi: 10.1371/journal.pone.0027811. [DOI] [PMC free article] [PubMed] [Google Scholar]
- 55.Mailloux RJ, Beriault R, Lemire J, Singh R, Chenier DR, Hamel RD, Appanna VD. The tricarboxylic acid cycle, an ancient metabolic network with a novel twist. PLoS One. 2007;2:e690. doi: 10.1371/journal.pone.0000690. [DOI] [PMC free article] [PubMed] [Google Scholar]
- 56.Lanz C, Patterson AD, Slavik J, Krausz KW, Ledermann M, Gonzalez FJ, Idle JR. Radiation metabolomics. 3. Biomarker discovery in the urine of gamma-irradiated rats using a simplified metabolomics protocol of gas chromatography-mass spectrometry combined with random forests machine learning algorithm. Radiat Res. 2009;172:198–212. doi: 10.1667/RR1796.1. [DOI] [PMC free article] [PubMed] [Google Scholar]
- 57.Liu H, Wang Z, Zhang X, Qiao Y, Wu S, Dong F, Chen Y. Selection of candidate radiation biomarkers in the serum of rats exposed to gamma-rays by GC/TOFMS-based metabolomics. Radiat Prot Dosim. 2013;154(1):9–17. doi: 10.1093/rpd/ncs138. [DOI] [PubMed] [Google Scholar]
Associated Data
This section collects any data citations, data availability statements, or supplementary materials included in this article.
Supplementary Materials
Table S1(A). Acetylcarnitine calibration curve spiked into rat urine. Peak area ratio (Analyte/IS) for triplicate data. SEM and %CV indicate technical variation.
Table S1(B). Acetylcarnitine calibration curve spiked into NHP urine. Peak area ratio (Analyte/IS) for triplicate data. SEM and %CV indicate technical variation.
Table S1(C). Acetylcarnitine calibration curve spiked into human urine. Peak area ratio (Analyte/IS) for triplicate data. SEM and %CV indicate technical variation. The slope and intercept values, along with their uncertainties, are also reported (uncertainties found in parentheses). Calibration curves from all 3 species were linear across 3 orders of magnitude (0.6–600 μM).
Table S2. Neat creatinine calibration curve run in triplicate. The average peak area ratio (Analyte/IS) and standard deviation (SD) are reported for each concentration.
Figure S1. Neat creatitine calibration curve. 0.8 μM deuterated creatinine (IS) was added to escalating concentrations of creatinine, and then diluted with the creatinine extraction solvent: acetonitrile:water:formic acid (50:50:0.1, v/v/v).


