

Abstract
Purpose
To identify and characterize the functional variants, regulatory gene networks and potential binding targets of SMAD3 in the 15q22 thyroid cancer risk locus.
Methods
We performed linkage disequilibrium (LD) and haplotype analyses to fine map the 15q22 locus. Luciferase reporter assays were applied to evaluate the regulatory effects of the candidate variants. Knockdown by siRNA, microarray analysis, ChIP and qPCR assays were performed to reveal the regulatory gene network and identify its binding targets.
Results
We report a 25.6 kb haplotype within SMAD3 containing numerous SNPs in high LD. SNPs rs17293632 and rs4562997 were identified as functional variants of SMAD3 by luciferase assays within the LD region. These variants regulate SMAD3 transcription in an allele specific manner through enhancer elements in introns of SMAD3. Knockdown of SMAD3 in thyroid cancer cell lines revealed its regulatory gene network including two upregulated genes, SPRY4 and SPRY4-IT1. Sequence analysis and ChIP assays validated the actual binding of SMAD3 protein to multiple SMAD binding element (SBE) sites in the region upstream of SPRY4.
Conclusion
Our data provide a functional annotation of the 15q22 thyroid cancer risk locus.
Keywords: SMAD3, 15q22 locus, papillary thyroid carcinoma, functional variants, downstream targets
INTRODUCTION
Thyroid cancer is the most common endocrine malignancy. According to the National Cancer Institute of the U.S., the estimated number of new thyroid cancers in 2017 is 56 870, with an estimated 2010 deaths (http://seer.cancer.gov/statfacts/html/thyro.html). The majority of thyroid cancers are differentiated thyroid cancers, including papillary and follicular thyroid carcinomas. Papillary thyroid carcinoma (PTC) accounts for 75% ~ 85% of all thyroid cancer.
It is well known that PTC displays strong heritability, however the predisposition to PTC is complex and most likely due to multiple mutations1. The driver mutations can confer distinct gene expression patterns, signaling, and clinical characteristics of PTC2. In the past few years, a series of thyroid cancer risk loci have been identified by genome-wide association studies (GWASs)3. Functional aspects of the risk alleles in some of these loci have been extensively explored4,5. Recently, another GWAS revealed five novel loci that were found to be significantly correlated with thyroid cancer risk6. Of these, two variants at the 15q22 locus showed independent association with thyroid cancer (rs2289261 [C] with OR = 1.23; P = 3.1×10⁻⁹, and rs56062135 [T] with OR = 1.24; P = 4.9×10⁻⁹). These two SNPs are located in separate introns of the SMAD family member 3 gene (SMAD3), however, functional roles for these variants have not been demonstrated. The putative molecular mechanisms leading to thyroid cancer susceptibility are yet undefined.
SMAD3 has been shown to be involved in the induction of apoptosis, metastasis, and tumor progression7–9. As a key signaling molecule of the transforming growth factor-β (TGF-β) pathway, loss of SMAD3 expression can increase cancer susceptibility in gastric cancer and T cell acute lymphoblastic leukemia10,11. Previously, some missense mutations of SMAD3 were reported to reduce its effect on TGF-β-induced transcriptional activation in certain cancer types12,13. SMAD3 protein interacts with other DNA-binding cofactors to either activate or repress the transcription of specific target genes14,15. SMAD3 functions in a cell-type-specific manner to regulate genes in TGF-β signaling. While a number of SMAD3 downstream targets have been discovered in cell models16,17, little is known regarding such targets in thyroid cancer.
SMAD3 shows higher expression in thyroid tissue compared with most other tissues6, suggesting a potential role in the predisposition to thyroid cancer and the maintenance of normal thyroid function. This hypothesis is supported by the fact that the thyroid cancer risk alleles of the two GWAS variants are associated with decreased expression of SMAD3 in normal thyroid tissue in the GTEx database (http://www.gtexportal.org/home/). The purpose of our study was to identify the functional variants of SMAD3 in the 15q22 thyroid cancer risk locus, and to investigate the mechanisms by which alterations of SMAD3 contribute to thyroid cancer susceptibility.
MATERIALS AND METHODS
The study was approved by the Institutional Review Board at the Ohio State University, and all subjects gave written informed consent before participation.
Thyroid cancer cell lines and cell culture
The TPC-1 and BCPAP cell lines were incubated in antibiotic-free DMEM or RPMI 1640 medium, respectively, supplemented with 10% (vol/vol) fetal bovine serum (Thermo Fisher SCIENTIFIC, Waltham, MA) at 37 °C in humidified air with 5% (vol/vol) CO2. The cell lines were obtained from Rebecca Schweppe (University of Colorado Cancer Center, Denver, Colorado). We re-authenticate each cell line by DNA fingerprinting upon receipt. Frozen stocks are re-analyzed periodically every 2-3 years.
Linkage Disequilibrium (LD) and haplotype analyses
LD analysis of the SMAD3 gene was performed using the genotype data from 1000 Genomes Project (Phase3), European population of 503 samples. Haploview V4.218 software was applied and haplotype blocks were generated using the confidence interval method. Haplotypes of the 6 selected SNPs were generated by using the genotyping and computer imputation data from the European descendants in an Ohio cohort of the recent GWAS6. The SHAPEIT V219 program was used to estimate the haplotype frequencies in 1359 PTC cases and 1605 controls. P values and odds ratios (OR) are provided using Fisher’s exact test to compare each haplotype with the rest of the haplotypes.
Generation of plasmid constructs
The six putative regulatory regions containing the corresponding SNPs in SMAD3 introns were PCR-amplified from genomic DNA and cloned into the XhoI and EcoRV sites of the pGL4.10-E4TATA. This vector contains a 50 bp minimal E4TATA promoter. The cloned segments ranged between 115 bp and 195 bp in size. Site-directed mutagenesis was used to create the altered allele for each SNP using the GeneArt Site-Directed Mutagenesis System (Thermo Fisher SCIENTIFIC). All the constructs were validated by Sanger sequencing.
Transfection and dual luciferase reporter assay
For the luciferase reporter assay, TPC-1 and BCPAP cells were transiently transfected with reporter plasmids using lipofectamine 2000 reagents (Thermo Fisher SCIENTIFIC) according to the manufacturer’s instructions. Briefly, cells were seeded in 24-well plates and grown to ~85% confluence at the time of transfection. Each well was transfected with 250 ng luciferase reporter plasmid and 1.25 ng Renilla plasmid pRL-TK (Promega Madison, WI) as an internal control for each well. Cells were lysed 24 h after transfection with 100ul passive lysis buffer (Promega) per well. A 20-ul aliquot of cell lysate was assayed for luciferase activity using the GloMax 96 Microplate Luminometer (Promega).
Chromatin immunoprecipitation (ChIP) assay
ChIP assays to determine the degree of SMAD3 protein enrichment were performed using the Magna ChIP A/G Chromatin Immunoprecipitation Kit (Millipore Sigma) according to the manufacturer’s instructions. Briefly, TPC-1 cells were seeded in 150mm dishes and grown to confluence before harvesting. Cells were fixed with 1% formaldehyde for 10min at room temperature. After sonication, chromatin was immunoprecipitated with a rabbit anti-SMAD3 antibody (ab28379, Abcam, Cambridge, UK) or IgG (#2729, Cell Signaling TECHNOLOGY, Boston, MA) at 4 °C overnight. The protein/DNA complexes were eluted from the magnetic beads after standard washing steps. The cross-links were reversed by incubating at 62 °C for 2h and 95 °C for 10 min. Final DNA products were purified and used as templates for qPCR with primers covering the candidate SMAD3 protein binding sites in the SPRY4 upstream region.
Microarray hybridization following transfection with si-SMAD3
TPC-1 cells were seeded in a 6-well-plate and grown to ~85% confluence at the time of transfection. 25 pmol si-SMAD3 or si-Control were transfected into the cells using 4.5 ul RNAiMAX lipofectamine (Thermo Fisher SCIENTIFIC). After transfection for 24 h, the cells were harvested and total RNA was extracted using the Trizol reagent (Thermo Fisher SCIENTIFIC) then treated by DNase-I (Thermo Fisher SCIENTIFIC) to eliminate DNA contamination. Experiments described above were performed at three different time points in order to obtain three replicates.
RNA concentration was determined using the Qubit 2.0 Fluorometer (Agilent Technologies, Santa Clara, CA) with an RNA HS Assay Kit. The integrity of the RNA samples was assessed by BioAnalyzer (Agilent Technologies). All RNA integrity numbers (RINs) were greater than 9.0. Clariom™ D Human arrays (Thermo Fisher SCIENTIFIC) targeting more than 542,500 transcripts were used to assess gene expression. Totally 100 ng RNA was used to generate the single stranded cDNA samples for hybridization. Then, the cDNA was enzymatically fragmented and biotinylated using the WT Terminal Labeling kit (Thermo Fisher SCIENTIFIC). The cDNA samples were hybridized to the array at 45 °C for 16 h. The arrays were washed and scanned with the Affymetrix GeneChip Scanner 3000 7G system (Thermo Fisher SCIENTIFIC) using Affymetrix GeneChip Command Console (AGCC) software.
Signal intensities were processed by the RMA method using Affymetrix Expression Console software20. The corresponding microarray data have been deposited in the Gene Expression Omnibus (GEO) database (Accession Number GSE102225).
Quantitative real-time PCR assay
Quantitative real-time PCR (qPCR) assay was performed in three biological replicates on an ABI Prism 7900 HT Sequence Detection System (Thermo Fisher SCIENTIFIC) according to the manufacturer’s protocol. For RNA expression analysis, RNA was extracted by using the Trizol reagent (Thermo Fisher SCIENTIFIC) then treated by DNase-I (Thermo Fisher SCIENTIFIC) to eliminate DNA contamination. One microgram RNA was used for cDNA synthesis using High-Capacity cDNA Reverse Transcription Kit (Thermo Fisher SCIENTIFIC). Taqman assays were carried out using Taqman probe sets for SMAD3 (Hs00969210_m1), SPRY4 (Hs01935412_s1) and GAPDH (4352665) with Taqman Fast Universal PCR Master Mix (Thermo Fisher SCIENTIFIC). All the probe sets were purchased from Thermo Fisher SCIENTIFIC. SPRY4-IT1, SPRY4-AS1 and all primer sets used in ChIP assay were detected by Fast SYBR Green Master Mix kit (Thermo Fisher SCIENTIFIC). All qPCR primer sequences are provided in Table S1.
Statistical analysis
Real-time PCR expression and luciferase assay data are represented by mean ± SD. The data were first assessed to ensure the normality by applying the Shapiro test. The homogeneous group variances were assessed by the Bartlett test. The data were then analyzed by applying the t test. All P values reported are two-sided. Gene canonical pathway analysis using the differential gene expression data caused by SMAD3 knockdown was performed using Ingenuity Pathway Analysis (IPA) software (QIAGEN, Hilden, Germany). For the gene expression array analysis, a filtering method based on percentage of arrays above noise cutoff was applied to filter out low expression genes. A linear model was employed to detect differentially expressed genes between conditions. In order to improve the estimates of variability and statistical tests for differential expression, a variance smoothing method with moderated t-statistic was employed21. The significance level was adjusted by controlling the mean number of false positives22. Statistical software SAS 9.4 and R were used for analysis.
RESULTS
Haplotype analysis reveals a 25.6 kb LD block in the SMAD3 gene
The two GWAS tag SNPs, rs56062135 and rs2289261, are located in intron 1 and intron 2 of the SMAD3 gene, respectively. To find other variants that are co-inherited with the two SNPs, we first performed LD analysis in the 129 kb SMAD3 gene region using 1000 Genomes European population data (Figure 1). A 25.6 kb LD block region spanning the chromosomal coordinates 67 441 506 – 67 467 129 (Hg19) in chromosome 15 was detected. In this block, a total of 24 SNPs, including the two tag SNPs, showed significant association with lower SMAD3 expression in non-cancerous thyroid and with thyroid cancer risk (Table S2). We hypothesize that the functional variants, that can influence SMAD3 expression are embedded in the same LD region. Firstly, to identify regulatory variants we retrieved the scores of all the 24 SNPs in the RegulomeDB database (http://www.regulomedb.org/). These scores summarize an annotation for each SNP by predictions based on GEO, ENCODE and other databases and assess the evidence for regulatory potential. We chose SNPs with the lowest RegulomeDB scores (scores from 1 to 3) plus one of the GWAS tag SNPs (rs2289261) for further study. Of the Six SNPs selected, four are located in intron 1 of SMAD3.
Figure 1. Linkage Disequilibrium (LD) plot representation of the SMAD3 locus.
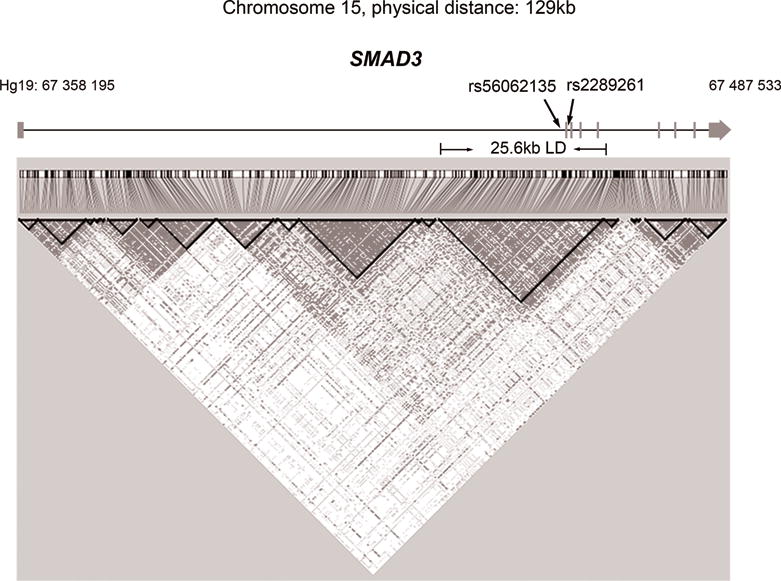
The figure represents linkage disequilibrium based on 1000 Genomes EUR population data (Phase 3) along the SMAD3 locus. The region spans chromosome 15 from 67 358 195 to 67 487 533 for a total of 129 kb. The vertical bars represent exons and the horizontal lines represent introns. Arrows show the direction of transcription in the genome. The two GWAS tag SNPs (rs56062135 and rs2289261) are labelled as indicated.
Secondly, we used the 6 SNPs for haplotype analysis using the genotyping and imputation data from the recent GWAS6. Three haplotypes (P < 0.01) showed significant differences in distribution between PTC cases and controls. Hap2 and Hap3 are PTC protective haplotypes (OR = 0.69 and 0.79), while Hap1 appears to be a PTC risk haplotype (OR = 1.41). Hap1 contains the risk [C] allele of the tag SNP rs2289261, and accounts for 16% of all cases (Table 1).
Table 1.
Haplotype analysis of the SMAD3 locus in PTC cases versus controls.
| Haplotype ID | Haplotype frequenciesa | SNP ID | ||||||||
|---|---|---|---|---|---|---|---|---|---|---|
|
| ||||||||||
| Controls | Cases | ORb | P Valuec | rs1866316 | rs17293632 | rs744910 | rs8032739 | rs2289261 | rs4562997 | |
| Hap #1 | 0.12 | 0.16 | 1.41 | 4.64E-06 | C | T | G | G | C | A |
| Hap #2 | 0.19 | 0.14 | 0.69 | 3.10E-07 | T | C | A | A | G | G |
| Hap #3 | 0.11 | 0.09 | 0.79 | 7.02E-03 | T | C | G | A | G | G |
Haplotype frequencies were estimated using SHAPEIT V2 program.
OR, Odds Ratio.
Fisher’s exact test was applied to compare each haplotype with the rest of the haplotypes.
SNPs rs17293632 and rs4562997 display allele-specific enhancer activity in PTC cell lines
To evaluate the effects of the six variants (rs1866316 T>C, rs17293632 C>T, rs744910 A>G, rs8032739 A>G, rs2289261 C>G, and rs4562997 G>A) on SMAD3 transcription, luciferase reporter assays were performed. Hypothesizing that the intronic variants play an enhancer role in the regulation of SMAD3 expression, 100 bp ~ 200 bp DNA fragments surrounding each SNP allele were cloned into a minimal promoter reporter vector. Luciferase activity was then measured in two PTC cell lines, TPC-1 (Figure 2a) and BCPAP (Figure 2b). Two independent clones for each of the two alleles were generated and enhancer activity was measured in quadruplicate for each group. Of the six tested variants, two SNPs (rs17293632 and rs4562997) showed significant differential enhancer activity in both cell lines (P < 0.01). The wild-type allele [C] of rs17293632 displayed the highest enhancer activity compared with the empty vector control in both cell lines. While the assay showed somewhat differing activity between the TPC-1 and BCPAP cell lines, no allele-specific enhancer activity was observed for rs1866316, rs744910, rs8032739, and rs2289261.
Figure 2. Transcriptional activity of the candidate SMAD3 intronic variants with different alleles.
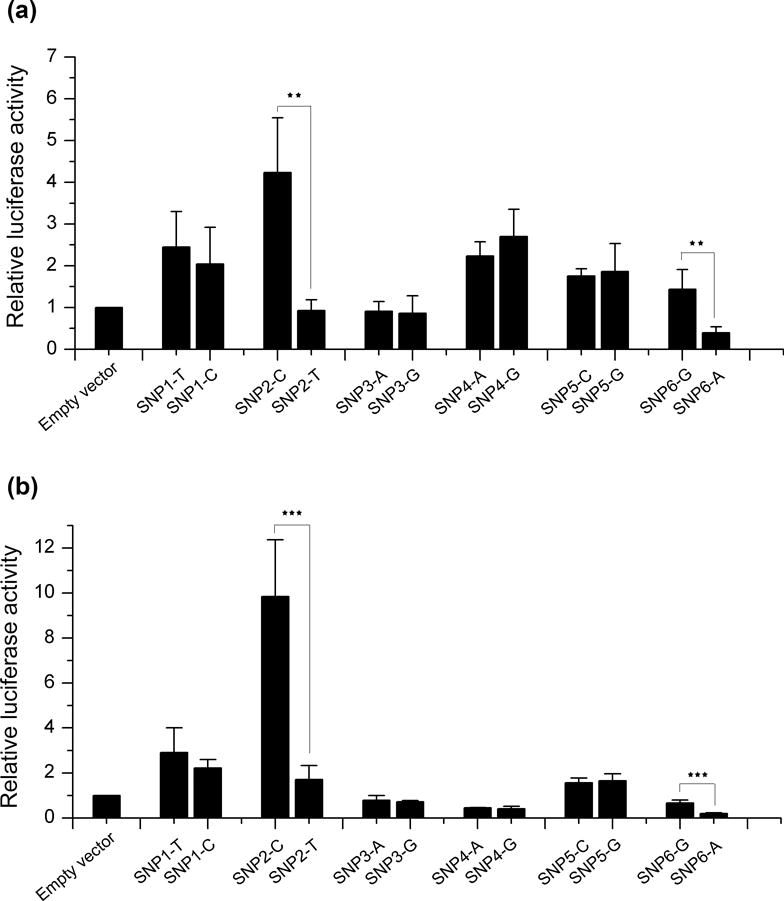
Dual reporter luciferase assay using pGL4.10-E4TATA constructs with either the wild-type or risk allele of the six selected SNPs in TPC-1 cells (a) and BCPAP cells (b). Firefly luciferase values were normalized to cotransfected Renilla values. All values were normalized with the values of the corresponding groups transfected with empty vector. Results are shown as means ± SD of four independent experiments. SNP1: rs1866316; SNP2: rs17293632; SNP3: rs744910; SNP4: rs8032739; SNP5: rs2289261; SNP6: rs4562997. For each SNP, the left allele is the major allele. Each group was repeated four times. **P < 0.01; ***P < 0.001. Two-tailed t test, n = 4.
Taken together, our data demonstrate that rs17293632 and rs4562997 are functional variants which can influence transcriptional activity. We suggest that they function within cis-regulatory regions in SMAD3 introns 1 and 3, respectively.
Identification of differentially expressed genes caused by SMAD3 knockdown
SMAD3 plays an important role as a direct DNA binding transcriptional factor in the TGF-β pathway. To identify genes involved in SMAD3-mediated transcriptional regulation in thyroid, genome-wide expression analysis was carried out by using expression microarray in SMAD3 knockdown cells. TPC-1 and BCPAP cells were transiently transfected by using either SMAD3 target siRNA (si-SMAD3) or scrambled siRNA control (si-Control). Subsequent expression microarray analysis was conducted in the TPC-1 cell line due to its higher knockdown efficacy (Figure S1). A total of 116 dysregulated genes were identified by comparing si-SMAD3 and si-Control treated cells in three independent experiments (P < 0.001, fold change >1.5). Of these genes, 24/116 (21%) were upregulated (Table S3). Biological functional assessment was performed using Ingenuity Pathway Analysis (IPA) software, which showed that cancer was in the top category of “Disease and Disorders” (Table S4). The top five categories of “Molecular and Cellular Functions” were cellular growth and proliferation, cell cycle, cellular development, cell morphology, and cellular function and maintenance (Table S5). These data strongly implicate SMAD3-regulated genes in thyroid carcinogenesis.
SMAD3 acts as a repressor of SPRY4 via direct binding
To further characterize the downstream targets of SMAD3 in thyroid, we compared the differentially expressed genes in the SMAD3 knockdown cells with the expression data of 59 tumor/normal thyroid pairs from the TCGA data portal (https://tcga-data.nci.nih.gov/docs/publications/tcga/). Only the genes that showed either upregulation or downregulation in both groups described above were included. The sprouty RTK signaling antagonist 4 (SPRY4) gene was found to be the second-most dysregulated candidate gene (P = 2.69 × 10⁻¹¹) (Table S6). One of the top 25 dysregulated genes, SPRY4 was found to be upregulated while SMAD3 expression was decreased (Figure 3a). SPRY4 is located in 5q31 (Chromosome 5, genomic coordinates, 141 689 992-141 704 620). Two long non-coding RNAs (lncRNAs) in this locus, SPRY4-IT1 (SPRY4 Intronic Transcript 1) and SPRY4-AS1 (SPRY4 Antisense 1), were transcribed in opposite orientation. To validate the expression change of SPRY4, along with the two lncRNAs, qPCR assays were performed in SMAD3 knockdown PTC cell lines (Fig 3b and 3c). While both SPRY4 and SPRY4-IT1 showed significantly differential expression in the TPC-1 cell line, no significant difference was observed for SPRY4-AS1 (Figure 3d). This implies that SMAD3 functions as a transcriptional repressor of SPRY4 and SPRY4-IT1, but not SPRY4-AS1.
Figure 3. Gene expression profile of SMAD3 knockdown in PTC cell lines.
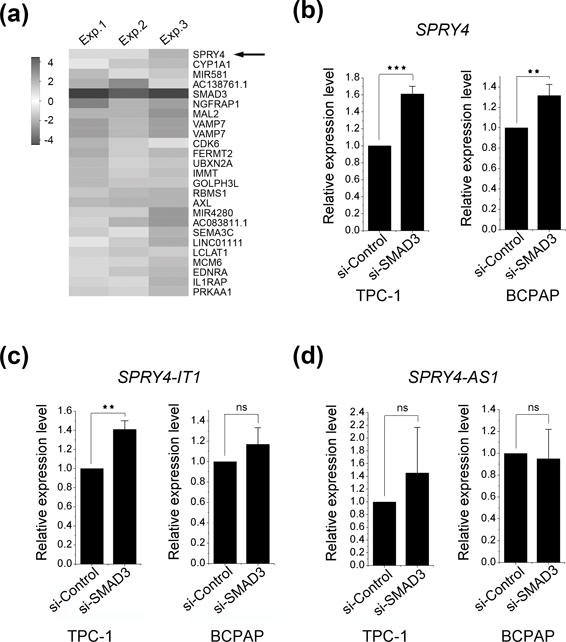
(a) Gene expression differences of the top 25 genes dysregulated by SMAD3 knockdown in TPC-1 cell lines. The expression is plotted with heat-map color scale using relative expression fold change (si-SMAD3 treated cells vs. si-control treated cells) (fold change > 1.5, P < 0.001, n =3). qPCR validations for SPRY4 (b), SPRY4-IT1(c) and SPRY4-AS1 (d) in TPC-1 and BCPAP cell lines.
In an attempt to understand the role of SMAD3 as a SPRY4 repressor via binding, we searched the 15kb upstream region of SPRY4 for potential SMAD3 protein binding sites. SMAD Binding Elements (SBEs) have been defined as a palindromic sequence including 5′GTCT-3′ and it’s complement, 5′-AGAC-3′ (Figure 4a). Many SMAD-responsive regions include more than one SBE, which usually contains extra bases between the palindromic sequence14,23. A total of five potential SBEs were found upstream of SPRY4 with less than 5bp between the two palindromic sequences (Figure 4b). In order to validate the existence of the SBEs, subsequent ChIP assays using a SMAD3 antibody were conducted in TPC-1 cells. Significant DNA enrichment was observed in all five sites (Figure 4c).
Figure 4. SMAD3 binding sites in the upstream region of SPRY4.
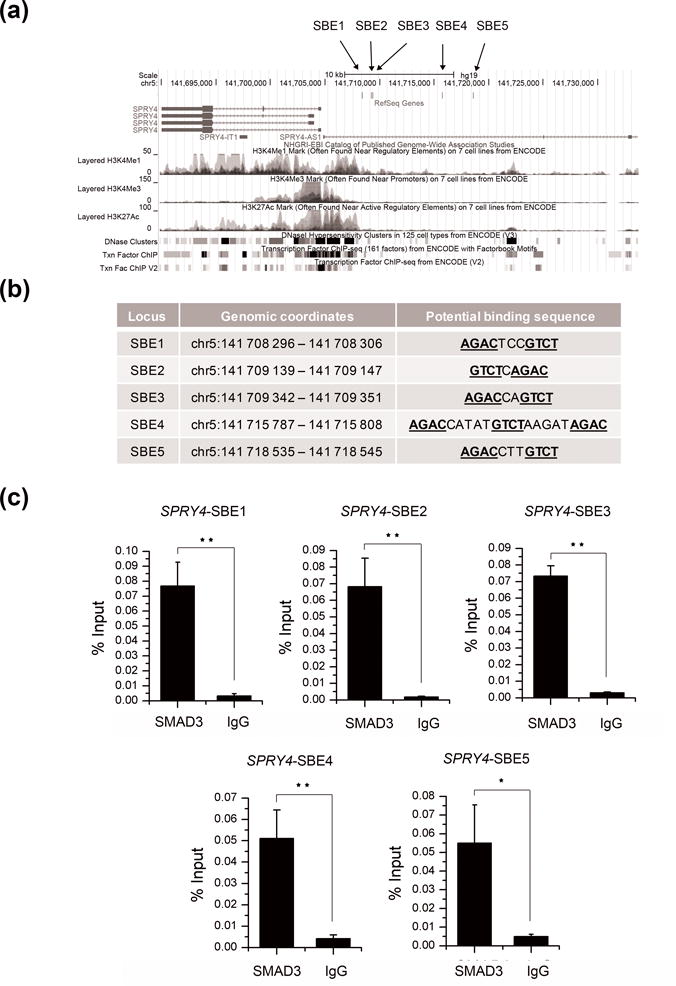
(a) Genomic annotation of the SPRY4 gene and 15 kb of its upstream region in UCSC genome browser (Hg19). Chromatin regulatory features such as DNase hypersensitivity sites, histone modifications and predicted transcription factor binding from ChIP-seq data are included. The locations of the five SBEs are labelled as indicated. (b) The corresponding genomic coordinates and key genomic features of each SBE of SPRY4. The potential binding sequences are underlined. (c) ChIP assays for the five SBEs in TPC-1 cells. Values represent the percentage of the corresponding input DNA control. Results were shown as means ± SD of three replicates. Each group was repeated three times. * P < 0.05; **P < 0.01.
Taken together, SMAD3 is a SPRY4 inhibitor via direct binding at multiple sites in the regulatory region upstream of SPRY4.
DISCUSSION
Thyroid cancer is a complex disease which has one of the strongest genetic components of all cancers24. To identify the low penetrance genes and risk loci that lead to thyroid cancer, several GWASs have been performed in distinct populations3,6,25,26. A number of genetic variants have been reported to be involved in thyroid cancer predisposition. Some of them, such as the risk loci at 9q22 and 14q13, have been well characterized by elucidating the relevant molecular mechanism in thyroid tumorigenesis4,5. A recent GWAS identified 5 novel thyroid cancer risk loci. In the present work, we provide functional annotations for one of these loci located at 15q22 and containing the coding gene SMAD3.
SMAD3 encodes a key regulator in the TGF-β pathway that activates or represses target gene transcription. Variants in protein binding hot-spots on SMAD3 can reduce the binding to its interacting proteins and cause a range of quantitative changes in the expression of genes induced by SMAD327. For instance, typical SMAD3 coding variants can lead to increased aortic expression of several key players in the TGF-β pathway and cause a syndromic form of aortic aneurysms and dissections with early-onset osteoarthritis28,29.
Here, we identified two SMAD3 intronic variants (rs17293632 and rs4562997) that can cause allele-specific dysregulation as determined by luciferase assays. We propose that the intronic regions where the two variants are located are likely to be enhancer elements. Previous reports have found that intron-containing genes show higher transcriptional levels when compared to intronless genes30. Regulatory elements such as enhancers are often located at a distance from the target gene but can form a complex communication with the promoter region. However, recent studies suggest that some elements located within introns can also work in combination and collaboration with promoters31,32. Our results support this hypothesis and provide another example of regulatory intronic variants in a coding gene. In addition, we demonstrate how the germline genotypes of these variants affect the genetic susceptibility to thyroid cancer.
SPRY4 is a member of the sprouty family which is recognized as a key regulator of the ERK signaling pathway33. It has been reported that SPRY4 can inhibit cell proliferation, migration, and invasion in non-small cancer and breast cancer cell lines34,35. Downregulation of SPRY4 in matched prostate normal and tumor tissue pairs was also reported36. Our results show that SPRY4 displays higher expression in normal thyroid tissue compared to adjacent tumor tissue, when it is downregulated by SMAD3 via direct binding at five SBE sites. Moreover, we found that its intronic lncRNA, SPRY4-IT1, is also regulated by SMAD3. SPRY4-IT1 has been described to be involved in metastasis, apoptosis, and proliferation in several cancer types37,38. Our data suggest a role for SMAD3 as a repressor at this locus, but the detailed regulatory mechanism is still unclear. It remains to be elucidated whether additional hitherto unrecognized proteins act with SMAD3 in modulating expression. Based on their important cellular functions, we speculate that the dysregulation of these genes, notably SMAD3 and its targets SPRY4 and SPRY4-IT1, will impact the typical cellular signaling network and promote uncontrolled cell proliferation and metastasis in thyroid cancer.
There are two highly conserved domains in SMAD proteins, MH1 and MH2. The MH1 domain is necessary for sequence-specific DNA binding and transcription. While some GC-rich DNA fragments have been discovered to have a binding affinity with SMAD proteins39, the MH1 domain mainly recognizes the featured sequences that form a SBE palindrome40. Here, we validated the existence of multiple SBEs in the region upstream of the SPRY4 gene. Our results show that the SBE can function as a SMAD3 binding site with more than one nucleotide between the two palindromic sequences. It not only broadens the definition of SBE, but also further proves the correlation between SMAD3 and the two upregulated genes SPRY4 and SPRY4-IT1.
In conclusion, our study provides a functional characterization of the genomic variants that have a causal role in creating thyroid cancer risk. The expression of SMAD3 in thyroid cells is regulated by enhancers located in introns of the gene. The enhancers in turn are regulated in an allele-specific manner by the functional genomic variants. We also validate the regulatory mechanism for SPRY4 and SPRY4-IT1 by SMAD3 protein as a transcriptional factor. Our data support an important role of SMAD3, a key member of TGF-β signaling, in thyroid cancer predisposition.
Supplementary Material
Acknowledgments
We thank Dr. Matthew D. Ringel for helpful discussions and suggestions. We thank the OSU Comprehensive Cancer Center (OSUCCC) Genomics Shared Resource for help with microarray hybridization. The analysis was done in part by an allocation of computing time from the Ohio Supercomputer Center. This work was supported by National Cancer Institute Grants P30CA16058 and P50CA168505.
Footnotes
AUTHOR CONTRIBUTIONS
Y.W., H.H., and A.d.l.C. designed the experiments; Y.W. and L.G. performed the experiments; S.L. performed LD and haplotype analysis; L.Y. performed expression analysis for microarray assays; W.L., J.P., R.S., and P.B. contributed reagents and tissue samples; Y.W., A.d.l.C., and H.H. wrote the paper.
SUPPLEMENTARY MATERIAL
Supplementary information is available at the Genetics in Medicine website.
References
- 1.Nagy R, Ringel MD. Genetic predisposition for nonmedullary thyroid cancer. Horm Cancer. 2015;6(1):13–20. doi: 10.1007/s12672-014-0205-y. [DOI] [PMC free article] [PubMed] [Google Scholar]
- 2.Fagin JA, Wells SA., Jr Biologic and Clinical Perspectives on Thyroid Cancer. N Engl J Med. 2016;375(23):2307. doi: 10.1056/NEJMc1613118. [DOI] [PubMed] [Google Scholar]
- 3.Gudmundsson J, Sulem P, Gudbjartsson DF, et al. Common variants on 9q22.33 and 14q13.3 predispose to thyroid cancer in European populations. Nat Genet. 2009;41(4):460–464. doi: 10.1038/ng.339. [DOI] [PMC free article] [PubMed] [Google Scholar]
- 4.Wang Y, He H, Li W, et al. MYH9 binds to lncRNA gene PTCSC2 and regulates FOXE1 in the 9q22 thyroid cancer risk locus. Proc Natl Acad Sci U S A. 2017;114(3):474–479. doi: 10.1073/pnas.1619917114. [DOI] [PMC free article] [PubMed] [Google Scholar]
- 5.Jendrzejewski J, He HL, Radomska HS, et al. The polymorphism rs944289 predisposes to papillary thyroid carcinoma through a large intergenic noncoding RNA gene of tumor suppressor type. Proc Natl Acad Sci U S A. 2012;109(22):8646–8651. doi: 10.1073/pnas.1205654109. [DOI] [PMC free article] [PubMed] [Google Scholar]
- 6.Gudmundsson J, Thorleifsson G, Sigurdsson JK, et al. A genome-wide association study yields five novel thyroid cancer risk loci. Nat Commun. 2017;8:14517. doi: 10.1038/ncomms14517. [DOI] [PMC free article] [PubMed] [Google Scholar]
- 7.Yanagisawa K, Osada H, Masuda A, et al. Induction of apoptosis by Smad3 and down-regulation of Smad3 expression in response to TGF-beta in human normal lung epithelial cells. Oncogene. 1998;17(13):1743–1747. doi: 10.1038/sj.onc.1202052. [DOI] [PubMed] [Google Scholar]
- 8.Xue J, Lin X, Chiu WT, et al. Sustained activation of SMAD3/SMAD4 by FOXM1 promotes TGF-beta-dependent cancer metastasis. J Clin Invest. 2014;124(2):564–579. doi: 10.1172/JCI71104. [DOI] [PMC free article] [PubMed] [Google Scholar]
- 9.Tang PM, Zhou S, Meng XM, et al. Smad3 promotes cancer progression by inhibiting E4BP4-mediated NK cell development. Nat Commun. 2017;8:14677. doi: 10.1038/ncomms14677. [DOI] [PMC free article] [PubMed] [Google Scholar]
- 10.Han SU, Kim HT, Seong DH, et al. Loss of the Smad3 expression increases susceptibility to tumorigenicity in human gastric cancer. Oncogene. 2004;23(7):1333–1341. doi: 10.1038/sj.onc.1207259. [DOI] [PubMed] [Google Scholar]
- 11.Wolfraim LA, Fernandez TM, Mamura M, et al. Loss of Smad3 in acute T-cell lymphoblastic leukemia. N Engl J Med. 2004;351(6):552–559. doi: 10.1056/NEJMoa031197. [DOI] [PubMed] [Google Scholar]
- 12.Fleming NI, Jorissen RN, Mouradov D, et al. SMAD2, SMAD3 and SMAD4 mutations in colorectal cancer. Cancer Res. 2013;73(2):725–735. doi: 10.1158/0008-5472.CAN-12-2706. [DOI] [PubMed] [Google Scholar]
- 13.Ku JL, Park SH, Yoon KA, et al. Genetic alterations of the TGF-beta signaling pathway in colorectal cancer cell lines: a novel mutation in Smad3 associated with the inactivation of TGF-beta-induced transcriptional activation. Cancer Lett. 2007;247(2):283–292. doi: 10.1016/j.canlet.2006.05.008. [DOI] [PubMed] [Google Scholar]
- 14.Massague J, Seoane J, Wotton D. Smad transcription factors. Genes Dev. 2005;19(23):2783–2810. doi: 10.1101/gad.1350705. [DOI] [PubMed] [Google Scholar]
- 15.Millet C, Zhang YE. Roles of Smad3 in TGF-beta signaling during carcinogenesis. Crit Rev Eukaryot Gene Expr. 2007;17(4):281–293. doi: 10.1615/critreveukargeneexpr.v17.i4.30. [DOI] [PMC free article] [PubMed] [Google Scholar]
- 16.Zhang Y, Handley D, Kaplan T, et al. High throughput determination of TGFbeta1/SMAD3 targets in A549 lung epithelial cells. PLoS One. 2011;6(5):e20319. doi: 10.1371/journal.pone.0020319. [DOI] [PMC free article] [PubMed] [Google Scholar]
- 17.Mullen AC, Orlando DA, Newman JJ, et al. Master transcription factors determine cell-type-specific responses to TGF-beta signaling. Cell. 2011;147(3):565–576. doi: 10.1016/j.cell.2011.08.050. [DOI] [PMC free article] [PubMed] [Google Scholar]
- 18.Barrett JC, Fry B, Maller J, Daly MJ. Haploview: analysis and visualization of LD and haplotype maps. Bioinformatics. 2005;21(2):263–265. doi: 10.1093/bioinformatics/bth457. [DOI] [PubMed] [Google Scholar]
- 19.Delaneau O, Marchini J, Zagury JF. A linear complexity phasing method for thousands of genomes. Nature methods. 2011;9(2):179–181. doi: 10.1038/nmeth.1785. [DOI] [PubMed] [Google Scholar]
- 20.Irizarry RA, Hobbs B, Collin F, et al. Exploration, normalization, and summaries of high density oligonucleotide array probe level data. Biostatistics. 2003;4(2):249–264. doi: 10.1093/biostatistics/4.2.249. [DOI] [PubMed] [Google Scholar]
- 21.Gulati Yu L, Fernandez P, Pennell S, Kirschner M, Jarjoura LD. Fully moderated T-statistic for small sample size gene expression arrays. Stat Appl Genet Mol Biol. 2011;10(1) doi: 10.2202/1544-6115.1701. [DOI] [PMC free article] [PubMed] [Google Scholar]
- 22.Gordon A, Glazko G, Qiu X, Yakovlev A. Control of the Mean Number of False Discoveries, Bonferroni and Stability of Multiple Testing. Ann Appl Stat. 2007;1(1):179–190. [Google Scholar]
- 23.Tone Y, Furuuchi K, Kojima Y, Tykocinski ML, Greene MI, Tone M. Smad3 and NFAT cooperate to induce Foxp3 expression through its enhancer. Nat Immunol. 2008;9(2):194–202. doi: 10.1038/ni1549. [DOI] [PubMed] [Google Scholar]
- 24.Goldgar DE, Easton DF, Cannonalbright LA, Skolnick MH. Systematic Population-Based Assessment of Cancer Risk in First-Degree Relatives of Cancer Probands. J Natl Cancer Inst. 1994;86(21):1600–1608. doi: 10.1093/jnci/86.21.1600. [DOI] [PubMed] [Google Scholar]
- 25.Gudmundsson J, Sulem P, Gudbjartsson DF, et al. Discovery of common variants associated with low TSH levels and thyroid cancer risk. Nat Genet. 2012;44(3):319–322. doi: 10.1038/ng.1046. [DOI] [PMC free article] [PubMed] [Google Scholar]
- 26.Son HY, Hwangbo Y, Yoo SK, et al. Genome-wide association and expression quantitative trait loci studies identify multiple susceptibility loci for thyroid cancer. Nat Commun. 2017;8:15966. doi: 10.1038/ncomms15966. [DOI] [PMC free article] [PubMed] [Google Scholar]
- 27.Schiro MM, Stauber SE, Peterson TL, et al. Mutations in protein-binding hot-spots on the hub protein Smad3 differentially affect its protein interactions and Smad3-regulated gene expression. PLoS One. 2011;6(9):e25021. doi: 10.1371/journal.pone.0025021. [DOI] [PMC free article] [PubMed] [Google Scholar]
- 28.van de Laar IM, Oldenburg RA, Pals G, et al. Mutations in SMAD3 cause a syndromic form of aortic aneurysms and dissections with early-onset osteoarthritis. Nat Genet. 2011;43(2):121–126. doi: 10.1038/ng.744. [DOI] [PubMed] [Google Scholar]
- 29.Regalado ES, Guo DC, Villamizar C, et al. Exome Sequencing Identifies SMAD3 Mutations as a Cause of Familial Thoracic Aortic Aneurysm and Dissection With Intracranial and Other Arterial Aneurysms. Circ Res. 2011;109(6):680–U220. doi: 10.1161/CIRCRESAHA.111.248161. [DOI] [PMC free article] [PubMed] [Google Scholar]
- 30.Shabalina SA, Ogurtsov AY, Spiridonov AN, Novichkov PS, Spiridonov NA, Koonin EV. Distinct patterns of expression and evolution of intronless and intron-containing mammalian genes. Mol Biol Evol. 2010;27(8):1745–1749. doi: 10.1093/molbev/msq086. [DOI] [PMC free article] [PubMed] [Google Scholar]
- 31.Stadhouders R, van den Heuvel A, Kolovos P, et al. Transcription regulation by distal enhancers: who’s in the loop? Transcription. 2012;3(4):181–186. doi: 10.4161/trns.20720. [DOI] [PMC free article] [PubMed] [Google Scholar]
- 32.Ott CJ, Blackledge NP, Kerschner JL, et al. Intronic enhancers coordinate epithelial-specific looping of the active CFTR locus. Proc Natl Acad Sci U S A. 2009;106(47):19934–19939. doi: 10.1073/pnas.0900946106. [DOI] [PMC free article] [PubMed] [Google Scholar]
- 33.Masoumi-Moghaddam S, Amini A, Morris DL. The developing story of Sprouty and cancer. Cancer Metastasis Rev. 2014;33(2–3):695–720. doi: 10.1007/s10555-014-9497-1. [DOI] [PMC free article] [PubMed] [Google Scholar]
- 34.Vanas V, Muhlbacher E, Kral R, Sutterluty-Fall H. Sprouty4 interferes with cell proliferation and migration of breast cancer-derived cell lines. Tumour Biol. 2014;35(5):4447–4456. doi: 10.1007/s13277-013-1587-0. [DOI] [PubMed] [Google Scholar]
- 35.Tennis MA, Van Scoyk MM, Freeman SV, Vandervest KM, Nemenoff RA, Winn RA. Sprouty-4 inhibits transformed cell growth, migration and invasion, and epithelial-mesenchymal transition, and is regulated by Wnt7A through PPARgamma in non-small cell lung cancer. Mol Cancer Res. 2010;8(6):833–843. doi: 10.1158/1541-7786.MCR-09-0400. [DOI] [PMC free article] [PubMed] [Google Scholar]
- 36.Wang JH, Thompson B, Ren CX, Ittmann M, Kwabi-Addo B. Sprouty4, a suppressor of tumor cell motility, is downregulated by DNA methylation in human prostate cancer. Prostate. 2006;66(6):613–624. doi: 10.1002/pros.20353. [DOI] [PubMed] [Google Scholar]
- 37.Shen F, Cai WS, Feng Z, et al. Long non-coding RNA SPRY4-IT1 pormotes colorectal cancer metastasis by regulate epithelial-mesenchymal transition. Oncotarget. 2017;8(9):14479–14486. doi: 10.18632/oncotarget.10407. [DOI] [PMC free article] [PubMed] [Google Scholar]
- 38.Mazar J, Zhao W, Khalil AM, et al. The Functional Characterization of Long Noncoding RNA SPRY4-IT1 in Human Melanoma Cells. Oncotarget. 2014;5(19):8959–8969. doi: 10.18632/oncotarget.1863. [DOI] [PMC free article] [PubMed] [Google Scholar]
- 39.Baburajendran N, Jauch R, Tan CYZ, Narasimhan K, Kolatkar PR. Structural basis for the cooperative DNA recognition by Smad4 MH1 dimers. Nucleic Acids Res. 2011;39(18):8213–8222. doi: 10.1093/nar/gkr500. [DOI] [PMC free article] [PubMed] [Google Scholar]
- 40.Malhotra N, Kang J. SMAD regulatory networks construct a balanced immune system. Immunology. 2013;139(1):1–10. doi: 10.1111/imm.12076. [DOI] [PMC free article] [PubMed] [Google Scholar]
Associated Data
This section collects any data citations, data availability statements, or supplementary materials included in this article.