

Abstract
Throughout infancy, childhood, and adolescence, our brains undergo remarkable changes. Processes including myelination and synaptogenesis occur rapidly across the first 2–3 years of life, and ongoing brain remodeling continues into young adulthood. Studies have sought to characterize the patterns of structural brain development, and early studies predominately relied upon gross anatomical measures of brain structure, morphology, and organization. MRI offers the ability to characterize and quantify a range of microstructural aspects of brain tissue that may be more closely related to fundamental neurodevelopmental processes. Techniques such as diffusion, magnetization transfer, relaxometry, and myelin water imaging provide insight into changing cyto- and myeloarchitecture, neuronal density, and structural connectivity. In this review, we focus on the growing body of literature exploiting these MRI techniques to better understand the microstructural changes that occur in brain white matter during maturation. Our review focuses on studies of normative brain development from birth to early adulthood (~25 years), and places particular emphasis on longitudinal studies and newer techniques that are being used to study microstructural white matter development. All imaging methods demonstrate consistent, rapid microstructural white matter development over the first 3 years of life, suggesting increased myelination and axonal packing. Diffusion studies clearly demonstrate continued white matter maturation during later childhood and adolescence, though the lack of consistent findings in other modalities suggests changes may be mainly due to axonal packing. An emerging literature details differential microstructural development in boys and girls, and connects developmental trajectories to cognitive abilities, behavior, and/or environmental factors, though the nature of these relationships remains unclear. Future research will need to focus on newer imaging techniques and longitudinal studies to provide more detailed information about microstructural white matter development, particularly in the childhood years.
Keywords: Brain Development, Brain MRI, Myelination, White matter, Neuroimaging
2. Introduction
2.1 Brain Growth
How does the healthy brain change as we learn, play, and grow? From the micro to macro scale, the human brain undergoes remarkable structural changes throughout childhood that lay the critical foundation for long-term cognitive outcomes and mental health. Infancy and early childhood encompass the period of peak brain growth, but brain structure continues to be refined and remodeled throughout childhood, adolescence, and into young adulthood in response to genetics and environmental conditions (Rice and Barone, 2000; Stiles and Jernigan, 2010).
Major white matter tracts including projection and commissural pathways emerge in the fetal brain between 13–18 weeks post conception; thalamocortical and association pathways develop later during the fetal period (24–32 weeks) (Huang et al., 2009; Takahashi et al., 2012; Vasung et al., 2017). All major white matter tracts are present by the end of normal gestation (37–42 weeks) and can be identified using diffusion tractography (Jovanov-Milosevic et al., 2006; Keunen et al., 2017), even though little myelin is present. Fetal white matter development involves pre-myelination phases such as the proliferation of oligodendrocyte progenitor cells, followed by the development of immature oligodendrocytes, and ultimately, development of mature oligodendrocytes, the glia that form the myelin sheath (Jakovcevski et al., 2009).
The elaboration of the myelin sheath around neuronal axons (myelination) begins in mid-to-late gestation (at approximately 20 weeks) and plays an increasing role in brain communication (Fields, 2010). As the lipid myelin sheath forms around the neuronal axons, it acts to increase the conduction velocity of electrical impulses, improving brain connectivity. Myelination advances rapidly throughout early childhood (the first 5 years of life) in a carefully choreographed caudal-cranial, posterior-to-anterior arc (Barkovich et al., 1988; Yakovlev and Lecours, 1967). This ontogenic pattern is tightly regulated by neural activity (Demerens et al., 1996; Ishibashi et al., 2006), and coincides with the emergence of cognitive skills and abilities (Fornari et al., 2007; Luna et al., 2004). While the majority of myelination occurs during the first 2 years of life, this critical process continues through adolescence and adulthood, reaching a maximum in the 2nd or 3rd decade of life (Yakovlev and Lecours, 1967), and undergoes refinements throughout the lifespan.
White matter microstructural development is susceptible to environmental influences and changes can be induced by learning or intense activity (Fields, 2008; Zatorre et al., 2012). A possible mechanism for these changes is activity-dependent myelination, either via new myelination of previously-unmyelinated pathways, or via myelin remodeling of already myelinated axons (Fields, 2015). The exact mechanisms remain unclear, though both animal and human studies show white matter plasticity in response to learning or environmental stimuli that suggest ongoing interactions between brain development and one’s environment (Blumenfeld-Katzir et al., 2011; Keller and Just, 2009; Scholz et al., 2009). While plasticity may vary in magnitude and time course, it is not limited to particular developmental periods, but has been shown to occur at all stages of life.
2.2 Magnetic resonance imaging
The advancement of non-invasive neuroimaging techniques, particularly magnetic resonance imaging (MRI), has allowed a new generation of investigations into the patterns of brain growth. By selectively ‘tuning’ the MRI signal via acquisition protocol and parameters, information can be obtained on differing but complementary aspects of the tissue microstructure. The most historical of these measures are the longitudinal and transverse relaxation times (T1 and T2, respectively) (Bottomley et al., 1984). Changes in T1 and T2 can be driven by differences in water, lipid and molecule content, iron concentration, cell packing and density, and other tissue properties that affect water mobility (Gelman et al., 2001; Miot-Noirault et al., 1997). Another method for improving myelin contrast is using the ratio of T1 to T2-weighted imaging (Glasser and Van Essen, 2011). T1 and T2 imaging are sensitive to microstructural features (e.g., myelination, iron, and water content/fibre packing), but are more typically used to measure brain macrostructure including volume, cortical thickness, and surface area.
More commonly, MRI studies assess microstructure using metrics derived from the measurement of water diffusion with diffusion tensor imaging (DTI), including fractional anisotropy (FA) and mean, radial, and axial diffusivity (MD, RD, and AD, respectively). These DTI parameters are sensitive to aspects of tissue microarchitecture such as local fibre density, coherence, orientation, myelination, and overall tissue ‘integrity’ (Basser and Jones, 2002; Beaulieu, 2002). DTI data also allow reconstruction of the 3D fibre architecture via tractography (Basser et al., 2000; Mori et al., 1999). Animal models confirm the sensitivity of DTI measures to myelin in single and coherent fibre systems (e.g., spinal cord, corpus callosum) (Song et al., 2003; Song et al., 2002), but also show that anisotropy is present in the absence of myelin (Beaulieu, 2002; Beaulieu and Allen, 1994). DTI has been by far the most widely used technique to assess development of tissue microstructure, likely because of quick scan times that can be tolerated by children, convenient access to protocols on clinical scanners, and the availability of free, user-friendly analysis software.
However, DTI is limited, particularly in areas with multiple fiber populations where the tensor model is insufficient, which may be the majority of the brain (Jeurissen et al., 2013). A variety of alternate diffusion acquisition schemes and models have been introduced to overcome the limitations of DTI, though most have not yet found wide application in neurodevelopment. Acquisition techniques such as high angular resolution diffusion imaging (HARDI)(Tuch et al., 2002) and diffusion spectrum imaging (DSI)(Wedeen et al., 2005) collect more directions than DTI and use higher b-values (Tournier et al., 2013). This enables more complex models fitting multiple fiber orientations in each voxel to better reflect tissue microstructure. Alternatively, models have been developed to characterize white matter microstructure in more detail than DTI parameters. These include the composite hindered and restricted CHARMED model (Assaf and Basser, 2005) and neurite orientation dispersion and density imaging (NODDI) (Zhang et al., 2012), which provide additional architectural information, including axonal and neurite density (NDI) and orientation dispersion index (ODI). Diffusion kurtosis imaging (DKI) is a model-free fitting that measures deviations from the Gaussian signal caused by restricted diffusion (Jensen et al., 2005). Its parameters are analogous to those from DTI, with mean, axial, and radial kurtosis (MK, AK, RK). White matter tract integrity (WMTI) is an extension of DKI that relates measures to microstructure, providing estimates of intra-axonal water fraction and fiber dispersion (Fieremans et al., 2011). Fixel-based analysis (FBA) is new technique that provides measurements of specific fiber populations within a voxel (Raffelt et al., 2015), overcoming some of the averaging limitations of DTI metrics. These more advanced acquisitions and models often require double or triple the scan time of a typical DTI acquisition, meaning that fewer children will be able to tolerate the scan and provide good data, and making them less attractive to researchers attempting to acquire additional data (e.g., functional MRI) within the same study. Furthermore, analysis is not as straightforward and software not as readily available for advanced diffusion techniques as it is for DTI. Thus, while these advanced acquisitions and models are capable of providing valuable information, they have not been as extensively used to study neurodevelopment, particularly beyond infancy.
Magnetization transfer (MT) imaging utilizes off-resonant prepulses (+Δ or −Δ) that saturate the macromolecular protons, which then exchange with the free-water protons, reducing the signal available for imaging (Henkelman et al., 2001). Magnetization transfer ratio (MTR) is the ratio of a reference signal to that obtained with the off-resonant pulse, and provides a measure sensitive to macromolecular content, including myelin. Quantitative magnetization transfer (qMT) is a related measure that requires longer acquisition times but more accurately quantifies the macromolecule-bound water fraction than MTR, and also provides an indirect measure of myelin content (van Buchem et al., 2001). MTR and qMT both show strong associations with myelin content in postmortem studies (Schmierer et al., 2004; Schmierer et al., 2007; Schmierer et al., 2008). An extension of MT is inhomogeneous MT (ihMT) (Varma et al., 2013), which exploits a difference between the positive and negative offset signal to improve the sensitivity and selectivity to lipid (e.g., myelin) protons. ihMT contrast within brain white matter is driven by dipolar coupling in lipid membranes of myelin (Manning et al., 2017). Chemical exchange saturation transfer (CEST) approaches including amide proton transfer (APT) imaging (Zhou et al., 2003) also offer contrast mechanisms based on interactions between macromolecular and water protons that may useful for assessing microstructural brain development.
Improved sensitivity to myelin and myeloarchitecture can also be achieved via multi-component relaxation time measurement. Here, the measured MRI signal is assumed to result from multiple water species, each with distinct T1 and T2 properties (MacKay et al., 2006). With sufficient measurements and appropriate modeling, it is possible to decompose the measured signal into these individual contributions. Analysis of spine and brain tissue has consistently revealed the presence of at least two distinct water pools with fast and slow relaxation times that through disease and histological studies have been ascribed to water trapped within the lipid bilayers of the myelin sheath and the less-restricted intra and extra-cellular water, respectively (Laule et al., 2008; Laule et al., 2006). Measurement of the myelin-associated water fraction (MWF) has found historical utility in diseases that affect myelin structure or integrity (e.g., multiple sclerosis, (Laule et al., 2008; Laule et al., 2006)), but also more recently in neurodevelopment (Deoni et al., 2012; Deoni et al., 2014).
In addition to providing individual information, many of these measures can be combined to inform on additional relevant microstructural properties. For example, qMT or MWF measures combined with neurite density information from a diffusion study can be used to quantify the myelin thickness, or g-ratio (Dean et al., 2016; Mohammadi et al., 2015), which is related to communication efficiency of axons. A few neuroimaging studies have linked structural white matter connectivity and measures of brain functional efficiency in neurodevelopment (Dubois et al., 2008; Olesen et al., 2003; Richards et al., 2015), but the nature of these relationships is not yet well-understood.
Figure 1 shows examples of several different measures that are sensitive to tissue microstructure in the same 11-year-old healthy female, including T1-weighted imaging, FA and RD from DTI, MWF, NDI from NODDI, g-ratio from a combination of MWF and DTI, and qihMT and qMT. All of these are useful measures of microstructure, with different sensitivity and specificity to various contributions, and different acquisition and analysis challenges. Choices of which acquisition(s) and parameter(s) to use in a given study must be based on considerations of available scanning time, scanning hardware, subject population, and specific research question (e.g., sensitivity to change versus specificity to a particular biological process).
Figure 1.

MRI contrast ‘stains’ acquired on the same 11 year-old female, including a conventional T1-weighted image, and maps of diffusion parameters (FA, RD, and NDI), myelin water fraction (MWF), myelin thickness (g ratio), and pseudo-quantitative inhomogeneous and homogeneous magnetization transfer (qihMT and qMT).
One of the most important considerations in pediatric studies of brain development is motion. As children are likely to move during prolonged acquisition protocols, a variety of approaches have been used to acquire high quality data in children without sedation. These include the “wrap and feed” method for infants, scanning children while asleep (Dean et al., 2014a), training in a mock-scanner (de Bie et al., 2010; Hallowell et al., 2008), video watching (Harned and Strain, 2001), and other behavioural techniques (Hartman et al., 2009; Theys et al., 2014). Generally, the more quickly data can be acquired, the more likely a pediatric subject is to provide high quality data. As MRI becomes faster, the use of advanced sequences that require long acquisition times will become easier and likely more common in the developmental imaging literature.
Imaging studies have tended to focus on either infants and young children (~0–4 years) or older children and adolescents (~4–25 years), with few spanning the full age range. Infant studies require specialized equipment (i.e., head coils, vacuum bags) and scanning protocols (i.e., quiet, fast, and differing acquisition parameters) that are often inconsistent with studies in older children. Thus, it is largely for practical reasons that studies tend to cluster in these age ranges. This can make it difficult to determine trajectories across the entire span of development, as studies are not continuous and it is difficult to compare absolute values across studies. On the other hand, changes through later childhood are more apparent when not obscured by the very large changes that occur in infancy.
2.3 Objective
Here, we aimed to review the growing literature of MRI studies of white matter microstructural brain development from infancy to young adulthood. We limit this review to development after birth, omitting both fetal brain development and brain degeneration. Lifespan studies offer insight into the processes of microstructural brain changes and have made valuable contributions to our understanding of brain development, though the inclusion of elderly subjects can bias or obscure conclusions about developmental processes (Fjell et al., 2010). Therefore, we mention lifespan studies where relevant, but do not extensively review them. Furthermore, we limit the review to studies of typical white matter development, excluding studies primarily focused on a particular disorder or disease population, including preterm infants. DTI studies of neurodevelopment have been recently reviewed elsewhere, both in infancy (Dubois et al., 2014; Qiu et al., 2015) and childhood/adolescence (Lebel et al., 2017; Tamnes et al., 2017), so we include key findings from DTI studies, but focus on recent studies that use advanced diffusion models or other microstructural imaging techniques to investigate specific aspects of tissue microstructure. As this review is focused exclusively on the postnatal period, most studies reviewed here primarily measure or attempt to measure myelination and axonal packing, rather that pre-myelination processes that occur in the fetal brain.
Thus, the current review includes studies of typically-developing infants, children, adolescents, and young adults aged 0–25 years. We briefly review macrostructural development to provide context for microstructural studies, and then provide an overview of the literature on white matter microstructural brain changes. We highlight consistent findings across modalities, and pay particular attention to recent (in the last decade) non-DTI studies. We briefly discuss sex differences, and the influence of genetic and environmental factors on microstructural brain development. We conclude with potential future directions that could address the many gaps in the current literature.
3. Healthy Brain Development
3.1. Macrostructural Development
An overview of large-scale brain changes during development is useful to provide context for studying white matter changes at the microscopic level, so we briefly review key findings here. Substantial volumetric and morphological changes occur over the first few years of life, including large increases in total brain volume, as well as white matter and gray matter volume (Groeschel et al., 2010; Pfefferbaum et al., 1994). By age 6 years, total brain volume has reached approximately 90% of adult values, with incremental increases continuing through the remainder of childhood and into adolescence (Giedd et al., 1999; Lenroot et al., 2007; Mills et al., 2016). While total brain volume remains relatively stable (Aubert-Broche et al., 2013; Giedd et al., 1999; Lebel and Beaulieu, 2011; Mills et al., 2016), regional volume changes continue as a result of ongoing plasticity and fine-tuning of neural systems. White matter volume increases across infancy, childhood and adolescence (Aubert-Broche et al., 2013; Giedd et al., 1999; Groeschel et al., 2010; Lebel and Beaulieu, 2011; Mills et al., 2016; Pfefferbaum et al., 1994), with lifespan studies demonstrating that white matter reaches peak volume during the fourth decade of life (Lebel et al., 2012). In contrast, gray matter volume increases during infancy (Makropoulos et al., 2016), then decreases during childhood and adolescence along with cortical thickness (Aubert-Broche et al., 2013; Giedd et al., 1999; Groeschel et al., 2010; Lebel and Beaulieu, 2011; Lenroot et al., 2007; Mills et al., 2016; Pfefferbaum et al., 1994). Figure 2 shows these volume trends within two sample datasets, one from 0–5 years, and the other from 5–32 years. For more detailed reviews of macrostructural changes, please see (Giedd and Rapoport, 2010; Vijayakumar et al., 2017).
Figure 2.

Developmental trends of white matter, gray matter, and total brain volume across childhood, adolescence, and young adulthood. White matter, gray matter, and total brain volume increase markedly across childhood (top row, 0–5 y). White matter volume continues to increase into young adulthood (bottom row, 5–32 years), while gray matter volume decreases and total brain volume remains stable. Data in the bottom row is longitudinal, so multiple scans from the same individual are connected by a line. Top row is unpublished data from Deoni et al.; bottom row data is adapted from Lebel and Beaulieu 2011.
3.2 Studies of Microstructural Development
To understand the underlying changes in tissue structure and architecture that drive large-scale macrostructural changes, many studies have investigated typical development of the brain’s white matter microstructure. The majority of these studies have used diffusion tensor imaging (DTI) to assess microstructure. Given the plethora of diffusion studies of typical white matter development from birth to young adulthood (n=~80), we focus here on the larger and/or longitudinal DTI studies in this review, as they have the highest power to detect age-related trends. For a more comprehensive reviews of cross-sectional DTI studies of healthy development, including tables of recent studies, please see (Dubois et al., 2014; Lebel et al., 2017; Qiu et al., 2015; Tamnes et al., 2017). Fewer studies (n=11) have used magnetization transfer, myelin water imaging, and/or advanced diffusion imaging models to study the development of brain white matter microstructure. Table 1 provides a list of non-DTI studies examining white mater microstructural development since 2007. Notably, only one study was longitudinal (Dean et al., 2015). The wealth of DTI literature is beginning to point to clear findings during both early and later childhood, but the non-DTI literature is relatively scarce. As will be detailed later in this review, this literature on young children points clearly to ongoing myelination, while the conclusions to be drawn in later childhood and adolescence are less clear. Thus, while good preliminary work has been done to understand microstructural brain development, more studies, especially longitudinal studies and those using advanced microstructural imaging techniques, are necessary.
Table 1.
Key findings of non-DTI magnetic resonance imaging studies of typical white matter microstructural development from 0–25 years since 2007 are summarized. Studies using a variety of imaging techniques find rapid maturation in early childhood (~0–5 years) suggesting ongoing myelination. Studies in older children and adolescents find increases of NDI, but no changes or slight decreases in MTR. Studies using only DTI have been omitted from this table as they are numerous, and have been listed elsewhere in recent reviews (Dubois et al., 2014; Lebel et al., 2017; Qiu et al., 2015; Tamnes et al., 2017).
| Paper | N | Ages (years) |
Modality (analysis) |
Model Used | Key Findings of White Matter Microstructural Changes with Age |
|---|---|---|---|---|---|
|
| |||||
| Perrin 2008 (Perrin et al., 2008) | 408 | 12–18 | T1, MTR (ROI – only CST) | Linear | MTR decrease with age in male adolescents; suggests no major myelin changes in adolescence |
|
| |||||
| Leppert et al, 2009 (Leppert et al., 2009) | 114 | 0–4.5 | T2 relaxometry (ROIs) | Exponential | Rapid, nonlinear decreases of T2 across early childhood in corpus callosum, caudate and thalamus; evidence of posterior-to-anterior progression |
|
| |||||
| Paydar 2014 (Paydar et al., 2014) | 59 | 0–4.6 | DKI, DTI (ROIs) | Exponential | Increases of FA, MK in all ROIs except FA in putamen; largest increases of FA & MK in frontal & parietal WM, ALIC |
|
| |||||
| Dean 2015 (Dean et al., 2015) | 108 | 0.2–5.5 (longitudinal | MWF (ROIs) | Gompertz | Gompertz function – slow, fast, slow |
| Sex differences, associations with cognitive abilites | |||||
|
| |||||
| Jelescu 2015 (Jelescu et al., 2015) | 55 | 0–2.75 | WMTI, NODDI (ROIs) | Linear, exponential | Increases of intra-axonal water and tortuosity, trend increase in WMTI but not NODDI fiber alignment in splenium and genu; smaller increases in PLIC |
|
| |||||
| Dean 2016 (Dean et al., 2016) | 18 | 0.25–7.5 | g-ratio (from mcDESPOT & NODDI) | Logarithmic | Decreases throughout brain, continuing across age range |
|
| |||||
| Moura 2016 (Moura et al., 2016) | 176 | 7–14 | MTR (ROIs) and DTI (TBSS, also above in table) | Age bin comparisons | No MTR-DTI correlation; no age-related changes in MTR |
| Widespread FA increases and MD and RD decreases, and small clusters where AD decreases | |||||
|
| |||||
| Pangelinan 2016 (Pangelinan et al., 2016) | 941/761 | 12–19 | MTR, T1 | Linear | Decreasing MTR, T1 intensity in male adolescents, but not in females; changes in males are mediated by puberty stage and bioavailable testosterone |
|
| |||||
| Zhang 2016 (Zhang et al., 2016) | 82 | 0.2–15.5 | MT and APT | Exponential | APTW decreasing exponential, MTR increasing exponential |
|
| |||||
| Genc 2017 (Genc et al., 2017a) | 72 | 4–19 | NODDI ROIs | Linear, quadratic, cubic | Widespread increases of NDI; NDI more strongly related to age than any other parameter |
|
| |||||
| Mah 2017 (Mah et al., 2017) | 27 | 8–13 | NODDI | Linear | Widespread increases of NDI; no change in ODI |
| Probabilistic tractography | |||||
MTR: magnetization transfer ratio; DKI: diffusion kurtosis imaging; MWF: myelin water fraction; APT: amide proton transfer; NODDI: neurite orientation dispersion and density imaging; NDI: neurite density index; ODI: orientation dispersion index; ROI: region of interest, TBSS: tract based spatial statistics, FA: fractional anisotropy, MD: mean diffusivity, AD: axial diffusivity, RD: radial diffusivity; ILF/SLF: inferior/superior longitudinal fasciculus; UF: uncinate fasciculus; CST: corticospinal tracts
3.3 Developmental Timing
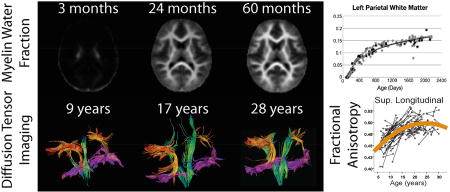
Histological studies have demonstrated that substantial myelination occurs during the first years of life (Yakovlev and Lecours, 1967), and similar patterns of development are apparent on conventional MRI (Figure 3). Across modalities, MRI studies consistently show the expected rapid increase in white matter maturation through infancy and toddlerhood (Figure 4). DTI parameters FA and MD (Hermoye et al., 2006; Mukherjee et al., 2001; Paydar et al., 2014) show similar findings to T2 relaxometry (Leppert et al., 2009), MTR (Engelbrecht et al., 1998; van Buchem et al., 2001; Zhang et al., 2016), DKI (Paydar et al., 2014), g-ratio (Dean et al., 2016), WMTI (Jelescu et al., 2015), and APT (Zhang et al., 2016). Changes in infancy represent increases of ~30–200% for FA, MK, and MTR, or decreases of 20–100% for T2, g-ratio, and APT, with the most rapid changes occurring in the first 1–2 years of life.
Figure 3.

Myelin water fraction (MWF, top row) T1 (middle), and T2 (bottom) change considerably throughout the brain across early childhood, show here from 3–60 months (5 years). A trend is evident with central areas myelinating before peripheral areas. Figure is adapted from Deoni et al., 2012.
Figure 4.

Developmental trajectories through infancy and early childhood show rapid changes over the first 2–3 years of life and many appear to plateau by 5 years. Data shown here is taken from several different studies (listed below plots) using a variety of methods to image brain microstructure. Overall, a trend is evident with earlier plateaus in the splenium versus the genu of the corpus callosum, suggesting a posterior-to-anterior pattern of development.
The white matter changes observed in infants are so large in magnitude they make it appear that development is complete by early childhood (Fig. 4). However, many MRI studies demonstrate subtler microstructural changes that occur in later childhood and adolescence. DTI studies overwhelmingly show positive correlations of FA, and negative correlations of MD and RD with age throughout adolescence, and into the twenties in some brain regions (Lebel et al., 2017; Pohl et al., 2016; Taki et al., 2013). While many DTI studies covering narrow age ranges use linear fits, it is clear from large studies across wider age ranges that microstructural changes are non-linear (Lebel et al., 2008; Taki et al., 2013; Tamnes et al., 2010). Longitudinal studies are best able to model development curves, and have clearly illustrated the exponential curves of DTI parameters FA and MD with peaks/minima reached during late adolescence or early adulthood (Lebel and Beaulieu, 2011; Simmonds et al., 2014; Wang et al., 2012). Figure 5 shows tractography data in example individuals, and a scatter plot of FA values across a group of children and youth. Significant maturation in these tracts can be appreciated across this period, with peak ages occurring between 21–25 years for these tracts. Changes in FA are ~10–25% from age 5–25 years (Lebel et al., 2008; Tamnes et al., 2010), considerably smaller than 30–130% changes that occur from 0–3 years (Hermoye et al., 2006; Paydar et al., 2014).
Figure 5.

Individual tractography results for the superior longitudinal fasciculus (orange), inferior longitudinal fasciculus (magenta), and corticospinal tracts (green) are shown in three representative healthy individuals at different ages. The whole dataset is shown in scatterplots at right, with data from the individuals shown at left identified in colour. The scatter plots show later maturation in the superior longitudinal fasciculus compared to the other regions. Ages of peak FA values were 21 and 23 years for the left and right corticospinal tracts, and 24 and 25 years for the inferior and superior longitudinal fasciculi, respectively. Figure is adapted from Lebel and Beaulieu 2011.
DKI studies from middle childhood to older adulthood show peak MK is reached between 34–45 years (Das et al., 2016; Falangola et al., 2008), slightly later than studies have shown for FA values (Hasan et al., 2009a; Hasan et al., 2009b; Lebel et al., 2010; Lebel et al., 2012; Westlye et al., 2009; Yeatman et al., 2014).
A handful of studies using NODDI have demonstrated significant NDI-age correlations in adolescence, in the absence of accompanying orientation dispersion index (ODI)-age correlations (Chang et al., 2015; Genc et al., 2017a; Mah et al., 2017). While FA increases into the 20s or 30s and then decreases in middle- and later-adulthood (Hasan et al., 2009a; Hasan et al., 2009b; Lebel et al., 2010; Lebel et al., 2012; Westlye et al., 2009; Yeatman et al., 2014), NDI continues to increase into the 60s, accompanied by increases in ODI that begin in young adulthood (Chang et al., 2015).
Decreases of T2 relaxation times continue through adolescence and young adulthood (Saito et al., 2009), again, at a much slower pace than during infancy (Leppert et al., 2009). Another lifespan study quantified R1, reporting similar peak ages for R1 and diffusivity values, though maturation trajectories were markedly different for these two parameters, suggesting that they are measuring different processes during development and senescence (Yeatman et al., 2014).
A recent study of g-ratio in 92 individuals demonstrated stable g-ratios in most of the corpus callosum from 7–85 years (Berman et al., 2017). Exceptions were noted in the callosal motor fibers, where g-ratio increased, and the anterior frontal area, where g-ratio decreased with age. Taken together with the g-ratio study in infants (Dean et al., 2016), this suggests that g-ratio changes occur early in development, coinciding with the most rapid period of myelination, and then level off in later childhood. However, future studies focusing on later childhood and/or adolescence may reveal more subtle changes in g-ratio that are obscured when fitting across both development and aging.
In contrast to evidence from other modalities, MT changes have not been robustly shown during adolescence. An MT study of adolescents 12–18 years showed no correlations between age and MTR in the CST in females, and a negative correlation in males (Perrin et al., 2008); a combined MT/DTI study showed robust and widespread correlations of DTI parameters with age from 7–14 years, but no significant correlations between age and MTR (Moura et al., 2016). With relatively few MT studies of brain development, it can be difficult to determine when plateaus are reached. However, the lack of development or slight decrease in MTR during adolescence suggests that MTR peaks are reached sometime during childhood (Moura et al., 2016; Pangelinan et al., 2016; Perrin et al., 2009). Because each of these modalities is sensitive to different underlying physiological processes, the discrepant results may simply indicate that different processes (e.g., myelination vs axonal packing) occur at different rates and with different trajectories, rather than providing conflicting messages. The interpretation of these changes will be further discussed in Section 3.5. A lack of longitudinal studies, or studies bridging childhood and adolescence using MT, MWF, or other microstructural imaging techniques, makes it difficult to draw conclusions about ages at which peak values are reached.
3.4 Regional Variation in Development
Across all imaging modalities, there is considerable regional variation in development trajectories. Post-mortem studies first described a posterior-to-anterior and inferior-to-superior pattern of brain maturation for myelination of white matter (Yakovlev and Lecours, 1967). This pattern is apparent on images of infants (Fig. 3), where central regions such as the CST appear to myelinate before more peripheral brain areas. Few MR studies have directly examined gradients of change, though there is some support for posterior-to-anterior and inferior-to-superior patterns in the FA values of healthy children and adolescents (Colby et al., 2011; Krogsrud et al., 2016). Interestingly, one study (Krogsrud et al., 2016) also shows some evidence of a right-to-left pattern of white matter change in diffusivity, though not in FA values. Indirect support for a posterior-to-anterior pattern of myelination is offered by examining maturation of the corpus callosum, where posterior areas reach peaks earlier than anterior areas; this pattern is exhibited by parameters from DTI (Lebel et al., 2008), NODDI (Mah et al., 2017), T2 relaxometry (Leppert et al., 2009), g-ratio (Dean et al., 2016), MWF (Dean et al., 2015), and DKI (Jelescu et al., 2015; Paydar et al., 2014).
More broadly, DTI and MWF studies have reported earlier development in core sensory and motor regions, and later development frontal and temporal white matter connections, as demonstrated by age at which the peak or plateau is reached (Lebel et al., 2008; O'Muircheartaigh et al., 2014; Tamnes et al., 2010). Large and/or longitudinal DTI studies consistently demonstrate more protracted maturation in frontal-temporal connections, which continues into the 20s (Giorgio et al., 2010; Lebel and Beaulieu, 2011; Lebel et al., 2008; Tamnes et al., 2010). The only large NODDI study of multiple white matter tracts shows similar regional variation, with later frontal-temporal development (Genc et al., 2017a). A quantitative T1 and T2 study in infants directly compared maturation across white matter tracts, and found that the superior longitudinal fasciculus and arcuate fasciculus were the least mature, while the fornix, optic radiations, and spino-thalamic tracts were most mature in the first few months of life (Kulikova et al., 2015). This timing and pattern parallels developmental patterns seen in cortical thickness and volume studies (Gogtay et al., 2004; Lenroot et al., 2007; Mills et al., 2016; Sowell et al., 2004).
It is also important to note that in addition to regional variation in development rates, there is considerable regional variation in parameter values at all stages in development. Even when maturation is complete, values will vary across the brain. This is apparent in raw images, or, for example, in Fig. 5, where FA values in the corticospinal tracts reach an asymptote for FA of around 0.53–0.54, while maturity in the inferior and superior longitudinal fasciculi occurs around 0.47, and 0.5, respectively. In adults, diffusion measures including FA, NDI, and MK are higher in the corpus callosum and the corticospinal tracts than in other white matter areas (Chang et al., 2015; Das et al., 2016; Lebel et al., 2012). Even within the corpus callosum, values tend to be higher in the splenium than the genu or body (Das et al., 2016; Hasan et al., 2009b; Lebel et al., 2010). This variation is due to differences in axon diameter, axonal packing, and natural variation in myelination that occurs across the brain (Aboitiz et al., 1992; Yakovlev and Lecours, 1967). Due to this variation, in some cases percent changes may be a more appropriate measure of maturation than absolute changes, to account for natural regional variation. The best practice is to show scatterplots with data points and trends, and to report both percent changes and absolute changes to provide complete information to readers.
3.5 Interpretation of Changes
There are many physiological processes that may cause changes in imaging parameters to occur during development. Possible microstructural contributions include myelination, or changes in axonal density or axon coherence. Concurrent changes in tract volume, iron content, and water content also influence various imaging parameters.
Histological studies show that myelination occurs rapidly during infancy, and this is confirmed by each of the microstructural imaging parameters sensitive to myelin. FA shows rapid increases during infancy (e.g., (Hermoye et al., 2006; Mukherjee et al., 2001; Paydar, 2014)), as do other imaging parameters such as MWF (Dean et al., 2015), g-ratio (Dean et al., 2016), DKI (Paydar, 2014), MTR (Zhang et al., 2016), and WMTI (Jelescu et al., 2015). Jelescu et al. (2015) observed no changes in fibre dispersion across the first 3 years of life, suggesting that axon coherence remains stable during childhood and is not a major driver of maturation. A study using both DTI and DKI found that MK increased more than FA in the first 5 years of life (Paydar et al., 2014), which may reflect isotropic changes to microstructure such as changes to the extracellular matrix or reorganization of myelin. Rapid decreases in diffusivity during infancy may also reflect, in part, decreasing water content (Neil et al., 2002).
The changes during later childhood and adolescence are less clear, and no myelin-specific methods have been used to date to investigate age-related changes in later childhood and adolescence. Axial and radial diffusivity from DTI provide increased specificity to axonal integrity, and myelin and fibre density (Song et al., 2003; Song et al., 2002; Song et al., 2005), respectively, than FA or MD. DTI studies of neurodevelopment most commonly find that age-related FA increases and/or MD decreases are accompanied by decreases of RD (Bava et al., 2010; Brouwer et al., 2012; Giorgio et al., 2008; Krogsrud et al., 2016; Lebel and Beaulieu, 2011; Lebel et al., 2008; Moura et al., 2016; Pohl et al., 2016; Scherf et al., 2014; Simmonds et al., 2014). This suggests myelination, increasing fiber density, and/or axon coherence. Most DTI studies report little or no change in AD (Bava et al., 2010; Giorgio et al., 2008; Krogsrud et al., 2016; Lebel and Beaulieu, 2011; Lebel et al., 2008; Moura et al., 2016; Pohl et al., 2016; Scherf et al., 2014; Simmonds et al., 2014); only a few report increases of AD with age (Brouwer et al., 2012; Giorgio et al., 2010), which may be related to reduced tortuosity (straightening) of axons, as has been seen in rats (Takahashi et al., 2000). However, all 3 NODDI studies of childhood and adolescence find strong correlations between age and NDI, without accompanying changes in ODI (Chang et al., 2015; Genc et al., 2017a; Mah et al., 2017), showing that axon coherence is not a major contributor to the developmental changes observed in numerous DTI studies.
It is possible that increases of white matter volume could contribute to observed changes, particularly in DTI studies where partial voluming at the edges of white matter tracts may be a concern. While white matter volume increases during childhood and adolescence (Giedd and Rapoport, 2010; Lebel and Beaulieu, 2011), it follows a different trajectory than diffusion parameters (Taki et al., 2013), and several studies demonstrate diffusion changes independent of tract volume (Brouwer et al., 2012; Giorgio et al., 2010; Lebel and Beaulieu, 2011; Scherf et al., 2014).
MTR, which is sensitive to myelin, does not show significant increases in late childhood/early adolescence despite accompanying increases of FA (Moura et al., 2016). In one study, MTR even showed slight decreases during adolescence in males (Pangelinan et al., 2016). The lack of MTR changes in adolescence suggest that myelin is not be a major contributor to microstructural development during adolescence. However, given histological findings that myelination continues into adulthood (Benes, 1989; Yakovlev and Lecours, 1967), it may be that myelin changes are very subtle, and require large sample sizes and/or longitudinal studies to detect.
Thus, myelination is a major contributor to early brain maturation, and is likely accompanied by increased axonal packing and decreasing water content. There is also good evidence that axon coherence remains stable across brain development, and is not driving changes in microstructural imaging parameters at any point in neurodevelopment. White matter microstructural maturation in later childhood and adolescence appears to be driven by changes in neurite density, particularly axonal packing. Evidence for role of myelin in later brain changes is supported by histological findings but lacking convincing imaging evidence to date. More studies are necessary, particularly those using advanced imaging techniques and models more specific to myelin, to determine the processes driving the observed developmental changes during late childhood and adolescence.
3.6 Relative sensitivity of parameters
The agreement of multiple techniques finding rapid development in infancy is likely due to their shared sensitivity to myelin. The disagreement among techniques during later childhood and adolescence, however, is likely due to their sensitivities to other processes. For example, in addition to myelin, DTI parameters are sensitive to axonal packing and axon coherence, while MTR is sensitive to other macromolecules.
A handful of multimodal studies are able to directly assess the relative sensitivity of different parameters to cross-sectional microstructural development. A study using both DTI and MTR to assess changes in late childhood and adolescence found that FA was the most sensitive to change (i.e., correlated with age in the most regions), followed closely by MD and RD (Moura et al., 2016). AD had significant correlations in only a few regions, while MTR was not correlated with age in any region. Two recent studies have showed that the NDI parameter from NODDI is more sensitive to microstructural changes in late childhood and adolescence than FA (Genc et al., 2017a; Mah et al., 2017). Another study found that MK is more sensitive to changes in early childhood than FA, since it demonstrates continued maturation beyond the age at which FA plateaus (Paydar et al., 2014). Finally, in late childhood, RD was found to be more closely correlated with age than either MWF or qihMT, suggesting it is more sensitive to age-related changes (Geeraert et al., 2017).
Thus, it seems that diffusion techniques are most sensitive to maturation, with the advanced diffusion parameters such as NDI and MK able to measure even more subtle changes than FA or RD. However, DTI is not a specific technique. Measures like MWF, g-ratio, and ODI are more specific to aspects of white matter development and thus may be more desirable for certain studies to measure, depending on their goals. Future multi-modal studies combining diffusion measures with more specific techniques may be the key to understanding precisely which processes occur during certain periods of development.
4. Individual Differences in Brain Development
4.1. Sex-Related Differences
Most studies reviewed here include both males and females and do not test for sex differences. Some studies test for absolute differences and find none (Bava et al., 2010; Eluvathingal et al., 2007; Giorgio et al., 2008; Lebel et al., 2008; Mah et al., 2017; Muetzel et al., 2008), while others report sex differences in diffusion parameters FA, MD, and NDI that are inconsistent across samples and across brain regions (Chiang et al., 2011; Genc et al., 2017a; Herting et al., 2012; Schmithorst et al., 2008; Schneiderman et al., 2007). However, of more interest for this review are sex differences in brain development over time, which is something that many studies do not explicitly measure. Several DTI studies report earlier development in females, as evidenced by microstructural parameter changes that occur at younger ages in girls than boys, and/or continued changes of parameters during adolescence in males, with slower and/or absent changes in females (Asato et al., 2010; Clayden et al., 2012; Seunarine et al., 2015; Simmonds et al., 2014; Wang et al., 2012). A study of MWF in infants and young children also found earlier development in girls than in boys (Dean et al., 2015). MTR decreases in boys across adolescence, but no change was observed in girls (Pangelinan et al., 2016), which may be in line with earlier developmental changes in females observed by DTI studies. These findings of earlier development in girls and more protracted change in boys are generally confirmed by studies of white matter volume, which also shows more protracted development in males than females (Lenroot et al., 2007; Perrin et al., 2008). However, it is important to note that several DTI studies report no significant differences in developmental trajectories between males and females during childhood and adolescence (Bava et al., 2010; Krogsrud et al., 2016; Lebel et al., 2008; Muftuler et al., 2012). Thus, the literature points toward small, but significant differences between sexes, with earlier microstructural development occurring in females, and more a protracted time course in males.
Puberty may also influence brain development, but fewer studies have directly examined this. Two DTI studies (Asato et al., 2010; Menzies et al., 2015) suggested that puberty has additional influence on white matter microstructural development over and above age, and an MT study showed a role of testosterone in MTR changes during adolescence (Perrin et al., 2008). However, another DTI study showed limited influence of pubertal status: after accounting for age and sex, only the right insula had separate contributions from pubertal status (Herting et al., 2012). A fixel-based diffusion study showed differences of fibre density between age-matched groups of pre-pubertal versus pubertal children in the splenium of the corpus callosum, suggesting that puberty may be related to increased axon diameter (Genc et al., 2017b). MTR changes in the CST during adolescence (12–18 years), which were only significant in males, were mediated by both testosterone levels and pubertal stage (Perrin et al., 2008). Whole brain MTR in males was also related to androgen receptor genotype (Pangelinan et al., 2016).
More studies, particularly in large, longitudinal samples, are necessary to disentangle any potential effects of puberty and sex on microstructural brain development.
4.2 Influence of Genetics
The influence of genetics on brain development remains an important topic with a growing literature. On the macroscale, cross-sectional and longitudinal studies have investigated and demonstrated genetic influences on total brain, white, and gray matter volume (Peper et al., 2009; Yoon et al., 2010) (Brouwer et al., 2012; Chiang et al., 2011), with a review provided by (Douet et al., 2014). Investigating more specific aspects of microstructure, findings of altered white matter structure and integrity have been reported in older children with similar genetic polymorphisms (Kohannim et al., 2012), as well as older adolescents with specific heightened risk of schizophrenia (Zhou et al., 2017). Genetics has a strong influence on white matter structure in infancy (Geng et al., 2012; Lee et al., 2015), late childhood/early adolescence (Koenis et al., 2015), and adulthood (Jahanshad et al., 2013). A longitudinal study of twins showed no genetic influence on rates of white matter microstructure development during childhood (Brouwer et al., 2012), suggesting that this genetic influence remains stable. However, studies have reported higher heritability of white matter structure (FA) in infants (Geng et al., 2012) and adolescents (Chiang et al., 2011) compared to adults, suggesting that genetic influence on white matter structure decreases with age. The heterogeneity in the imaging-genetic literature with respect to longitudinal development could indicate that the expression of specific genetic markers is associated with development only in specific age windows. For example, DM20 and PLP1 are selectively associated with pre- and post-natal myelination, respectively (Edgar and Garbern, 2004). The major genetic risk factor for Alzheimer’s Disease, the ApoE 4 allele, has also been associated with altered early brain myelination (Dean et al., 2014b).
4.3 Influence of the Environment
The decreasing genetic influence on white matter microstructure with age likely accompanies an increasing influence of environmental factors. Environmental factors may impact the development of white matter microstructure across the lifespan. For example, prenatal alcohol exposure is associated with faster decreases of MD during childhood and adolescence (Treit et al., 2013). Prenatal anxiety is linked with lower FA in right frontal white matter in infants (Rifkin-Graboi et al., 2015), while prenatal depression is associated with higher FA in similar areas (Lebel et al., 2016), suggesting altered white matter developmental trajectories in young children. Postnatally, breastfeeding is associated with faster increases of MWF in infants (Deoni et al., 2013), while DHA supplementation in preterm infants appears to increase FA (Tam et al., 2016). Children who experience early adversity (e.g., deprivation) have lower FA and higher MD than typical children, and early foster care mitigates the abnormalities (Bick et al., 2015), suggesting differing developmental trajectories based on the caregiving environment. Educational attainment in adolescence is related to improved white matter microstructure (higher FA) independent of age (Noble et al., 2013). Overall, positive environmental influences such as breastfeeding and nutritional support appear to cause faster and/or greater white matter development, while negative environmental influences including prenatal exposures or early deprivation appear to cause slower or impaired white matter development. However, there are clearly many unanswered questions when it comes to environmental influences on white matter development, and future studies will help elucidate these relationships.
4.4 Relationships with Cognitive Abilities and Behaviour
Extensive reviews already exist that highlight general relationships between evolving brain structure and morphometry throughout childhood, and emerging cognitive functions or behaviours, e.g., (Casey et al., 2000; Giedd et al., 2008). In cross-sectional studies, better white matter “integrity” (i.e., higher FA, MWF, MT, and/or lower MD) is generally associated with better cognitive abilities, and fewer behavioural problems. Longitudinal studies of cognitive abilities or behaviour and white matter development are less common, but show that the relationship is more complicated. For example, one study showed that good readers have FA increases over time, while poor readers have FA decreases over time, so good readers have lower FA in late childhood but higher FA in early adolescence (Yeatman et al., 2012). Another study showed that bigger gains in language skills were associated with bigger drops of MD in children with fetal alcohol spectrum disorder (FASD) (Treit et al., 2013). One study of white matter development in individuals with attention deficit hyperactivity disorder (ADHD) showed fewer differences of white matter microstructure between children with ADHD and controls than in adults, suggesting differential development trajectories with individuals with ADHD exhibiting slower and/or reduced development (Bouziane et al., 2018). Myelin content (MWF) has been related to motor, vision, and language functioning cross-sectionally in infants and toddlers (O'Muircheartaigh et al., 2014), and patterns of myelination have further been linked to overall cognitive outcomes (Deoni et al., 2014).
There is a growing literature linking cognitive abilities, behaviour, genes, and environment to the development of white matter microstructure, though there remain many questions. In particular, longitudinal studies are needed to truly understand developmental trajectories and move beyond simply correlations with age in a cross-sectional sample. Additionally, few non-DTI studies have examined influences on white matter development (particularly beyond infancy) and could potentially highlight the specific processes that are altered in children. Finally, attribution of differences in white matter development to one (or even multiple) cognitive ability, behaviour, genetic or environmental influence is difficult as samples are very heterogeneous and it is impossible to control all potentially confounding variables.
5. Conclusions
In conclusion, the studies of developing brain microstructure clearly point to rapid development in infancy and early childhood, driven largely by increasing myelination. Development of brain microstructure continues at a slower pace into adulthood, but the underlying processes remain somewhat unclear, though studies point primarily to increasing axonal packing. There is regional variation in development patterns, with earlier maturation in central regions compared to peripheral, and in the posterior compared to the anterior corpus callosum. Sensory and motor regions tend to mature earliest, and emotional and cognitive regions in frontal and temporal areas follow the most protracted course, and do not reach plateaus until early adulthood.
The majority of literature to date on development of brain microstructure, especially beyond early childhood, has used DTI, which is a powerful, but limited technique. Techniques such as DKI, MWF, WMTI, and g-ratio have been used to better elucidate brain development in infancy, but have not yet found wide application to brain development in late childhood and adolescence. Accelerated acquisition techniques for more advanced metrics including multi-tensor or model-free diffusion imaging, qMT and qihMT, and MWF means that they may now be more widely adopted and deployed.
Relatively few longitudinal studies of typical white matter microstructural development exist, and all but one of these longitudinal studies used DTI. Recent initiatives, including the NIH-funded Baby Connectome, Adolescent Brain Cognitive Development (ABCD), and Environmental influences on Child Health Outcomes (ECHO) studies, the UK Biobank and Developing Connectome studies, and others, may help fill these voids by combining diverse neuroimaging, cognitive, genetic, and other environmental datasets collected on large (>10,000), longitudinal child cohorts. Smaller studies, which offer flexibility to use a single scanner, more advanced techniques, and more homogeneous populations, will continue to play an important role in our understanding of microstructural brain development and will complement larger studies by answering more specific questions.
The next decade is likely to bring significant advances to our understanding of the specific processes involved in development of white matter microstructure, and how these are altered by genetic, cognitive, or environmental factors. Overall, a better understanding of what drives development of brain microstructure will lend itself to better identification of deviations from it, and more effective and efficient interventions when problems arise.
Acknowledgments
This work was supported by the National Institutes of Mental Health (RO1 MH087510) the Bill & Melinda Gates Foundation (0PP1120016), and the Environmental influences on Child Health Outcomes (ECHO) (UG3 OD023313), by the Alberta Children’s Hospital Research Institute, and the Canadian Institutes of Health Research (CIHR).
Conflict of interest statement:
CL’s spouse is an employee of General Electric Healthcare. SD receives consulting fees and grant support from Nestle Research.
Footnotes
Publisher's Disclaimer: This is a PDF file of an unedited manuscript that has been accepted for publication. As a service to our customers we are providing this early version of the manuscript. The manuscript will undergo copyediting, typesetting, and review of the resulting proof before it is published in its final citable form. Please note that during the production process errors may be discovered which could affect the content, and all legal disclaimers that apply to the journal pertain.
Manuscript prepared for Submission to NeuroImage special issue: MR Imaging of Brain Microstructure
References
- Aboitiz F, Scheibel AB, Fisher RS, Zaidel E. Fiber composition of the human corpus callosum. Brain Res. 1992;598:143–153. doi: 10.1016/0006-8993(92)90178-c. [DOI] [PubMed] [Google Scholar]
- Asato MR, Terwilliger R, Woo J, Luna B. White matter development in adolescence: a DTI study. Cereb Cortex. 2010;20:2122–2131. doi: 10.1093/cercor/bhp282. [DOI] [PMC free article] [PubMed] [Google Scholar]
- Assaf Y, Basser PJ. Composite hindered and restricted model of diffusion (CHARMED) MR imaging of the human brain. Neuroimage. 2005;27:48–58. doi: 10.1016/j.neuroimage.2005.03.042. [DOI] [PubMed] [Google Scholar]
- Aubert-Broche B, Fonov VS, Garcia-Lorenzo D, Mouiha A, Guizard N, Coupe P, Eskildsen SF, Collins DL. A new method for structural volume analysis of longitudinal brain MRI data and its application in studying the growth trajectories of anatomical brain structures in childhood. Neuroimage. 2013;82:393–402. doi: 10.1016/j.neuroimage.2013.05.065. [DOI] [PubMed] [Google Scholar]
- Barkovich AJ, Kjos BO, Jackson DE, Jr, Norman D. Normal maturation of the neonatal and infant brain: MR imaging at 1.5 T. Radiology. 1988;166:173–180. doi: 10.1148/radiology.166.1.3336675. [DOI] [PubMed] [Google Scholar]
- Basser PJ, Jones DK. Diffusion-tensor MRI: theory, experimental design and data analysis - a technical review. NMR in biomedicine. 2002;15:456–467. doi: 10.1002/nbm.783. [DOI] [PubMed] [Google Scholar]
- Basser PJ, Pajevic S, Pierpaoli C, Duda J, Aldroubi A. In vivo fiber tractography using DT-MRI data. Magnetic resonance in medicine : official journal of the Society of Magnetic Resonance in Medicine / Society of Magnetic Resonance in Medicine. 2000;44:625–632. doi: 10.1002/1522-2594(200010)44:4<625::aid-mrm17>3.0.co;2-o. [DOI] [PubMed] [Google Scholar]
- Bava S, Thayer R, Jacobus J, Ward M, Jernigan TL, Tapert SF. Longitudinal characterization of white matter maturation during adolescence. Brain Res. 2010;1327:38–46. doi: 10.1016/j.brainres.2010.02.066. [DOI] [PMC free article] [PubMed] [Google Scholar]
- Beaulieu C. The basis of anisotropic water diffusion in the nervous system - a technical review. NMR in biomedicine. 2002;15:435–455. doi: 10.1002/nbm.782. [DOI] [PubMed] [Google Scholar]
- Beaulieu C, Allen PS. Determinants of anisotropic water diffusion in nerves. Magnetic resonance in medicine : official journal of the Society of Magnetic Resonance in Medicine / Society of Magnetic Resonance in Medicine. 1994;31:394–400. doi: 10.1002/mrm.1910310408. [DOI] [PubMed] [Google Scholar]
- Benes FM. Myelination of cortical-hippocampal relays during late adolescence. Schizophr Bull. 1989;15:585–593. doi: 10.1093/schbul/15.4.585. [DOI] [PubMed] [Google Scholar]
- Berman S, West KL, Does MD, Yeatman JD, Mezer AA. Evaluating g-ratio weighted changes in the corpus callosum as a function of age and sex. Neuroimage. 2017 doi: 10.1016/j.neuroimage.2017.06.076. [DOI] [PMC free article] [PubMed] [Google Scholar]
- Bick J, Zhu T, Stamoulis C, Fox NA, Zeanah C, Nelson CA. Effect of early institutionalization and foster care on long-term white matter development: a randomized clinical trial. JAMA Pediatr. 2015;169:211–219. doi: 10.1001/jamapediatrics.2014.3212. [DOI] [PMC free article] [PubMed] [Google Scholar]
- Blumenfeld-Katzir T, Pasternak O, Dagan M, Assaf Y. Diffusion MRI of structural brain plasticity induced by a learning and memory task. PLoS One. 2011;6:e20678. doi: 10.1371/journal.pone.0020678. [DOI] [PMC free article] [PubMed] [Google Scholar]
- Bottomley PA, Foster TH, Argersinger RE, Pfeifer LM. A review of normal tissue hydrogen NMR relaxation times and relaxation mechanisms from 1–100 MHz: dependence on tissue type, NMR frequency, temperature, species, excision, and age. Med Phys. 1984;11:425–448. doi: 10.1118/1.595535. [DOI] [PubMed] [Google Scholar]
- Bouziane C, Caan M, Tamminga H, Schrantee A, Bottelier M, de Ruiter M, Kooij S, Reneman L. ADHD and maturation of brain white matter: A DTI study in medicdation naive children and adults. NeuroImage: Clinical. 2018;17:53–59. doi: 10.1016/j.nicl.2017.09.026. [DOI] [PMC free article] [PubMed] [Google Scholar]
- Brouwer RM, Mandl RC, Schnack HG, van Soelen IL, van Baal GC, Peper JS, Kahn RS, Boomsma DI, Hulshoff Pol HE. White matter development in early puberty: a longitudinal volumetric and diffusion tensor imaging twin study. PLoS One. 2012;7:e32316. doi: 10.1371/journal.pone.0032316. [DOI] [PMC free article] [PubMed] [Google Scholar]
- Casey BJ, Giedd JN, Thomas KM. Structural and functional brain development and its relation to cognitive development. Biological psychology. 2000;54:241–257. doi: 10.1016/s0301-0511(00)00058-2. [DOI] [PubMed] [Google Scholar]
- Chang YS, Owen JP, Pojman NJ, Thieu T, Bukshpun P, Wakahiro ML, Berman JI, Roberts TP, Nagarajan SS, Sherr EH, Mukherjee P. White Matter Changes of Neurite Density and Fiber Orientation Dispersion during Human Brain Maturation. PLoS One. 2015;10:e0123656. doi: 10.1371/journal.pone.0123656. [DOI] [PMC free article] [PubMed] [Google Scholar]
- Chiang MC, McMahon KL, de Zubicaray GI, Martin NG, Hickie I, Toga AW, Wright MJ, Thompson PM. Genetics of white matter development: a DTI study of 705 twins and their siblings aged 12 to 29. Neuroimage. 2011;54:2308–2317. doi: 10.1016/j.neuroimage.2010.10.015. [DOI] [PMC free article] [PubMed] [Google Scholar]
- Clayden JD, Jentschke S, Munoz M, Cooper JM, Chadwick MJ, Banks T, Clark CA, Vargha-Khadem F. Normative development of white matter tracts: similarities and differences in relation to age, gender, and intelligence. Cereb Cortex. 2012;22:1738–1747. doi: 10.1093/cercor/bhr243. [DOI] [PubMed] [Google Scholar]
- Colby JB, Van Horn JD, Sowell ER. Quantitative in vivo evidence for broad regional gradients in the timing of white matter maturation during adolescence. Neuroimage. 2011;54:25–31. doi: 10.1016/j.neuroimage.2010.08.014. [DOI] [PMC free article] [PubMed] [Google Scholar]
- Das SK, Wang JL, Bing L, Bhetuwal A, Yang HF. Regional Values of Diffusional Kurtosis Estimates in the Healthy Brain during Normal Aging. Clin Neuroradiol. 2016 doi: 10.1007/s00062-015-0490-z. [DOI] [PubMed] [Google Scholar]
- de Bie HM, Boersma M, Wattjes MP, Adriaanse S, Vermeulen RJ, Oostrom KJ, Huisman J, Veltman DJ, Delemarre-Van de Waal HA. Preparing children with a mock scanner training protocol results in high quality structural and functional MRI scans. European journal of pediatrics. 2010;169:1079–1085. doi: 10.1007/s00431-010-1181-z. [DOI] [PMC free article] [PubMed] [Google Scholar]
- Dean DC, 3rd, Dirks H, O'Muircheartaigh J, Walker L, Jerskey BA, Lehman K, Han M, Waskiewicz N, Deoni SC. Pediatric neuroimaging using magnetic resonance imaging during non-sedated sleep. Pediatric radiology. 2014a;44:64–72. doi: 10.1007/s00247-013-2752-8. [DOI] [PMC free article] [PubMed] [Google Scholar]
- Dean DC, 3rd, Jerskey BA, Chen K, Protas H, Thiyyagura P, Roontiva A, O'Muircheartaigh J, Dirks H, Waskiewicz N, Lehman K, Siniard AL, Turk MN, Hua X, Madsen SK, Thompson PM, Fleisher AS, Huentelman MJ, Deoni SC, Reiman EM. Brain differences in infants at differential genetic risk for late-onset Alzheimer disease: a cross-sectional imaging study. JAMA Neurol. 2014b;71:11–22. doi: 10.1001/jamaneurol.2013.4544. [DOI] [PMC free article] [PubMed] [Google Scholar]
- Dean DC, 3rd, O'Muircheartaigh J, Dirks H, Travers BG, Adluru N, Alexander AL, Deoni SC. Mapping an index of the myelin g-ratio in infants using magnetic resonance imaging. Neuroimage. 2016;132:225–237. doi: 10.1016/j.neuroimage.2016.02.040. [DOI] [PMC free article] [PubMed] [Google Scholar]
- Dean DC, 3rd, O'Muircheartaigh J, Dirks H, Waskiewicz N, Walker L, Doernberg E, Piryatinsky I, Deoni SC. Characterizing longitudinal white matter development during early childhood. Brain Struct Funct. 2015;220:1921–1933. doi: 10.1007/s00429-014-0763-3. [DOI] [PMC free article] [PubMed] [Google Scholar]
- Demerens C, Stankoff B, Logak M, Anglade P, Allinquant B, Couraud F, Zalc B, Lubetzki C. Induction of myelination in the central nervous system by electrical activity. Proc Natl Acad Sci U S A. 1996;93:9887–9892. doi: 10.1073/pnas.93.18.9887. [DOI] [PMC free article] [PubMed] [Google Scholar]
- Deoni SC, Dean DC, 3rd, O'Muircheartaigh J, Dirks H, Jerskey BA. Investigating white matter development in infancy and early childhood using myelin water fraction and relaxation time mapping. Neuroimage. 2012;63:1038–1053. doi: 10.1016/j.neuroimage.2012.07.037. [DOI] [PMC free article] [PubMed] [Google Scholar]
- Deoni SC, Dean DC, 3rd, Piryatinsky I, O'Muircheartaigh J, Waskiewicz N, Lehman K, Han M, Dirks H. Breastfeeding and early white matter development: A cross-sectional study. Neuroimage. 2013;82:77–86. doi: 10.1016/j.neuroimage.2013.05.090. [DOI] [PMC free article] [PubMed] [Google Scholar]
- Deoni SC, O'Muircheartaigh J, Elison JT, Walker L, Doernberg E, Waskiewicz N, Dirks H, Piryatinsky I, Dean DC, 3rd, Jumbe NL. White matter maturation profiles through early childhood predict general cognitive ability. Brain Struct Funct. 2014 doi: 10.1007/s00429-014-0947-x. [DOI] [PMC free article] [PubMed] [Google Scholar]
- Douet V, Chang L, Cloak C, Ernst T. Genetic influences on brain developmental trajectories on neuroimaging studies: from infancy to young adulthood. Brain imaging and behavior. 2014;8:234–250. doi: 10.1007/s11682-013-9260-1. [DOI] [PMC free article] [PubMed] [Google Scholar]
- Dubois J, Dehaene-Lambertz G, Kulikova S, Poupon C, Huppi PS, Hertz-Pannier L. The early development of brain white matter: a review of imaging studies in fetuses, newborns and infants. Neuroscience. 2014;276:48–71. doi: 10.1016/j.neuroscience.2013.12.044. [DOI] [PubMed] [Google Scholar]
- Dubois J, Dehaene-Lambertz G, Soares C, Cointepas Y, Le Bihan D, Hertz-Pannier L. Microstructural correlates of infant functional development: example of the visual pathways. J Neurosci. 2008;28:1943–1948. doi: 10.1523/JNEUROSCI.5145-07.2008. [DOI] [PMC free article] [PubMed] [Google Scholar]
- Edgar JM, Garbern J. The myelinated axon is dependent on the myelinating cell for support and maintenance: molecules involved. J Neurosci Res. 2004;76:593–598. doi: 10.1002/jnr.20063. [DOI] [PubMed] [Google Scholar]
- Eluvathingal TJ, Hasan KM, Kramer L, Fletcher JM, Ewing-Cobbs L. Quantitative diffusion tensor tractography of association and projection fibers in normally developing children and adolescents. Cereb Cortex. 2007;17:2760–2768. doi: 10.1093/cercor/bhm003. [DOI] [PMC free article] [PubMed] [Google Scholar]
- Engelbrecht V, Rassek M, Preiss S, Wald C, Modder U. Age-dependent changes in magnetization transfer contrast of white matter in the pediatric brain. AJNR Am J Neuroradiol. 1998;19:1923–1929. [PMC free article] [PubMed] [Google Scholar]
- Falangola MF, Jensen JH, Babb JS, Hu C, Castellanos FX, Di Martino A, Ferris SH, Helpern JA. Age-related non-Gaussian diffusion patterns in the prefrontal brain. Journal of magnetic resonance imaging : JMRI. 2008;28:1345–1350. doi: 10.1002/jmri.21604. [DOI] [PMC free article] [PubMed] [Google Scholar]
- Fields RD. White matter in learning, cognition and psychiatric disorders. Trends Neurosci. 2008;31:361–370. doi: 10.1016/j.tins.2008.04.001. [DOI] [PMC free article] [PubMed] [Google Scholar]
- Fields RD. Neuroscience. Change in the brain's white matter. Science. 2010;330:768–769. doi: 10.1126/science.1199139. [DOI] [PMC free article] [PubMed] [Google Scholar]
- Fields RD. A new mechanism of nervous system plasticity: activity-dependent myelination. Nat Rev Neurosci. 2015;16:756–767. doi: 10.1038/nrn4023. [DOI] [PMC free article] [PubMed] [Google Scholar]
- Fieremans E, Jensen JH, Helpern JA. White matter characterization with diffusional kurtosis imaging. Neuroimage. 2011;58:177–188. doi: 10.1016/j.neuroimage.2011.06.006. [DOI] [PMC free article] [PubMed] [Google Scholar]
- Fjell AM, Walhovd KB, Westlye LT, Ostby Y, Tamnes CK, Jernigan TL, Gamst A, Dale AM. When does brain aging accelerate? Dangers of quadratic fits in cross-sectional studies. Neuroimage. 2010;50:1376–1383. doi: 10.1016/j.neuroimage.2010.01.061. [DOI] [PubMed] [Google Scholar]
- Fornari E, Knyazeva MG, Meuli R, Maeder P. Myelination shapes functional activity in the developing brain. Neuroimage. 2007;38:511–518. doi: 10.1016/j.neuroimage.2007.07.010. [DOI] [PubMed] [Google Scholar]
- Gelman N, Ewing JR, Gorell JM, Spickler EM, Solomon EG. Interregional variation of longitudinal relaxation rates in human brain at 3.0 T: relation to estimated iron and water contents. Magnetic resonance in medicine : official journal of the Society of Magnetic Resonance in Medicine / Society of Magnetic Resonance in Medicine. 2001;45:71–79. doi: 10.1002/1522-2594(200101)45:1<71::aid-mrm1011>3.0.co;2-2. [DOI] [PubMed] [Google Scholar]
- Genc S, Malpas CB, Holland SK, Beare R, Silk TJ. Neurite density index is sensitive to age related differences in the developing brain. Neuroimage. 2017a;148:373–380. doi: 10.1016/j.neuroimage.2017.01.023. [DOI] [PubMed] [Google Scholar]
- Genc S, Seal ML, Dhollander T, Malpas CB, Hazell P, Silk TJ. White matter alterations at pubertal onset. Neuroimage. 2017b;156:286–292. doi: 10.1016/j.neuroimage.2017.05.017. [DOI] [PubMed] [Google Scholar]
- Geng X, Prom-Wormley EC, Perez J, Kubarych T, Styner M, Lin W, Neale MC, Gilmore JH. White matter heritability using diffusion tensor imaging in neonatal brains. Twin Res Hum Genet. 2012;15:336–350. doi: 10.1017/thg.2012.14. [DOI] [PMC free article] [PubMed] [Google Scholar]
- Giedd JN, Blumenthal J, Jeffries NO, Castellanos FX, Liu H, Zijdenbos A, Paus T, Evans AC, Rapoport JL. Brain development during childhood and adolescence: a longitudinal MRI study. Nat Neurosci. 1999;2:861–863. doi: 10.1038/13158. [DOI] [PubMed] [Google Scholar]
- Giedd JN, Lenroot RK, Shaw P, Lalonde F, Celano M, White S, Tossell J, Addington A, Gogtay N. Trajectories of anatomic brain development as a phenotype. Novartis Foundation symposium. 2008;289:101–112. doi: 10.1002/9780470751251.ch9. discussion 112-108, 193-105. [DOI] [PMC free article] [PubMed] [Google Scholar]
- Giedd JN, Rapoport JL. Structural MRI of pediatric brain development: what have we learned and where are we going? Neuron. 2010;67:728–734. doi: 10.1016/j.neuron.2010.08.040. [DOI] [PMC free article] [PubMed] [Google Scholar]
- Giorgio A, Watkins KE, Chadwick M, James S, Winmill L, Douaud G, De Stefano N, Matthews PM, Smith SM, Johansen-Berg H, James AC. Longitudinal changes in grey and white matter during adolescence. Neuroimage. 2010;49:94–103. doi: 10.1016/j.neuroimage.2009.08.003. [DOI] [PubMed] [Google Scholar]
- Giorgio A, Watkins KE, Douaud G, James AC, James S, De Stefano N, Matthews PM, Smith SM, Johansen-Berg H. Changes in white matter microstructure during adolescence. Neuroimage. 2008;39:52–61. doi: 10.1016/j.neuroimage.2007.07.043. [DOI] [PubMed] [Google Scholar]
- Glasser MF, Van Essen DC. Mapping human cortical areas in vivo based on myelin content as revealed by T1- and T2-weighted MRI. J Neurosci. 2011;31:11597–11616. doi: 10.1523/JNEUROSCI.2180-11.2011. [DOI] [PMC free article] [PubMed] [Google Scholar]
- Gogtay N, Giedd JN, Lusk L, Hayashi KM, Greenstein D, Vaituzis AC, Nugent TF, 3rd, Herman DH, Clasen LS, Toga AW, Rapoport JL, Thompson PM. Dynamic mapping of human cortical development during childhood through early adulthood. Proceedings of the National Academy of Sciences of the United States of America. 2004;101:8174–8179. doi: 10.1073/pnas.0402680101. [DOI] [PMC free article] [PubMed] [Google Scholar]
- Groeschel S, Vollmer B, King MD, Connelly A. Developmental changes in cerebral grey and white matter volume from infancy to adulthood. Int J Dev Neurosci. 2010;28:481–489. doi: 10.1016/j.ijdevneu.2010.06.004. [DOI] [PubMed] [Google Scholar]
- Hallowell LM, Stewart SE, de Amorim ESCT, Ditchfield MR. Reviewing the process of preparing children for MRI. Pediatric radiology. 2008;38:271–279. doi: 10.1007/s00247-007-0704-x. [DOI] [PubMed] [Google Scholar]
- Harned RK, 2nd, Strain JD. MRI-compatible audio/visual system: impact on pediatric sedation. Pediatric radiology. 2001;31:247–250. doi: 10.1007/s002470100426. [DOI] [PubMed] [Google Scholar]
- Hartman JH, Bena J, McIntyre S, Albert NM. Does a photo diary decrease stress and anxiety in children undergoing magnetic resonance imaging? A randomized, controlled study. Journal of radiology nursing. 2009;28:122–128. [Google Scholar]
- Hasan KM, Iftikhar A, Kamali A, Kramer LA, Ashtari M, Cirino PT, Papanicolaou AC, Fletcher JM, Ewing-Cobbs L. Development and aging of the healthy human brain uncinate fasciculus across the lifespan using diffusion tensor tractography. Brain Res. 2009a;1276:67–76. doi: 10.1016/j.brainres.2009.04.025. [DOI] [PMC free article] [PubMed] [Google Scholar]
- Hasan KM, Kamali A, Iftikhar A, Kramer LA, Papanicolaou AC, Fletcher JM, Ewing-Cobbs L. Diffusion tensor tractography quantification of the human corpus callosum fiber pathways across the lifespan. Brain Res. 2009b;1249:91–100. doi: 10.1016/j.brainres.2008.10.026. [DOI] [PMC free article] [PubMed] [Google Scholar]
- Hasan KM, Kamali A, Kramer LA, Papnicolaou AC, Fletcher JM, Ewing-Cobbs L. Diffusion tensor quantification of the human midsagittal corpus callosum subdivisions across the lifespan. Brain Res. 2008;1227:52–67. doi: 10.1016/j.brainres.2008.06.030. [DOI] [PMC free article] [PubMed] [Google Scholar]
- Henkelman RM, Stanisz GJ, Graham SJ. Magnetization transfer in MRI: a review. NMR in biomedicine. 2001;14:57–64. doi: 10.1002/nbm.683. [DOI] [PubMed] [Google Scholar]
- Hermoye L, Saint-Martin C, Cosnard G, Lee SK, Kim J, Nassogne MC, Menten R, Clapuyt P, Donohue PK, Hua K, Wakana S, Jiang H, van Zijl PC, Mori S. Pediatric diffusion tensor imaging: normal database and observation of the white matter maturation in early childhood. Neuroimage. 2006;29:493–504. doi: 10.1016/j.neuroimage.2005.08.017. [DOI] [PubMed] [Google Scholar]
- Herting MM, Maxwell EC, Irvine C, Nagel BJ. The impact of sex, puberty, and hormones on white matter microstructure in adolescents. Cereb Cortex. 2012;22:1979–1992. doi: 10.1093/cercor/bhr246. [DOI] [PMC free article] [PubMed] [Google Scholar]
- Huang H, Xue R, Zhang J, Ren T, Richards LJ, Yarowsky P, Miller MI, Mori S. Anatomical characterization of human fetal brain development with diffusion tensor magnetic resonance imaging. J Neurosci. 2009;29:4263–4273. doi: 10.1523/JNEUROSCI.2769-08.2009. [DOI] [PMC free article] [PubMed] [Google Scholar]
- Ishibashi T, Dakin KA, Stevens B, Lee PR, Kozlov SV, Stewart CL, Fields RD. Astrocytes promote myelination in response to electrical impulses. Neuron. 2006;49:823–832. doi: 10.1016/j.neuron.2006.02.006. [DOI] [PMC free article] [PubMed] [Google Scholar]
- Jahanshad N, Kochunov PV, Sprooten E, Mandl RC, Nichols TE, Almasy L, Blangero J, Brouwer RM, Curran JE, de Zubicaray GI, Duggirala R, Fox PT, Hong LE, Landman BA, Martin NG, McMahon KL, Medland SE, Mitchell BD, Olvera RL, Peterson CP, Starr JM, Sussmann JE, Toga AW, Wardlaw JM, Wright MJ, Hulshoff Pol HE, Bastin ME, McIntosh AM, Deary IJ, Thompson PM, Glahn DC. Multi-site genetic analysis of diffusion images and voxelwise heritability analysis: a pilot project of the ENIGMA-DTI working group. Neuroimage. 2013;81:455–469. doi: 10.1016/j.neuroimage.2013.04.061. [DOI] [PMC free article] [PubMed] [Google Scholar]
- Jakovcevski I, Filipovic R, Mo Z, Rakic S, Zecevic N. Oligodendrocyte development and the onset of myelination in the human fetal brain. Frontiers in neuroanatomy. 2009;3:5. doi: 10.3389/neuro.05.005.2009. [DOI] [PMC free article] [PubMed] [Google Scholar]
- Jelescu IO, Veraart J, Adisetiyo V, Milla SS, Novikov DS, Fieremans E. One diffusion acquisition and different white matter models: how does microstructure change in human early development based on WMTI and NODDI? Neuroimage. 2015;107:242–256. doi: 10.1016/j.neuroimage.2014.12.009. [DOI] [PMC free article] [PubMed] [Google Scholar]
- Jensen JH, Helpern JA, Ramani A, Lu H, Kaczynski K. Diffusional kurtosis imaging: the quantification of non-gaussian water diffusion by means of magnetic resonance imaging. Magnetic resonance in medicine : official journal of the Society of Magnetic Resonance in Medicine / Society of Magnetic Resonance in Medicine. 2005;53:1432–1440. doi: 10.1002/mrm.20508. [DOI] [PubMed] [Google Scholar]
- Jeurissen B, Leemans A, Tournier JD, Jones DK, Sijbers J. Investigating the prevalence of complex fiber configurations in white matter tissue with diffusion magnetic resonance imaging. Hum Brain Mapp. 2013;34:2747–2766. doi: 10.1002/hbm.22099. [DOI] [PMC free article] [PubMed] [Google Scholar]
- Jovanov-Milosevic N, Benjak V, Kostovic I. Transient cellular structures in developing corpus callosum of the human brain. Coll Antropol. 2006;30:375–381. [PubMed] [Google Scholar]
- Keller TA, Just MA. Altering cortical connectivity: remediation-induced changes in the white matter of poor readers. Neuron. 2009;64:624–631. doi: 10.1016/j.neuron.2009.10.018. [DOI] [PMC free article] [PubMed] [Google Scholar]
- Keunen K, Counsell SJ, Benders M. The emergence of functional architecture during early brain development. Neuroimage. 2017;160:2–14. doi: 10.1016/j.neuroimage.2017.01.047. [DOI] [PubMed] [Google Scholar]
- Koenis MM, Brouwer RM, van den Heuvel MP, Mandl RC, van Soelen IL, Kahn RS, Boomsma DI, Hulshoff Pol HE. Development of the brain's structural network efficiency in early adolescence: A longitudinal DTI twin study. Hum Brain Mapp. 2015;36:4938–4953. doi: 10.1002/hbm.22988. [DOI] [PMC free article] [PubMed] [Google Scholar]
- Kohannim O, Jahanshad N, Braskie MN, Stein JL, Chiang MC, Reese AH, Hibar DP, Toga AW, McMahon KL, de Zubicaray GI, Medland SE, Montgomery GW, Martin NG, Wright MJ, Thompson PM. Predicting white matter integrity from multiple common genetic variants. Neuropsychopharmacology : official publication of the American College of Neuropsychopharmacology. 2012;37:2012–2019. doi: 10.1038/npp.2012.49. [DOI] [PMC free article] [PubMed] [Google Scholar]
- Krogsrud SK, Fjell AM, Tamnes CK, Grydeland H, Mork L, Due-Tonnessen P, Bjornerud A, Sampaio-Baptista C, Andersson J, Johansen-Berg H, Walhovd KB. Changes in white matter microstructure in the developing brain--A longitudinal diffusion tensor imaging study of children from 4 to 11years of age. Neuroimage. 2016;124:473–486. doi: 10.1016/j.neuroimage.2015.09.017. [DOI] [PMC free article] [PubMed] [Google Scholar]
- Kulikova S, Hertz-Pannier L, Dehaene-Lambertz G, Buzmakov A, Poupon C, Dubois J. Multi-parametric evaluation of the white matter maturation. Brain Struct Funct. 2015;220:3657–3672. doi: 10.1007/s00429-014-0881-y. [DOI] [PMC free article] [PubMed] [Google Scholar]
- Laule C, Kozlowski P, Leung E, Li DK, Mackay AL, Moore GR. Myelin water imaging of multiple sclerosis at 7 T: correlations with histopathology. Neuroimage. 2008;40:1575–1580. doi: 10.1016/j.neuroimage.2007.12.008. [DOI] [PubMed] [Google Scholar]
- Laule C, Leung E, Lis DK, Traboulsee AL, Paty DW, MacKay AL, Moore GR. Myelin water imaging in multiple sclerosis: quantitative correlations with histopathology. Mult Scler. 2006;12:747–753. doi: 10.1177/1352458506070928. [DOI] [PubMed] [Google Scholar]
- Lebel C, Beaulieu C. Longitudinal development of human brain wiring continues from childhood into adulthood. J Neurosci. 2011;31:10937–10947. doi: 10.1523/JNEUROSCI.5302-10.2011. [DOI] [PMC free article] [PubMed] [Google Scholar]
- Lebel C, Caverhill-Godkewitsch S, Beaulieu C. Age-related regional variations of the corpus callosum identified by diffusion tensor tractography. Neuroimage. 2010;52:20–31. doi: 10.1016/j.neuroimage.2010.03.072. [DOI] [PubMed] [Google Scholar]
- Lebel C, Gee M, Camicioli R, Wieler M, Martin W, Beaulieu C. Diffusion tensor imaging of white matter tract evolution over the lifespan. Neuroimage. 2012;60:340–352. doi: 10.1016/j.neuroimage.2011.11.094. [DOI] [PubMed] [Google Scholar]
- Lebel C, Treit S, Beaulieu C. Diffusion MRI of typical white matter development from childhood to adulthood. NMR in biomedicine. 2017 doi: 10.1002/nbm.3778. in press. [DOI] [PubMed] [Google Scholar]
- Lebel C, Walker L, Leemans A, Phillips L, Beaulieu C. Microstructural maturation of the human brain from childhood to adulthood. Neuroimage. 2008;40:1044–1055. doi: 10.1016/j.neuroimage.2007.12.053. [DOI] [PubMed] [Google Scholar]
- Lebel C, Walton M, Letourneau N, Giesbrecht GF, Kaplan BJ, Dewey D. Prepartum and Postpartum Maternal Depressive Symptoms Are Related to Children's Brain Structure in Preschool. Biol Psychiatry. 2016;80:859–868. doi: 10.1016/j.biopsych.2015.12.004. [DOI] [PubMed] [Google Scholar]
- Lee SJ, Steiner RJ, Luo S, Neale MC, Styner M, Zhu H, Gilmore JH. Quantitative tract-based white matter heritability in twin neonates. Neuroimage. 2015;111:123–135. doi: 10.1016/j.neuroimage.2015.02.021. [DOI] [PMC free article] [PubMed] [Google Scholar]
- Lenroot RK, Gogtay N, Greenstein DK, Wells EM, Wallace GL, Clasen LS, Blumenthal JD, Lerch J, Zijdenbos AP, Evans AC, Thompson PM, Giedd JN. Sexual dimorphism of brain developmental trajectories during childhood and adolescence. Neuroimage. 2007;36:1065–1073. doi: 10.1016/j.neuroimage.2007.03.053. [DOI] [PMC free article] [PubMed] [Google Scholar]
- Leppert IR, Almli CR, McKinstry RC, Mulkern RV, Pierpaoli C, Rivkin MJ, Pike GB. T(2) relaxometry of normal pediatric brain development. Journal of magnetic resonance imaging : JMRI. 2009;29:258–267. doi: 10.1002/jmri.21646. [DOI] [PMC free article] [PubMed] [Google Scholar]
- Luna B, Garver KE, Urban TA, Lazar NA, Sweeney JA. Maturation of cognitive processes from late childhood to adulthood. Child development. 2004;75:1357–1372. doi: 10.1111/j.1467-8624.2004.00745.x. [DOI] [PubMed] [Google Scholar]
- MacKay A, Laule C, Vavasour I, Bjarnason T, Kolind S, Madler B. Insights into brain microstructure from the T2 distribution. Magnetic resonance imaging. 2006;24:515–525. doi: 10.1016/j.mri.2005.12.037. [DOI] [PubMed] [Google Scholar]
- Mah A, Geeraert BL, Lebel C. Detailing neuroanatomical development in late childhood and early adolescence using NODDI. PLoS One. 2017;12:e0182340. doi: 10.1371/journal.pone.0182340. [DOI] [PMC free article] [PubMed] [Google Scholar]
- Makropoulos A, Aljabar P, Wright R, Huning B, Merchant N, Arichi T, Tusor N, Hajnal JV, Edwards AD, Counsell SJ, Rueckert D. Regional growth and atlasing of the developing human brain. Neuroimage. 2016;125:456–478. doi: 10.1016/j.neuroimage.2015.10.047. [DOI] [PMC free article] [PubMed] [Google Scholar]
- Manning AP, Chang KL, MacKay AL, Michal CA. The physical mechanism of "inhomogeneous" magnetization transfer MRI. J Magn Reson. 2017;274:125–136. doi: 10.1016/j.jmr.2016.11.013. [DOI] [PubMed] [Google Scholar]
- Menzies L, Goddings AL, Whitaker KJ, Blakemore SJ, Viner RM. The effects of puberty on white matter development in boys. Dev Cogn Neurosci. 2015;11:116–128. doi: 10.1016/j.dcn.2014.10.002. [DOI] [PMC free article] [PubMed] [Google Scholar]
- Mills KL, Goddings AL, Herting MM, Meuwese R, Blakemore SJ, Crone EA, Dahl RE, Guroglu B, Raznahan A, Sowell ER, Tamnes CK. Structural brain development between childhood and adulthood: Convergence across four longitudinal samples. Neuroimage. 2016;141:273–281. doi: 10.1016/j.neuroimage.2016.07.044. [DOI] [PMC free article] [PubMed] [Google Scholar]
- Miot-Noirault E, Barantin L, Akoka S, Le Pape A. T2 relaxation time as a marker of brain myelination: experimental MR study in two neonatal animal models. J Neurosci Methods. 1997;72:5–14. doi: 10.1016/s0165-0270(96)00148-3. [DOI] [PubMed] [Google Scholar]
- Mohammadi S, Carey D, Dick F, Diedrichsen J, Sereno MI, Reisert M, Callaghan MF, Weiskopf N. Whole-Brain In-vivo Measurements of the Axonal G-Ratio in a Group of 37 Healthy Volunteers. Front Neurosci. 2015;9:441. doi: 10.3389/fnins.2015.00441. [DOI] [PMC free article] [PubMed] [Google Scholar]
- Mori S, Crain BJ, Chacko VP, van Zijl PC. Three-dimensional tracking of axonal projections in the brain by magnetic resonance imaging. Annals of Neurology. 1999;45:265–269. doi: 10.1002/1531-8249(199902)45:2<265::aid-ana21>3.0.co;2-3. [DOI] [PubMed] [Google Scholar]
- Moura LM, Kempton M, Barker G, Salum G, Gadelha A, Pan PM, Hoexter M, Del Aquilla MA, Picon FA, Anes M, Otaduy MC, Amaro E, Jr, Rohde LA, McGuire P, Bressan RA, Sato JR, Jackowski AP. Age-effects in white matter using associated diffusion tensor imaging and magnetization transfer ratio during late childhood and early adolescence. Magnetic resonance imaging. 2016;34:529–534. doi: 10.1016/j.mri.2015.12.021. [DOI] [PubMed] [Google Scholar]
- Muetzel RL, Collins PF, Mueller BA, A MS, Lim KO, Luciana M. The development of corpus callosum microstructure and associations with bimanual task performance in healthy adolescents. Neuroimage. 2008;39:1918–1925. doi: 10.1016/j.neuroimage.2007.10.018. [DOI] [PMC free article] [PubMed] [Google Scholar]
- Muftuler LT, Davis EP, Buss C, Solodkin A, Su MY, Head KM, Hasso AN, Sandman CA. Development of white matter pathways in typically developing preadolescent children. Brain Res. 2012;1466:33–43. doi: 10.1016/j.brainres.2012.05.035. [DOI] [PMC free article] [PubMed] [Google Scholar]
- Mukherjee P, Miller JH, Shimony JS, Conturo TE, Lee BC, Almli CR, McKinstry RC. Normal brain maturation during childhood: developmental trends characterized with diffusion-tensor MR imaging. Radiology. 2001;221:349–358. doi: 10.1148/radiol.2212001702. [DOI] [PubMed] [Google Scholar]
- Neil J, Miller J, Mukherjee P, Huppi PS. Diffusion tensor imaging of normal and injured developing human brain - a technical review. NMR in biomedicine. 2002;15:543–552. doi: 10.1002/nbm.784. [DOI] [PubMed] [Google Scholar]
- Noble KG, Korgaonkar MS, Grieve SM, Brickman AM. Higher education is an age-independent predictor of white matter integrity and cognitive control in late adolescence. Developmental science. 2013;16:653–664. doi: 10.1111/desc.12077. [DOI] [PMC free article] [PubMed] [Google Scholar]
- O'Muircheartaigh J, Dean DC, 3rd, Ginestet CE, Walker L, Waskiewicz N, Lehman K, Dirks H, Piryatinsky I, Deoni SC. White matter development and early cognition in babies and toddlers. Hum Brain Mapp. 2014;35:4475–4487. doi: 10.1002/hbm.22488. [DOI] [PMC free article] [PubMed] [Google Scholar]
- Olesen PJ, Nagy Z, Westerberg H, Klingberg T. Combined analysis of DTI and fMRI data reveals a joint maturation of white and grey matter in a fronto-parietal network. Brain Res Cogn Brain Res. 2003;18:48–57. doi: 10.1016/j.cogbrainres.2003.09.003. [DOI] [PubMed] [Google Scholar]
- Pangelinan MM, Leonard G, Perron M, Pike GB, Richer L, Veillette S, Pausova Z, Paus T. Puberty and testosterone shape the corticospinal tract during male adolescence. Brain Struct Funct. 2016;221:1083–1094. doi: 10.1007/s00429-014-0956-9. [DOI] [PubMed] [Google Scholar]
- Paydar A. Diffusional kurtosis imaging: a promising technique for detecting microstructural changes in neural development and regeneration. Neural Regen Res. 2014;9:1108–1109. doi: 10.4103/1673-5374.135309. [DOI] [PMC free article] [PubMed] [Google Scholar]
- Paydar A, Fieremans E, Nwankwo JI, Lazar M, Sheth HD, Adisetiyo V, Helpern JA, Jensen JH, Milla SS. Diffusional kurtosis imaging of the developing brain. AJNR Am J Neuroradiol. 2014;35:808–814. doi: 10.3174/ajnr.A3764. [DOI] [PMC free article] [PubMed] [Google Scholar]
- Peper JS, Schnack HG, Brouwer RM, Van Baal GC, Pjetri E, Szekely E, van Leeuwen M, van den Berg SM, Collins DL, Evans AC, Boomsma DI, Kahn RS, Hulshoff Pol HE. Heritability of regional and global brain structure at the onset of puberty: a magnetic resonance imaging study in 9-year-old twin pairs. Hum Brain Mapp. 2009;30:2184–2196. doi: 10.1002/hbm.20660. [DOI] [PMC free article] [PubMed] [Google Scholar]
- Perrin JS, Herve PY, Leonard G, Perron M, Pike GB, Pitiot A, Richer L, Veillette S, Pausova Z, Paus T. Growth of white matter in the adolescent brain: role of testosterone and androgen receptor. J Neurosci. 2008;28:9519–9524. doi: 10.1523/JNEUROSCI.1212-08.2008. [DOI] [PMC free article] [PubMed] [Google Scholar]
- Perrin JS, Leonard G, Perron M, Pike GB, Pitiot A, Richer L, Veillette S, Pausova Z, Paus T. Sex differences in the growth of white matter during adolescence. Neuroimage. 2009;45:1055–1066. doi: 10.1016/j.neuroimage.2009.01.023. [DOI] [PubMed] [Google Scholar]
- Pfefferbaum A, Mathalon DH, Sullivan EV, Rawles JM, Zipursky RB, Lim KO. A quantitative magnetic resonance imaging study of changes in brain morphology from infancy to late adulthood. Archives of neurology. 1994;51:874–887. doi: 10.1001/archneur.1994.00540210046012. [DOI] [PubMed] [Google Scholar]
- Pohl KM, Sullivan EV, Rohlfing T, Chu W, Kwon D, Nichols BN, Zhang Y, Brown SA, Tapert SF, Cummins K, Thompson WK, Brumback T, Colrain IM, Baker FC, Prouty D, De Bellis MD, Voyvodic JT, Clark DB, Schirda C, Nagel BJ, Pfefferbaum A. Harmonizing DTI measurements across scanners to examine the development of white matter microstructure in 803 adolescents of the NCANDA study. Neuroimage. 2016;130:194–213. doi: 10.1016/j.neuroimage.2016.01.061. [DOI] [PMC free article] [PubMed] [Google Scholar]
- Qiu A, Mori S, Miller MI. Diffusion tensor imaging for understanding brain development in early life. Annu Rev Psychol. 2015;66:853–876. doi: 10.1146/annurev-psych-010814-015340. [DOI] [PMC free article] [PubMed] [Google Scholar]
- Raffelt DA, Smith RE, Ridgway GR, Tournier JD, Vaughan DN, Rose S, Henderson R, Connelly A. Connectivity-based fixel enhancement: Whole-brain statistical analysis of diffusion MRI measures in the presence of crossing fibres. Neuroimage. 2015;117:40–55. doi: 10.1016/j.neuroimage.2015.05.039. [DOI] [PMC free article] [PubMed] [Google Scholar]
- Rice D, Barone S., Jr Critical periods of vulnerability for the developing nervous system: evidence from humans and animal models. Environ Health Perspect. 2000;108(Suppl 3):511–533. doi: 10.1289/ehp.00108s3511. [DOI] [PMC free article] [PubMed] [Google Scholar]
- Richards TL, Grabowski TJ, Boord P, Yagle K, Askren M, Mestre Z, Robinson P, Welker O, Gulliford D, Nagy W, Berninger V. Contrasting brain patterns of writing-related DTI parameters, fMRI connectivity, and DTI-fMRI connectivity correlations in children with and without dysgraphia or dyslexia. Neuroimage Clin. 2015;8:408–421. doi: 10.1016/j.nicl.2015.03.018. [DOI] [PMC free article] [PubMed] [Google Scholar]
- Rifkin-Graboi A, Meaney MJ, Chen H, Bai J, Hameed WB, Tint MT, Broekman BF, Chong YS, Gluckman PD, Fortier MV, Qiu A. Antenatal maternal anxiety predicts variations in neural structures implicated in anxiety disorders in newborns. J Am Acad Child Adolesc Psychiatry. 2015;54:313–321. e312. doi: 10.1016/j.jaac.2015.01.013. [DOI] [PubMed] [Google Scholar]
- Saito N, Sakai O, Ozonoff A, Jara H. Relaxo-volumetric multispectral quantitative magnetic resonance imaging of the brain over the human lifespan: global and regional aging patterns. Magnetic resonance imaging. 2009;27:895–906. doi: 10.1016/j.mri.2009.05.006. [DOI] [PubMed] [Google Scholar]
- Scherf KS, Thomas C, Doyle J, Behrmann M. Emerging structure-function relations in the developing face processing system. Cereb Cortex. 2014;24:2964–2980. doi: 10.1093/cercor/bht152. [DOI] [PMC free article] [PubMed] [Google Scholar]
- Schmierer K, Scaravilli F, Altmann DR, Barker GJ, Miller DH. Magnetization transfer ratio and myelin in postmortem multiple sclerosis brain. Ann Neurol. 2004;56:407–415. doi: 10.1002/ana.20202. [DOI] [PubMed] [Google Scholar]
- Schmierer K, Tozer DJ, Scaravilli F, Altmann DR, Barker GJ, Tofts PS, Miller DH. Quantitative magnetization transfer imaging in postmortem multiple sclerosis brain. Journal of magnetic resonance imaging : JMRI. 2007;26:41–51. doi: 10.1002/jmri.20984. [DOI] [PMC free article] [PubMed] [Google Scholar]
- Schmierer K, Wheeler-Kingshott CA, Tozer DJ, Boulby PA, Parkes HG, Yousry TA, Scaravilli F, Barker GJ, Tofts PS, Miller DH. Quantitative magnetic resonance of postmortem multiple sclerosis brain before and after fixation. Magnetic resonance in medicine : official journal of the Society of Magnetic Resonance in Medicine / Society of Magnetic Resonance in Medicine. 2008;59:268–277. doi: 10.1002/mrm.21487. [DOI] [PMC free article] [PubMed] [Google Scholar]
- Schmithorst VJ, Holland SK, Dardzinski BJ. Developmental differences in white matter architecture between boys and girls. Hum Brain Mapp. 2008;29:696–710. doi: 10.1002/hbm.20431. [DOI] [PMC free article] [PubMed] [Google Scholar]
- Schneiderman JS, Buchsbaum MS, Haznedar MM, Hazlett EA, Brickman AM, Shihabuddin L, Brand JG, Torosjan Y, Newmark RE, Tang C, Aronowitz J, Paul-Odouard R, Byne W, Hof PR. Diffusion tensor anisotropy in adolescents and adults. Neuropsychobiology. 2007;55:96–111. doi: 10.1159/000104277. [DOI] [PMC free article] [PubMed] [Google Scholar]
- Scholz J, Klein MC, Behrens TE, Johansen-Berg H. Training induces changes in white-matter architecture. Nature Neuroscience. 2009;12:1370–1371. doi: 10.1038/nn.2412. [DOI] [PMC free article] [PubMed] [Google Scholar]
- Seunarine KK, Clayden JD, Jentschke S, Munoz M, Cooper JM, Chadwick MJ, Banks T, Vargha-Khadem F, Clark CA. Sexual Dimorphism in White Matter Developmental Trajectories Using Tract-Based Spatial Statistics. Brain Connect. 2015 doi: 10.1089/brain.2015.0340. [DOI] [PMC free article] [PubMed] [Google Scholar]
- Simmonds DJ, Hallquist MN, Asato M, Luna B. Developmental stages and sex differences of white matter and behavioral development through adolescence: a longitudinal diffusion tensor imaging (DTI) study. Neuroimage. 2014;92:356–368. doi: 10.1016/j.neuroimage.2013.12.044. [DOI] [PMC free article] [PubMed] [Google Scholar]
- Song SK, Sun SW, Ju WK, Lin SJ, Cross AH, Neufeld AH. Diffusion tensor imaging detects and differentiates axon and myelin degeneration in mouse optic nerve after retinal ischemia. Neuroimage. 2003;20:1714–1722. doi: 10.1016/j.neuroimage.2003.07.005. [DOI] [PubMed] [Google Scholar]
- Song SK, Sun SW, Ramsbottom MJ, Chang C, Russell J, Cross AH. Dysmyelination revealed through MRI as increased radial (but unchanged axial) diffusion of water. Neuroimage. 2002;17:1429–1436. doi: 10.1006/nimg.2002.1267. [DOI] [PubMed] [Google Scholar]
- Song SK, Yoshino J, Le TQ, Lin SJ, Sun SW, Cross AH, Armstrong RC. Demyelination increases radial diffusivity in corpus callosum of mouse brain. Neuroimage. 2005;26:132–140. doi: 10.1016/j.neuroimage.2005.01.028. [DOI] [PubMed] [Google Scholar]
- Sowell ER, Thompson PM, Leonard CM, Welcome SE, Kan E, Toga AW. Longitudinal mapping of cortical thickness and brain growth in normal children. J Neurosci. 2004;24:8223–8231. doi: 10.1523/JNEUROSCI.1798-04.2004. [DOI] [PMC free article] [PubMed] [Google Scholar]
- Stiles J, Jernigan TL. The basics of brain development. Neuropsychol Rev. 2010;20:327–348. doi: 10.1007/s11065-010-9148-4. [DOI] [PMC free article] [PubMed] [Google Scholar]
- Takahashi E, Folkerth RD, Galaburda AM, Grant PE. Emerging cerebral connectivity in the human fetal brain: an MR tractography study. Cereb Cortex. 2012;22:455–464. doi: 10.1093/cercor/bhr126. [DOI] [PMC free article] [PubMed] [Google Scholar]
- Takahashi M, Ono J, Harada K, Maeda M, Hackney DB. Diffusional anisotropy in cranial nerves with maturation: quantitative evaluation with diffusion MR imaging in rats. Radiology. 2000;216:881–885. doi: 10.1148/radiology.216.3.r00se41881. [DOI] [PubMed] [Google Scholar]
- Taki Y, Thyreau B, Hashizume H, Sassa Y, Takeuchi H, Wu K, Kotozaki Y, Nouchi R, Asano M, Asano K, Fukuda H, Kawashima R. Linear and curvilinear correlations of brain white matter volume, fractional anisotropy, and mean diffusivity with age using voxel-based and region-of-interest analyses in 246 healthy children. Hum Brain Mapp. 2013;34:1842–1856. doi: 10.1002/hbm.22027. [DOI] [PMC free article] [PubMed] [Google Scholar]
- Tam EW, Chau V, Barkovich AJ, Ferriero DM, Miller SP, Rogers EE, Grunau RE, Synnes AR, Xu D, Foong J, Brant R, Innis SM. Early postnatal docosahexaenoic acid levels and improved preterm brain development. Pediatric research. 2016;79:723–730. doi: 10.1038/pr.2016.11. [DOI] [PMC free article] [PubMed] [Google Scholar]
- Tamnes CK, Ostby Y, Fjell AM, Westlye LT, Due-Tonnessen P, Walhovd KB. Brain maturation in adolescence and young adulthood: regional age-related changes in cortical thickness and white matter volume and microstructure. Cereb Cortex. 2010;20:534–548. doi: 10.1093/cercor/bhp118. [DOI] [PubMed] [Google Scholar]
- Tamnes CK, Roalf DR, Goddings A-L, Lebel C. Diffusion MRI of white matter microstructure development in childhood and adolescence: methods, challenges, and progress. Developmental cognitive neuroscience. 2017 doi: 10.1016/j.dcn.2017.12.002. in press. [DOI] [PMC free article] [PubMed] [Google Scholar]
- Theys C, Wouters J, Ghesquiere P. Diffusion tensor imaging and resting-state functional MRI-scanning in 5- and 6-year-old children: training protocol and motion assessment. PLoS One. 2014;9:e94019. doi: 10.1371/journal.pone.0094019. [DOI] [PMC free article] [PubMed] [Google Scholar]
- Tournier JD, Calamante F, Connelly A. Determination of the appropriate b value and number of gradient directions for high-angular-resolution diffusion-weighted imaging. NMR in biomedicine. 2013;26:1775–1786. doi: 10.1002/nbm.3017. [DOI] [PubMed] [Google Scholar]
- Treit S, Lebel C, Baugh L, Rasmussen C, Andrew G, Beaulieu C. Longitudinal MRI Reveals Altered Trajectory of Brain Development during Childhood and Adolescence in Fetal Alcohol Spectrum Disorders. The Journal of neuroscience : the official journal of the Society for Neuroscience. 2013;33:10098–10109. doi: 10.1523/JNEUROSCI.5004-12.2013. [DOI] [PMC free article] [PubMed] [Google Scholar]
- Tuch DS, Reese TG, Wiegell MR, Makris N, Belliveau JW, Wedeen VJ. High angular resolution diffusion imaging reveals intravoxel white matter fiber heterogeneity. Magnetic resonance in medicine : official journal of the Society of Magnetic Resonance in Medicine / Society of Magnetic Resonance in Medicine. 2002;48:577–582. doi: 10.1002/mrm.10268. [DOI] [PubMed] [Google Scholar]
- van Buchem MA, Steens SC, Vrooman HA, Zwinderman AH, McGowan JC, Rassek M, Engelbrecht V. Global estimation of myelination in the developing brain on the basis of magnetization transfer imaging: a preliminary study. AJNR Am J Neuroradiol. 2001;22:762–766. [PMC free article] [PubMed] [Google Scholar]
- Varma G, Duhamel G, de Bazelaire C, Alsop DC. Magnetization transfer from inhomogeneously broadened lines: a potentially specific marker for myelin. Magnetic Resonance in Medicine. 2013 doi: 10.1002/mrm.25174. submitted. [DOI] [PMC free article] [PubMed] [Google Scholar]
- Vasung L, Raguz M, Kostovic I, Takahashi E. Spatiotemporal Relationship of Brain Pathways during Human Fetal Development Using High-Angular Resolution Diffusion MR Imaging and Histology. Front Neurosci. 2017;11:348. doi: 10.3389/fnins.2017.00348. [DOI] [PMC free article] [PubMed] [Google Scholar]
- Vijayakumar N, Mills KL, Alexander-Bloch A, Tamnes CK, Whittle S. Structural brain development: a review of methodological approaches and best practices. Developmental cognitive neuroscience. 2017 doi: 10.1016/j.dcn.2017.11.008. in press. [DOI] [PMC free article] [PubMed] [Google Scholar]
- Wang Y, Adamson C, Yuan W, Altaye M, Rajagopal A, Byars AW, Holland SK. Sex differences in white matter development during adolescence: a DTI study. Brain Res. 2012;1478:1–15. doi: 10.1016/j.brainres.2012.08.038. [DOI] [PMC free article] [PubMed] [Google Scholar]
- Wedeen VJ, Hagmann P, Tseng WY, Reese TG, Weisskoff RM. Mapping complex tissue architecture with diffusion spectrum magnetic resonance imaging. Magnetic resonance in medicine : official journal of the Society of Magnetic Resonance in Medicine / Society of Magnetic Resonance in Medicine. 2005;54:1377–1386. doi: 10.1002/mrm.20642. [DOI] [PubMed] [Google Scholar]
- Westlye LT, Walhovd KB, Dale AM, Bjornerud A, Due-Tonnessen P, Engvig A, Grydeland H, Tamnes CK, Ostby Y, Fjell AM. Life-Span Changes of the Human Brain White Matter: Diffusion Tensor Imaging (DTI) and Volumetry. Cereb Cortex. 2009 doi: 10.1093/cercor/bhp280. [DOI] [PubMed] [Google Scholar]
- Yakovlev PI, Lecours A-R. The myelogenetic cycles of regional maturation of the brain. In: Minkowski A, editor. Regional development of the brain early in life. Blackwell Scientific Publications Inc.; Boston, Massachusets: 1967. pp. 3–70. [Google Scholar]
- Yeatman JD, Dougherty RF, Ben-Shachar M, Wandell BA. Development of white matter and reading skills. Proceedings of the National Academy of Sciences of the United States of America. 2012;109:E3045–3053. doi: 10.1073/pnas.1206792109. [DOI] [PMC free article] [PubMed] [Google Scholar]
- Yeatman JD, Wandell BA, Mezer AA. Lifespan maturation and degeneration of human brain white matter. Nat Commun. 2014;5:4932. doi: 10.1038/ncomms5932. [DOI] [PMC free article] [PubMed] [Google Scholar]
- Yoon U, Fahim C, Perusse D, Evans AC. Lateralized genetic and environmental influences on human brain morphology of 8-year-old twins. Neuroimage. 2010;53:1117–1125. doi: 10.1016/j.neuroimage.2010.01.007. [DOI] [PMC free article] [PubMed] [Google Scholar]
- Zatorre RJ, Fields RD, Johansen-Berg H. Plasticity in gray and white: neuroimaging changes in brain structure during learning. Nat Neurosci. 2012;15:528–536. doi: 10.1038/nn.3045. [DOI] [PMC free article] [PubMed] [Google Scholar]
- Zhang H, Kang H, Zhao X, Jiang S, Zhang Y, Zhou J, Peng Y. Amide Proton Transfer (APT) MR imaging and Magnetization Transfer (MT) MR imaging of pediatric brain development. European radiology. 2016;26:3368–3376. doi: 10.1007/s00330-015-4188-z. [DOI] [PMC free article] [PubMed] [Google Scholar]
- Zhang H, Schneider T, Wheeler-Kingshott CA, Alexander DC. NODDI: practical in vivo neurite orientation dispersion and density imaging of the human brain. Neuroimage. 2012;61:1000–1016. doi: 10.1016/j.neuroimage.2012.03.072. [DOI] [PubMed] [Google Scholar]
- Zhou J, Payen JF, Wilson DA, Traystman RJ, van Zijl PC. Using the amide proton signals of intracellular proteins and peptides to detect pH effects in MRI. Nat Med. 2003;9:1085–1090. doi: 10.1038/nm907. [DOI] [PubMed] [Google Scholar]
- Zhou Y, Liu J, Driesen N, Womer F, Chen K, Wang Y, Jiang X, Zhou Q, Bai C, Wang D, Tang Y, Wang F. White Matter Integrity in Genetic High-Risk Individuals and First-Episode Schizophrenia Patients: Similarities and Disassociations. Biomed Res Int. 2017;2017:3107845. doi: 10.1155/2017/3107845. [DOI] [PMC free article] [PubMed] [Google Scholar]