

Abstract
After decades of molecular phylogenetic studies, the deep phylogeny of gymnosperms has not been resolved, and the phylogenetic placement of Gnetales remains one of the most controversial issues in seed plant evolution. To resolve the deep phylogeny of seed plants and to address the sources of phylogenetic conflict, we conducted a phylotranscriptomic study with a sampling of all 13 families of gymnosperms and main lineages of angiosperms. Multiple datasets containing up to 1 296 042 sites across 1308 loci were analysed, using concatenation and coalescence approaches. Our study generated a consistent and well-resolved phylogeny of seed plants, which places Gnetales as sister to Pinaceae and thus supports the Gnepine hypothesis. Cycads plus Ginkgo is sister to the remaining gymnosperms. We also found that Gnetales and angiosperms have similar molecular evolutionary rates, which are much higher than those of other gymnosperms. This implies that Gnetales and angiosperms might have experienced similar selective pressures in evolutionary histories. Convergent molecular evolution or homoplasy is partially responsible for the phylogenetic conflicts in seed plants. Our study provides a robustly reconstructed backbone phylogeny that is important for future molecular and morphological studies of seed plants, in particular gymnosperms, in the light of evolution.
Keywords: seed plants, gymnosperms, Gnepine hypothesis, phylotranscriptomics, phylogeny, homoplasy
1. Introduction
Extant seed plants include more than 300 000 species from five main lineages, four of which belong to gymnosperms: Cycadales, Ginkgoales, Coniferales and Gnetales. Despite comprising only approximately 1000 species (less than 0.4% of the angiosperm species), gymnosperms account for more than 39% of the world's forest area [1,2], with an important economic and ecological value. Numerous attempts have been made to resolve phylogenetic relationships among the five seed plant lineages using morphological characters and molecular data, but without consensus, especially as regards the relationship of the Gnetales. The placement of the Gnetales and ramifications for angiosperm evolution remains one of the most controversial issues in seed plant phylogeny [1,3].
The Gnetales includes three morphologically isolated genera (Ephedra, Gnetum and Welwitschia) that show some morphological characters similar to angiosperms, like net-veined leaves in Gnetum, vessels and reproductive organs made up of flower-like structures [4], and exhibit unusually high substitution rates in all three genomes [5–8]. Early morphological studies inferred that Gnetales is sister to angiosperms, supporting the long-held anthophyte hypothesis. However, the morphological, anatomical and reproductive characters used to support the anthophyte hypothesis were subsequently proved to be non-homologous or caused by parallel evolution (reviewed in [1]).
Although generally the anthophyte hypothesis has not been supported by molecular evidence, different datasets or analytical approaches have yielded five alternative conflicting hypotheses (electronic supplementary material, figure S1), including the Gnetales–other seed plant hypothesis, the Gnetales–other gymnosperm hypothesis, the Gnetifer hypothesis, the Gnepine hypothesis and the GneCup hypothesis [1,9–11]. For example, a very recent plastid phylogenomic analysis of green plants still suggested that Gnetales is sister to non-Pinaceae conifers (the GneCup hypothesis) with strong bootstrap support [11].
Our assumption is that there is one true phylogeny for seed plants but that stochastic and systematic errors have led to the conflicting hypotheses [12]. Stochastic errors, primarily from insufficient data, could be reduced by adding more taxa and more genes [13]. In particular, now more and more genomes and transcriptomes have been sequenced, and a fast-increasing amount of data can be used to mitigate the influence of stochastic errors on phylogenetic inference. Phylogenomic and phylotranscriptomic analyses are frequently applied to resolve phylogenetic relationships at both broad and narrow taxonomic levels (ultimately, the tree of life). However, genome-level analyses for gymnosperms have been hampered by two factors. First is the availability of few genome sequences. Second is the low coverage of some transcriptomic datasets that prevents recovery of full-length transcripts, which could introduce a large amount of missing data in sequence alignment. Missing data may hinder an accurate assessment of orthology and have negative effects on phylogenetic reconstruction by decreasing the support values and significantly affecting the accuracy of species tree estimation [13].
Besides stochastic errors, systematic errors could also mislead phylogenetic inference, which might be caused by compositional heterogeneity among lineages, heterotachy or homoplastic evolution [6,14,15]. In recent years, a bottleneck for phylogenetic studies is the data analysis, especially regarding how to remove the potential causes of systematic errors, rather than to generate sequences. To mitigate the impact of systematic errors on phylogenetic reconstruction of seed plants and resolve the systematic position of Gnetales, many efforts have been made, including using different outgroup rooting, applying different phylogenetic reconstruction methods (concatenation and coalescent methods) to reduce the effects of long branches, removing fast-evolving genes/sites and excluding convergent/parallel-evolving proteins [6,16–18]. However, although the Gnepine hypothesis is favoured in most studies, support values are generally not high or other hypotheses cannot be completely rejected [3,6,11,15,16,18].
This study aims to robustly reconstruct the phylogeny of gymnosperms, to investigate the factors that may influence reconstruction of the deep phylogeny of seed plants and in particular to resolve the phylogenetic placement of Gnetales, based on phylogenomic analysis. To avoid stochastic and systematic errors, we sequenced the transcriptomes of all sampled gymnosperm species, and used OrthoFinder [19] for orthology prediction, accompanied by multiple filter procedures. A high quality of sequence alignment was finally used in the phylogenetic analysis, which strongly supports Gnetales as sister to Pinaceae (the Gnepine hypothesis). We found that significant incongruence among gene trees is mostly caused by partial convergent molecular evolution or homoplasy between Gnetales and angiosperms.
2. Material and methods
(a). Taxon sampling, transcriptome sequencing and data collection
New transcriptomic data were generated from 22 species representing all 13 families of gymnosperms. Transcriptomic data of three fern species were downloaded from NCBI, and 11 filtered protein-coding DNA and amino acid (AA) databases as well as two contig datasets of angiosperms were retrieved from Phytozome and UGA, respectively (electronic supplementary material, table S1).
Young leaves or buds were collected and stored in RNAlater solution (Life Technologies, CA, USA). Total RNAs were isolated using the RNAplant Plus Reagent (Tiangen, Beijing, China) and digested by DNase Ι (Promega, Madison, USA). For each species, approximately 5 µg of total RNAs were used to construct the cDNA library (NEBNext Ultra Directional RNA Library Prep Kit for Illumina, Illumina, San Diego, CA). Paired-end reads of 2 × 100 bp were generated using the Illumina Hi-Seq 2000 platform. Short reads were first checked with Fastqc (http://www.bioinformatics.babraham.ac.uk/projects/fastqc) and then trimmed for quality using Trimmomatic (ILLUMINACLIP:TruSeq-PE.fa:2:30:10 LEADING:3 TRAILING:3 MINLEN:20) [20]. The clean reads were de novo assembled with Trinity v. 2.0.6 [21,22] using default parameters, except the use of --min_kmer_cov = 2 to decrease graph complexity and runtimes [21]. Redundancy reduction was done for the raw assemblies, using CD-HIT [23] with a threshold of 1. After translating using TransDecoder, only one peptide (the isoform encoding the longest peptide) per putative unigene was selected with a Perl script [24].
(b). Identification and stringent filtering of orthologues
To identify orthologues for phylogenetic analysis, we used a two-step protocol to remove redundant copies and paralogues. First, we used OrthoFinder [19] to define orthogroups, which were further filtered by the following criteria: (i) each species has at least one sequence; (ii) the mean copy number of an orthogroup is less than five and (iii) the median copy number of an orthogroup is lower than two [16]. We used a probabilistic character masking with ZORRO [25] to account for alignment uncertainty. Positions with a confidence score below a threshold of five were discarded. Second, orthogroups with the remaining sequences that are longer than 100 aligned amino acids and present in all species were used to build preliminary ML trees by using RAxML v.8.2.4 [26] with GTRGAMMA and PROTGAMMAAUTO models for nucleotide and AA sequences, respectively. According to the ML tree topology of each orthogroup, some redundant copies and paralogues were removed as shown in electronic supplementary material, figure S2 [27]. When gene duplication events were inferred to have occurred before speciation, the subclade with the smaller number of taxa was pruned; when gene duplication events were inferred to have occurred after speciation, the genes with shorter sequences or longer branches were trimmed. Consequently, only one copy of each species was remained in each orthogroup.
For the obtained orthogroups, the AA sequences were aligned with MAFFT v. 7 [28], and then the nucleotide sequences were aligned according to the corresponding AA alignment using PAL2NAL v.14 [29]. ZORRO was used to filter the unreliable AA sequence alignments using the same parameters as above, and the highly variable nucleotide sites were removed based on the filtered AA sequences.
(c). Phylogenetic and coalescent analyses
For supermatrix analysis, three datasets were generated, including CDS (1st + 2nd) (1st + 2nd codon positions), CDS (coding sequences) and AA alignments. All orthogroup alignments were concatenated directly by using catfasta2phyml.pl (https://github.com/nylander/catfasta2phyml), respectively. DAMBE [30] was used to test whether substitution saturation occurred in the concatenated dataset with 1000 jackknife replicates, and the result showed that all three codon positions were not substitutionally saturated. Phylogenetic relationships were reconstructed using partitioned and unpartitioned maximum-likelihood (ML) methods and Bayesian inference (BI). The ML analyses were performed using RAxML. In the unpartitioned analyses, the GTRGAMMA and PROTGAMMAAUTO models were used for nucleotide and AA sequences, respectively. Node support was evaluated by 1000 fast bootstrap replicates. The BI analyses were conducted with MrBayes v. 3.2.6 [31]. In the unpartitioned analyses of nucleotide and AA datasets, we used the parameters nst = 6 rates = invgamma and aamodelpr = mixed, respectively. Four chains were run for 1 000 000 generations using random initial trees, and every 1000 generations were sampled. The first 20% of the samples were discarded as burn-in to confirm the stationarity. For the partitioned ML and BI analyses, two strategies were used. One was treating each gene as one partition, using the same models as the unpartitioned analyses, and the other was that the best partition schemes and models were generated by PartitionFinder v. 2.1.1 [32]. The best-fit partitioning scheme divided CDS (1st + 2nd), CDS and AA sequences into 516, 530 and 343 partitions, respectively.
We also reconstructed gene trees for each orthogroup. The parameters for ML analysis are similar to those used in the above supermatrix analyses, except that the bootstrap replicates were set to 100. The gene trees were rooted using Newick Utilities v. 1.7.0 [33]. Coalescent-based analyses were conducted with ASTRAL, and the support values were calculated by the multi-locus bootstrapping procedure [34].
As constrained ML searches to optimize site-likelihood scores could be an effective way to find a real species tree [35], we used CONSEL to test alternative tree topologies with default settings [36]. All constrained searches were conducted in RAxML. Probability values (p-values) of approximately unbiased (AU) test, Shimodaira–Hasegawa (SH) and weighted Shimodaira–Hasegawa (WSH) tests were calculated. The different phylogenetic placements of three groups, namely Gnetales (sister to angiosperms, conifers, Conifer II, other gymnosperms, Pinaceae or other seed plants), Ginkgo (sister to cycads or conifers + Gnetales) and Sciadopityaceae (sister to Cupressaceae + Cephalotaxaceae + Taxaceae, other Conifer II or Araucariaceae + Podocarpaceae), were compared, respectively.
(d). Compositional heterogeneity, heterotachy and convergent/homoplastic evolution tests
BaCoCa v. 1.1.r [37] was used to assess base compositional heterogeneity in each gene by estimating the relative composition frequency variability (RCFV) value. Pairwise ML distances of the 35 sampled seed plant species were calculated for each orthogroup and the concatenated CDS sequences using RAxML with Ceratopteris gametophytes as the outgroup. The heterotachy between Gnetales and Pinaceae (HBGP) was defined as the mean substitution rate of Gnetales minus the mean substitution rate of Pinaceae. To detect signatures of convergent/homoplastic molecular evolution between Gnetales and other seed plant lineages, the site-wise log-likelihood support (SSLS) was calculated with RAxML for each orthogroup and the concatenated supermatrix under different hypotheses, including (A) Anthophyte, (B) Gnetifer, (C) GneCup, (D) Gnepine, (E) Gnetales–other gymnosperms and (F) Gnetales–other seed plants. Considering that the Gnepine topology is highly supported by this study (see Results), this topology was set as the null model (H0, the species tree). ΔSSLS for the ith site was estimated to be the difference between the log-likelihood values of the ith site under H0 and Ha (the alternative tree). The mean ΔSSLS of all sites in a locus was used to measure the strength of support for convergence/homoplasy [38]. In addition, another two analyses were conducted to test whether convergent/homoplastic molecular evolution occurred between Gnetales and angiosperms and affected the phylogenetic placement of Gnetales in particular. One was the removal of all angiosperm taxa from each orthogroup and seeing whether the placement of Gnetales in the trees generated from the various subsets of genes would change. The other was the removal of the sites supporting the Anthophyte hypothesis and seeing whether more gene trees would support the Gnepine hypothesis.
(e). Molecular dating and absolute evolutionary rate estimation
The concatenated CDS (1st + 2nd) dataset was used for divergence time estimation, which was performed with MCMCTree in the PAML v. 4.9a package [39], under a relaxed molecular clock. The BASEML in PAML was used to estimate the neutral substitution rate among species, and then MCMCTree was used to calculate the gradient vector (G) and Hessian matrix (H). The time unit was set to 100 Myr. Fourteen widely recognized fossil records were used (electronic supplementary material, table S2). Based on the substitution rate (0.049) generated from the BASEML analysis and the divergence time of seed plants (approx. 318 Ma), priors for the parameters rgene and sigma2 in MCMCTree were set as G (1, 20) and G (1, 3.18), respectively. Two independent MCMC chains were analysed, each for 10 000 000 generations with the sample frequency of 50 and a burn-in phase of 1 000 000 generations. The stability of the run was verified using Tracer v. 1.6 (http://tree.bio.ed.ac.uk/software/tracer/) to ensure the effective sample size greater than 200. The branch length, representing the number of substitutions per synonymous site (dS) or the number of substitutions per non-synonymous site (dN), and GC content were calculated using CODEML. The absolute rates of synonymous substitutions (RS) and non-synonymous substitutions (RN) per branch of the concatenated CDS sequences were calculated with the formulae described by Parkinson et al. [40].
3. Results
(a). Data processing and phylogenetic analyses
A total of 38 species samples were used to infer the phylogeny of seed plants. A summary of the assembly statistics is shown in electronic supplementary material, table S1. Protein sequences from these samples were clustered into 46 198 gene families after excluding orthogroups with only one sequence. After stringent filtering, 1308 orthogroups, which include all sampled species with nucleotide alignment length ranging from 300 to 3 483 bp, were used in the following analyses. The concatenated nucleotide supermatrix has 1 296 042 aligned sites and 722 847 no-gap characters. The alignments of CDS, CDS (1st + 2nd) and AA have 881 125, 460 592 and 281 963 variable sites and 777 882, 364 363 and 228 339 parsimony-informative sites, respectively.
The phylogenies reconstructed by partitioned and unpartitioned supermatrix- and coalescent-based methods are topologically identical. All nodes, except one, are supported by a bootstrap value of 100% in the ML tree generated from the partitioned concatenated CDS (1st + 2nd) sequences (figure 1). In the phylogenetic trees reconstructed from CDS and AA sequences using the supermatrix method and all trees generated by the coalescent-based method, all but very few nodes are also supported by bootstrap values of 100% (electronic supplementary material, figure S3). Gymnosperms and angiosperms formed two sister clades. In the angiosperm clade, Amborella has a basal position, followed by Nuphar. Four monocot species grouped together, and Liriodendron is sister to the six dicots. In the gymnosperm clade, cycads and Ginkgo formed a clade sister to the other gymnosperms. Gnetales was resolved as sister to Pinaceae, and the two groups formed a clade sister to Conifer II, in which Araucariaceae and Podocarpaceae formed a clade with a basal position, followed by Sciadopityaceae, and Cupressaceae is sister to Cephalotaxaceae plus Taxaceae (figure 1). The tree topology confidence test indicates that the hypotheses of Cycadales sister to Ginkgo, Sciadopityaceae sister to Cephalotaxaceae + Cupressaceae + Taxaceae and Gnetales sister to Pinaceae are significantly better than other hypothesized topologies for all three concatenated datasets (electronic supplementary material, table S3).
Figure 1.

Evolutionary relationships of seed plants inferred from the concatenated alignment of the first- and second-codon positions of 1308 orthogroups using the partitioned maximum-likelihood method in RAxML, with each gene treated as one partition. The asterisks show nodes supported by a bootstrap value of 100%.
The single-gene trees generated from the 1308 orthogroups showed different topologies. Based on the phylogenetic placement of Gnetales in the trees, we divided these orthogroups into seven categories: Anthophyte, Gnetifer, GneCup, Gnepine, Gnetales–other gymnosperms, Gnetales–other seed plants and Ambiguous (phylogenetic position of Gnetales is uncertain). The Gnepine hypothesis is supported by 46.3% CDS (1st + 2nd), 52.4% CDS and 40.3% AA trees, respectively (figure 2). None of the other hypotheses is supported by more than 10% orthogroups, except that the Gnetales–other gymnosperms hypothesis is supported by approximately 11.4–22.4% orthogroups. When orthogroups of each category were concatenated, separately, for phylogenetic analysis, the generated trees still support the hypotheses as shown in the single-gene trees, except that the Ambiguous category supports the Gnepine hypothesis (electronic supplementary material, figure S4). Interestingly, genes in the Anthophyte and Ambiguous categories are much shorter and have fewer parsimony-informative sites. In addition, a lower GC content in the third codon positions, more parsimony-informative sites and a longer aligned sequence length (including gaps) were found in the Gnepine category (electronic supplementary material, table S4).
Figure 2.
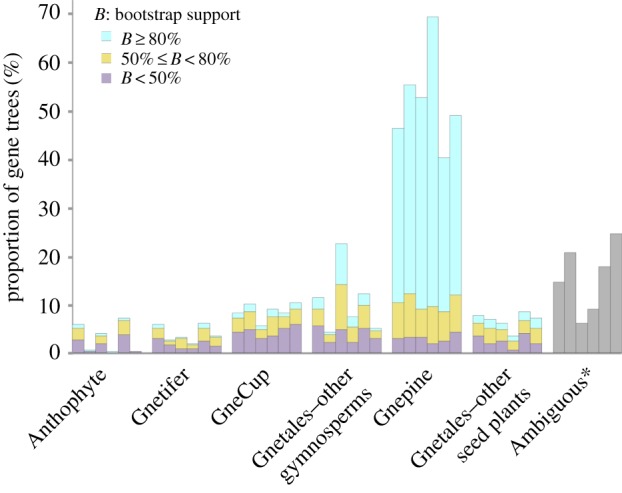
Summary of support for alternative phylogenetic hypotheses in single-gene trees. Columns from left to right of each category represent CDS (1st + 2nd), CDS (1st + 2nd) excluding sites supporting the Anthophyte hypothesis, CDS, CDS excluding sites supporting the Anthophyte hypothesis, AA and AA excluding sites supporting the Anthophyte hypothesis, respectively. The asterisk indicates orthogroups that cannot resolve the position of Gnetales.
(b). Compositional heterogeneity, heterotachy and convergent/parallel evolution tests
The compositional heterogeneity test did not find significant heterogeneity in the genes tested (electronic supplementary material, figure S5a). The pairwise ML distances (substitution rates) between C. gametophytes and the main six clades of seed plants, and the HBGP for each category, are shown in electronic supplementary material, figure S6. Gnetales and angiosperms show higher substitution rates than Conifer II, Pinaceae, Ginkgo and cycads, and the anthophyte category shows the highest HBGP value. In addition, the Gnetales–other gymnosperms category shows the lowest substitution rate.
In the concatenated CDS and AA matrices, approximately 42.5% and 50.8% sites support the Gnetales–other gymnosperms hypothesis with the highest SSLS values, respectively. However, in the concatenated CDS (1st + 2nd) matrix, only 31.1% sites support the Gnetales–other gymnosperms hypothesis, whereas 32.1% sites support the Gnetales–other seed plants hypothesis. By contrast, in the concatenated CDS (1st + 2nd), CDS and AA matrices, the proportions of sites supporting the Gnepine hypothesis are close, being 21.8%, 26.9% and 21.2%, respectively (electronic supplementary material, figure S7). In particular, when the Gnepine hypothesis was set to H0 and other hypotheses to Ha, the obtained mean ΔSSLS scores are all positive, indicating that H0 is better than Ha. Furthermore, when the site ΔSSLS scores were compared, we found that the sites with ΔSSLS > 0.5 are much more than the sites with ΔSSLS less than −0.5 (electronic supplementary material, table S5).
In the single-gene analysis, when the Gnepine hypothesis was set to H0, nearly all orthogroups of the Gnepine category got positive mean ΔSSLS scores. By contrast, a number of orthogroups of the other categories got negative mean ΔSSLS scores. In addition, the sites of ΔSSLS > 0.5 are much more than the sites of ΔSSLS less than −0.5 in the Gnepine category but not in the other categories (electronic supplementary material, figure S8). For example, when the Gnepine hypothesis was set to H0 and Anthophyte to Ha, most orthogroups of the Gnepine category have positive mean ΔSSLS values (electronic supplementary material, figure S9). When orthogroups of each category were concatenated, separately, most sites were identified to support the corresponding hypothesis. For example, 48.96%, 51.8% and 67.6% sites in the concatenated CDS (1st + 2nd), CDS and AA sequences of the Gnepine category were identified to support the Gnepine hypothesis (electronic supplementary material, figure S10).
When all angiosperm taxa were removed from each orthogroup, the Gnepine hypothesis was supported by more trees generated from CDS (1st + 2nd) (639 versus 606) and AA (599 versus 527) matrices, but fewer trees generated from CDS (648 versus 686) matrices. In particular, among the orthogroups of the Anthophyte category, a larger proportion changed to support the Gnepine hypothesis (electronic supplementary material, table S6). After removing sites supporting the anthophyte hypothesis from each orthogroup, the proportion of gene trees supporting the Gnepine hypothesis also greatly increased (figure 2).
(c). Divergence times and absolute evolutionary rates of seed plants
The estimated divergence times based on the CDS (1st + 2nd) are shown in figure 3. The crown ages of gymnosperms, cycads + Ginkgo, Conifer II, Gnetales and Pinaceae were inferred to be approximately 325.37, 256.14, 248.52, 154.47 and 171.97 Ma, respectively. The selective pressure and absolute evolutionary rate tests showed that dN and dS as well as RN and RS values are highly positively correlated (R2 (dN versus dS) = 0.9376, R2 (RN versus RS) = 0.9693), whereas the ω value of each species is negatively correlated with dN, dS, RN and RS (figure 4). Interestingly, angiosperms and Gnetales have similar dN, dS, RN, RS and ω values. Furthermore, the dN, dS, RN and RS values are much higher in angiosperms and Gnetales than in other seed plants, whereas the ML distances are close among all main lineages of seed plants (figure 4; electronic supplementary material, figure S11).
Figure 3.

Divergence times of gymnosperms estimated by MCMCTree with Bayesian relaxed molecular clock based on the combined CDS (1st + 2nd) sequences. A–N indicate fossil calibration points. Standard errors for estimates of node ages are given for each node.
Figure 4.

Sequence variation parameters and the ML distance calculated for each taxon based on the concatenated CDS sequences. (a) RN and RS; (b) a regression analysis between RN and RS; (c) dN, dS and ML distance; and (d) a regression analysis between ω and dN, dS, RN, RS. Abbreviations correspond to electronic supplementary material, table S1.
4. Discussion
(a). The deep phylogeny of gymnosperms and the Gnepine hypothesis both receive robust phylogenetic support
After decades of efforts in phylogenetic reconstruction, evolutionary relationships of the main lineages of seed plants are still controversial. In particular, several alternative hypotheses regarding the phylogenetic placement of Gnetales have not been completely resolved (electronic supplementary material, figure S1) [1], although some phylogenomic analyses based on plastid genomes or multiple nuclear genes have been conducted [3,9–11,16,18,41]. For instance, Lee et al. [41] analysed 22 838 sets of orthogroups (ESTs) for 101 genera across land plants and placed Gnetales as sister to the rest of gymnosperms (bootstrap support greater than 95%), whereas the Gnepine hypothesis was supported by a coalescent analysis of 305 nuclear genes in Xi et al. [16] and a supermatrix analysis of the first- and second-codon positions of 674 genes in Wickett et al. [18], although the support values were not high or other hypotheses were not completely rejected. Our present study provides the first comprehensive phylogenomic analysis to resolve the phylogenetic position of Gnetales based on a broad taxonomic sampling that represents all main lineages of gymnosperms.
Regardless of which datasets were analysed and either concatenation or coalescent methods were used, our results consistently resolved the seed plant phylogeny as shown in figure 1. Gnetales is sister to Pinaceae with a bootstrap value of 100% in all phylogenetic analyses, strongly supporting the Gnepine hypothesis. In fact, the Gnepine hypothesis is also supported by some gene loss events shared between Gnetales and Pinaceae, such as the loss of rpl16 in the plastid genome [42] and functional nuclear lhcb6 and lhcb3 genes for light-harvesting [43]. In addition, cycads and Ginkgo form a monophyletic group. A sister relationship between cycads and Ginkgo is also supported by some morphological characters, such as their unusual pattern of pollen tube development, flagellated male gametes, simple female strobili and embryo development [17].
Our study also provides a good resolution for evolutionary relationships among Cephalotaxaceae, Cupressaceae, Sciadopityaceae and Taxaceae, which have been debated for many years [1]. The present analysis strongly supports Sciadopityaceae as sister to Cupressaceae + Taxaceae + Cephalotaxaceae and also supports Taxaceae as a monophyletic group sister to Cephalotaxaceae (figure 1).
(b). Stochastic and systematic errors should be greatly reduced in phylogenomic studies
Previous studies suggested that more genes are required for both concatenation and coalescent methods to accurately estimate the species tree when there is a high degree of gene tree discordance [44]. In this study, we used a much larger dataset than previous phylogenomic studies of gymnosperms. To improve the assembly reliability and obtain more unigenes, we sequenced transcriptomes of 22 species that represent all 13 families of gymnosperms. For each species, we obtained 30 176–59 810 unigenes, with gene length greater than 199 bp and N50 > 1563 bp (electronic supplementary material, table S1). The phylogenetic analysis used 1308 orthogroups with a total of 1 296 042 aligned sites.
Missing data might have negative effects on phylogenetic reconstruction, such as inflating node support despite the absence of phylogenetic signal or misleading estimates of topology and branch lengths [45]. The artefacts of missing data are greatly reduced and can be ignored in this study. In our dataset, missing data only account for 2.159% (electronic supplementary material, figure S5b), which are much lower than those in other studies. For instance, Lee et al. [41] analysed millions of AA sites, but their dataset suffered greatly from missing data. In their 30% matrix used to reconstruct the seed plant phylogeny, only approximately 40.6% genera were represented in each gene partition. In the study of Xi et al. [16], the concatenated nuclear gene matrix included 155 295 nucleotide sites, but missing data accounted for 37.1%. Similarly, in the study of Wickett et al. [18], the untrimmed nucleotide supermatrix comprising 852 orthogroups included 1 701 170 aligned sites, but of which 32.4% were missing.
Long branch attraction (LBA) can also confound reconstruction of the deep phylogeny of seed plants (see review by Chaw et al. [46]). In this study, great efforts have been made to mitigate the effects of LBA. First, considering that outgroup selection without regard for branch length distribution could exacerbate LBA artefacts and disrupt correct ingroup topology [13], we selected three fern species as outgroups. The ferns are more closely related to seed plants than Selaginella physcomitrella, a lycopsid with available whole genome sequences. Second, in order to break up long branches, we sampled many more gymnosperm species than previous studies [16,18,41]. Third, both supermatrix- and coalescent-based strategies were used to test whether the species tree is correctly inferred. When long external and short internal branches occur simultaneously, the concatenation method could mislead phylogenetic inference due to LBA, whereas the coalescent method is more robust under these circumstances [44]. Fourth, because generally partitioned concatenation has outperformed the unpartitioned concatenation method [47], we conducted both partitioned and unpartitioned concatenation analyses to infer the phylogeny of seed plants. Fifth, misleading phylogenetic inference could be caused by evolutionary saturation in fast-evolving sites that cannot be corrected by the substitution model. Therefore, we removed the poorly aligned regions. After filtering, all three codon positions in the concatenated matrix are not substitutionally saturated, and the mean and highest ω-values of the 1308 genes are 0.099 and 0.368, respectively. Furthermore, we used CDS (1st + 2nd), CDS and AA sequences for phylogenetic reconstruction, respectively, and consistently resolved the phylogeny of seed plants (figure 1).
(c). Homoplastic evolution is responsible for the difficulty in reconstructing the deep phylogeny of seed plants
The well-resolved phylogenetic relationships among the five main lineages of seed plants (figure 1) provide a good opportunity to investigate why the phylogenetic position of Gnetales has been controversial for so many years. Our analysis indicates that stochastic errors should not be mainly responsible for the discordant topologies generated from different genes. Although genes of the ambiguous category are much shorter and less parsimony-informative than other orthogroups (electronic supplementary material, table S4), the phylogenetic tree generated from the concatenated genes of this category still supports the Gnepine hypothesis. This suggests that the ambiguous topologies in single-gene trees of this category could be attributed to low resolution of these genes.
We also explored whether systematic errors occurred in our phylogenetic analyses. The low RCFV values and the similar mean/median HBGP values between different categories of genes suggest that compositional bias and heterotachy are not the main factors responsible for the topological discordance among single-gene trees (electronic supplementary material, figure S5). However, the SSLS test indicates that convergent or homoplastic evolution has caused the phylogenetic conflict in seed plants. Although most genes got positive mean ΔSSLS values when the hypothesis supported by the gene was set as H0 (electronic supplementary material, figures S8 and S9), a large proportion of sites actually support other hypotheses. For instance, among the 527 genes (AA sequences) that support the Gnepine hypothesis, 486 genes (92%) have the highest mean ΔSSLS values, but 32.4% sites in the concatenated Gnepine matrix were identified to support other hypotheses. For the 94 genes (AA sequences) supporting the anthophyte hypothesis, approximately 39.8% sites support other hypotheses (electronic supplementary material, figure S10). In particular, many sites were identified to support the Gnetales–other gymnosperms or Gnetales–other seed plant hypotheses (electronic supplementary material, figures S7 and S10). Thus, it could be inferred that some of these sites might have experienced convergent or homoplastic evolution, which leads to the discordant molecular phylogenies of seed plants reconstructed from different genes. This inference is further corroborated by our findings that the number of orthogroups supporting the Gnepine hypothesis greatly increased when removing all angiosperm taxa or removing all sites supporting the Anthophyte hypothesis from each orthogroup (figure 2; electronic supplementary material, table S6).
De La Torre et al. [8] compared the evolutionary rate difference between gymnosperms and angiosperms based on 42 single-copy nuclear genes, and found that Gnetales has higher evolutionary rates than other lineages of gymnosperms. Our present study investigated many more genes (1308 orthogroups) than De La Torre et al. [8], and found that Gnetales and angiosperms have similar dN, dS, RN, RS and ω (dN/dS) values (figure 4; electronic supplementary material, figure S11), which imply that these two groups might have experienced similar selective pressures. It is particularly interesting that all of these values, with the exception of ω, are much higher in angiosperms and Gnetales than in other gymnosperms. Many factors, like population size, generation time and genome size, could affect molecular evolutionary rates in seed plant lineages [8]. Gnetales has the smallest genome size and effective population size, and the shortest generation time in gymnosperms [1,7,48], and therefore exhibits a higher evolutionary rate as angiosperms. Furthermore, previous studies showed that taller plants replicate their DNA less frequently and subsequently have lower substitution rates [7]. The average height of Gnetales is much lower than that of other gymnosperms, and thus may replicate its DNA more frequently, leading to a higher substitution rate.
Actually, the earliest fossil records of Gnetales and angiosperms can be dated back to the same geological periods (i.e. the Late Jurassic or Early Cretaceous [49,50]), although our divergence time estimates are largely consistent with previous studies (e.g. [51]), suggesting earlier origins of the two groups (figure 3). Generally, a constant warm climate and a very gentle temperature gradient from the equator to the poles occurred in the Cretaceous, which was supported by the warm-adapted plant fossils from localities as far north as Alaska and Greenland [52]. Therefore, angiosperms and Gnetales might have adapted to the same environment in the Cretaceous and convergently evolved some similar characters, such as net-veined leaves and vessels in Gnetum [4]. Although the net-veined leaves and vessels in Gnetum do not have high transpiration, photosynthesis and water transportation capacities as in most angiosperms, they have adapted to wet, closed lowland rainforest habitats as obligate shade angiosperms [53]. However, because most genes used in the present phylogenetic study are evolutionarily conserved among seed plants and have experienced purifying selection, it is difficult to find some specific genes under positive selection that could be related to morphological convergence. Future studies can further investigate whether and how convergent evolution has occurred between Gnetales and angiosperms by comparing genome sequences and transcriptomes of specific organs in same developmental stages.
Supplementary Material
Supplementary Material
Supplementary Material
Supplementary Material
Supplementary Material
Supplementary Material
Supplementary Material
Supplementary Material
Supplementary Material
Supplementary Material
Supplementary Material
Supplementary Material
Acknowledgements
We sincerely thank Xun Gong, Yan-Yan Liu, Hui Wu and Sheng-Long Kan for plant sampling, Yi-Zhen Sun for DNA sequencing, and Zhe Cai for data analysis.
Data accessibility
The transcriptome sequencing reads are deposited in NCBI. The GenBank accession numbers are shown in electronic supplementary material, table S1. Phylogenetic data, including alignments, are deposited in Dryad Digital Repository [54].
Authors' contributions
X-Q.W. and J.-H.R. conceived and designed this research. T.-T.S. and J.-H.R. carried out the experiments. J.-H.R., X.-Q.W., T.-T.S. and M.-M.W. performed the analyses. J.-H.R. and X.-Q.W. wrote the manuscript. All authors read and discussed the manuscript.
Competing interests
We have no competing interests.
Funding
This work was supported by Key Research Program of Frontier Sciences, CAS (QYZDJ-SSW-SMC027), the National Natural Science Foundation of China (31330008, 31170197 and 31370250) and the Youth Innovation Promotion Association CAS (2012070).
References
- 1.Wang X-Q, Ran J-H. 2014. Evolution and biogeography of gymnosperms. Mol. Phylogenet. Evol. 75, 24–40. ( 10.1016/j.ympev.2014.02.005) [DOI] [PubMed] [Google Scholar]
- 2.Armenise L, Simeone MC, Piredda R, Schirone B. 2012. Validation of DNA barcoding as an efficient tool for taxon identification and detection of species diversity in Italian conifers. Eur. J. For. Res. 131, 1337–1353. ( 10.1007/s10342-012-0602-0) [DOI] [Google Scholar]
- 3.Li Z, et al. 2017. Single-copy genes as molecular markers for phylogenomic studies in seed plants. Genome Biol. Evol. 9, 1130–1147. ( 10.1093/gbe/evx070) [DOI] [PMC free article] [PubMed] [Google Scholar]
- 4.Doyle JA, Donoghue MJ. 1986. Seed plant phylogeny and the origin of angiosperms: an experimental cladistic approach. Bot. Rev. 52, 321–431. ( 10.1007/Bf02861082) [DOI] [Google Scholar]
- 5.Drouin G, Daoud H, Xia J. 2008. Relative rates of synonymous substitutions in the mitochondrial, chloroplast and nuclear genomes of seed plants. Mol. Phylogenet. Evol. 49, 827–831. ( 10.1016/j.ympev.2008.09.009) [DOI] [PubMed] [Google Scholar]
- 6.Zhong B, Deusch O, Goremykin VV, Penny D, Biggs PJ, Atherton RA, Nikiforova SV, Lockhart PJ. 2011. Systematic error in seed plant phylogenomics. Genome Biol. Evol. 3, 1340–1348. ( 10.1093/gbe/evr105) [DOI] [PMC free article] [PubMed] [Google Scholar]
- 7.Wang B, Jiang B, Zhou Y, Su Y, Wang T. 2015. Higher substitution rates and lower dN/dS for the plastid genes in Gnetales than other gymnosperms. Biochem. Syst. Ecol. 59, 278–287. ( 10.1016/j.bse.2015.02.009) [DOI] [Google Scholar]
- 8.De La Torre AR, Li Z, Van de Peer Y, Ingvarsson PK. 2017. Contrasting rates of molecular evolution and patterns of selection among gymnosperms and flowering plants. Mol. Biol. Evol. 34, 1363–1377. ( 10.1093/molbev/msx069) [DOI] [PMC free article] [PubMed] [Google Scholar]
- 9.Puttick MN, et al. 2018. The interrelationships of land plants and the nature of the ancestral embryophyte. Curr. Biol. 28, 733–745.e732. ( 10.1016/j.cub.2018.01.063) [DOI] [PubMed] [Google Scholar]
- 10.Pease JB, Brown JW, Walker JF, Hinchliff CE, Smith SA. 2018. Quartet sampling distinguishes lack of support from conflicting support in the green plant tree of life. Am. J. Bot. 105, 385–403. ( 10.1002/ajb2.1016) [DOI] [PubMed] [Google Scholar]
- 11.Gitzendanner MA, Soltis PS, Wong GK, Ruhfel BR, Soltis DE. 2018. Plastid phylogenomic analysis of green plants: a billion years of evolutionary history. Am. J. Bot. 105, 291–301. ( 10.1002/ajb2.1048) [DOI] [PubMed] [Google Scholar]
- 12.Delsuc F, Brinkmann H, Philippe H. 2005. Phylogenomics and the reconstruction of the tree of life. Nat. Rev. Genet. 6, 361–375. ( 10.1038/nrg1603) [DOI] [PubMed] [Google Scholar]
- 13.Liu L, Xi Z, Wu S, Davis CC, Edwards SV. 2015. Estimating phylogenetic trees from genome-scale data. Ann. NY Acad. Sci. 1360, 36–53. ( 10.1111/nyas.12747) [DOI] [PubMed] [Google Scholar]
- 14.Jermiin LS, Ho SYW, Ababneh F, Robinson J, Larkum AWD. 2004. The biasing effect of compositional heterogeneity on phylogenetic estimates may be underestimated. Syst. Biol. 53, 638–643. ( 10.1080/10635150490468648) [DOI] [PubMed] [Google Scholar]
- 15.Zhong B, Yonezawa T, Zhong Y, Hasegawa M. 2010. The position of Gnetales among seed plants: overcoming pitfalls of chloroplast phylogenomics. Mol. Biol. Evol. 27, 2855–2863. ( 10.1093/molbev/msq170) [DOI] [PubMed] [Google Scholar]
- 16.Xi Z, Rest JS, Davis CC. 2013. Phylogenomics and coalescent analyses resolve extant seed plant relationships. PLoS ONE 8, e80870 ( 10.1371/journal.pone.0080870) [DOI] [PMC free article] [PubMed] [Google Scholar]
- 17.Wu C-S, Chaw S-M, Huang Y-Y. 2013. Chloroplast phylogenomics indicates that Ginkgo biloba is sister to cycads. Genome Biol. Evol. 5, 243–254. ( 10.1093/gbe/evt001) [DOI] [PMC free article] [PubMed] [Google Scholar]
- 18.Wickett NJ, et al. 2014. Phylotranscriptomic analysis of the origin and early diversification of land plants. Proc. Natl. Acad. Sci. USA 111, E4859–E4868. ( 10.1073/pnas.1323926111) [DOI] [PMC free article] [PubMed] [Google Scholar]
- 19.Emms DM, Kelly S. 2015. OrthoFinder: solving fundamental biases in whole genome comparisons dramatically improves orthogroup inference accuracy. Genome Biol. 16, 157 ( 10.1186/s13059-015-0721-2) [DOI] [PMC free article] [PubMed] [Google Scholar]
- 20.Bolger AM, Lohse M, Usadel B. 2014. Trimmomatic: a flexible trimmer for Illumina sequence data. Bioinformatics 30, 2114–2120. ( 10.1093/bioinformatics/btu170) [DOI] [PMC free article] [PubMed] [Google Scholar]
- 21.Haas BJ, et al. 2013. De novo transcript sequence reconstruction from RNA-seq using the Trinity platform for reference generation and analysis. Nat. Protoc. 8, 1494–1512. ( 10.1038/nprot.2013.084) [DOI] [PMC free article] [PubMed] [Google Scholar]
- 22.Grabherr MG, et al. 2011. Full-length transcriptome assembly from RNA-Seq data without a reference genome. Nat. Biotechnol. 29, 644–652. ( 10.1038/nbt.1883) [DOI] [PMC free article] [PubMed] [Google Scholar]
- 23.Li W, Godzik A. 2006. Cd-hit: a fast program for clustering and comparing large sets of protein or nucleotide sequences. Bioinformatics 22, 1658–1659. ( 10.1093/bioinformatics/btl158) [DOI] [PubMed] [Google Scholar]
- 24.Wang H-J, Li W-T, Liu Y-N, Yang F-S, Wang X-Q. 2017. Resolving interspecific relationships within evolutionarily young lineages using RNA-seq data: an example from Pedicularis section Cyathophora (Orobanchaceae). Mol. Phylogenet. Evol. 107, 345–355. ( 10.1016/j.ympev.2016.11.018) [DOI] [PubMed] [Google Scholar]
- 25.Wu M, Chatterji S, Eisen JA. 2012. Accounting for alignment uncertainty in phylogenomics. PLoS ONE 7, e30288 ( 10.1371/journal.pone.0030288) [DOI] [PMC free article] [PubMed] [Google Scholar]
- 26.Stamatakis A. 2014. RAxML version 8: a tool for phylogenetic analysis and post-analysis of large phylogenies. Bioinformatics 30, 1312–1313. ( 10.1093/bioinformatics/btu033) [DOI] [PMC free article] [PubMed] [Google Scholar]
- 27.Yang Y, et al. 2015. Dissecting molecular evolution in the highly diverse plant clade Caryophyllales using transcriptome sequencing. Mol. Biol. Evol. 32, 2001–2014. ( 10.1093/molbev/msv081) [DOI] [PMC free article] [PubMed] [Google Scholar]
- 28.Katoh S. 2013. MAFFT multiple sequence alignment software version 7: improvements in performance and usability. Mol. Biol. Evol. 30, 772–780. ( 10.1093/molbev/mst010) [DOI] [PMC free article] [PubMed] [Google Scholar]
- 29.Suyama M, Torrents D, Bork P. 2006. PAL2NAL: robust conversion of protein sequence alignments into the corresponding codon alignments. Nucl. Acids Res. 34, W609–W612. ( 10.1093/nar/gkl315) [DOI] [PMC free article] [PubMed] [Google Scholar]
- 30.Xia X. 2017. DAMBE6: new tools for microbial genomics, phylogenetics, and molecular evolution. J. Hered. 108, 431–437. ( 10.1093/jhered/esx033) [DOI] [PMC free article] [PubMed] [Google Scholar]
- 31.Ronquist F, et al. 2012. MrBayes 3.2: efficient Bayesian phylogenetic inference and model choice across a large model space. Syst. Biol. 61, 539–542. ( 10.1093/sysbio/sys029) [DOI] [PMC free article] [PubMed] [Google Scholar]
- 32.Lanfear R, Frandsen PB, Wright AM, Senfeld T, Calcott B. 2017. PartitionFinder 2: new methods for selecting partitioned models of evolution for molecular and morphological phylogenetic analyses. Mol. Biol. Evol. 34, 772–773. ( 10.1093/molbev/msw260) [DOI] [PubMed] [Google Scholar]
- 33.Junier T, Zdobnov EM. 2010. The newick utilities: high-throughput phylogenetic tree processing in the UNIX shell. Bioinformatics 26, 1669–1670. ( 10.1093/bioinformatics/btq243) [DOI] [PMC free article] [PubMed] [Google Scholar]
- 34.Mirarab S, Reaz R, Bayzid MS, Zimmermann T, Swenson MS, Warnow T. 2014. ASTRAL: genome-scale coalescent-based species tree estimation. Bioinformatics 30, i541–i548. ( 10.1093/bioinformatics/btu462) [DOI] [PMC free article] [PubMed] [Google Scholar]
- 35.Arcila D, et al. 2017. Genome-wide interrogation advances resolution of recalcitrant groups in the tree of life. Nat. Ecol. Evol. 1, 20 ( 10.1038/s41559-016-0020) [DOI] [PubMed] [Google Scholar]
- 36.Shimodaira H, Hasegawa M. 2001. CONSEL: for assessing the confidence of phylogenetic tree selection. Bioinformatics 17, 1246–1247. ( 10.1093/bioinformatics/17.12.1246) [DOI] [PubMed] [Google Scholar]
- 37.Kuck P, Struck TH. 2014. BaCoCa—a heuristic software tool for the parallel assessment of sequence biases in hundreds of gene and taxon partitions. Mol. Phylogenet. Evol. 70, 94–98. ( 10.1016/j.ympev.2013.09.011) [DOI] [PubMed] [Google Scholar]
- 38.Parker J, Tsagkogeorga G, Cotton JA, Liu Y, Provero P, Stupka E, Rossiter SJ. 2013. Genome-wide signatures of convergent evolution in echolocating mammals. Nature 502, 228–231. ( 10.1038/nature12511) [DOI] [PMC free article] [PubMed] [Google Scholar]
- 39.Yang Z. 2007. PAML 4: phylogenetic analysis by maximum likelihood. Mol. Biol. Evol. 24, 1586–1591. ( 10.1093/molbev/msm088) [DOI] [PubMed] [Google Scholar]
- 40.Parkinson CL, Mower JP, Qiu YL, Shirk AJ, Song K, Young ND, DePamphilis CW, Palmer JD. 2005. Multiple major increases and decreases in mitochondrial substitution rates in the plant family Geraniaceae. BMC Evol. Biol. 5, 73 ( 10.1186/1471-2148-5-73) [DOI] [PMC free article] [PubMed] [Google Scholar]
- 41.Lee EK, et al. 2011. A functional phylogenomic view of the seed plants. PLoS Genet. 7, e1002411 ( 10.1371/journal.pgen.1002411) [DOI] [PMC free article] [PubMed] [Google Scholar]
- 42.Wu C-S, Lai Y-T, Lin C-P, Wang Y-N, Chaw S-M. 2009. Evolution of reduced and compact chloroplast genomes (cpDNAs) in gnetophytes: selection toward a lower-cost strategy. Mol. Phylogenet. Evol. 52, 115–124. ( 10.1016/j.ympev.2008.12.026) [DOI] [PubMed] [Google Scholar]
- 43.Kouril R, Nosek L, Bartos J, Boekema EJ, Ilik P. 2016. Evolutionary loss of light-harvesting proteins Lhcb6 and Lhcb3 in major land plant groups: break-up of current dogma. New Phytol. 210, 808–814. ( 10.1111/nph.13947) [DOI] [PubMed] [Google Scholar]
- 44.Liu L, Xi Z, Davis CC. 2015. Coalescent methods are robust to the simultaneous effects of long branches and incomplete lineage sorting. Mol. Biol. Evol. 32, 791–805. ( 10.1093/molbev/msu331) [DOI] [PubMed] [Google Scholar]
- 45.Lemmon AR, Brown JM, Stanger-Hall K, Lemmon EM. 2009. The effect of ambiguous data on phylogenetic estimates obtained by maximum likelihood and Bayesian inference. Syst. Biol. 58, 130–145. ( 10.1093/sysbio/syp017) [DOI] [PMC free article] [PubMed] [Google Scholar]
- 46.Chaw S-M, Wu C-S, Sudianto E. 2018. Evolution of gymnosperm plastid genomes. Adv. Bot. Res. 85, 195–222. ( 10.1016/bs.abr.2017.11.018) [DOI] [Google Scholar]
- 47.Kainer D, Lanfear R. 2015. The effects of partitioning on phylogenetic inference. Mol. Biol. Evol. 32, 1611–1627. ( 10.1093/molbev/msv026) [DOI] [PubMed] [Google Scholar]
- 48.Leitch AR, Leitch IJ. 2012. Ecological and genetic factors linked to contrasting genome dynamics in seed plants. New Phytol. 194, 629–646. ( 10.1111/j.1469-8137.2012.04105.x) [DOI] [PubMed] [Google Scholar]
- 49.Yang Y, Lin L-B, Ferguson DK, Zhang S-Z, Wan T. 2017. A new gnetalean macrofossil from the Early Cretaceous and its evolutionary significance. Cretaceous Res. 74, 56–64. ( 10.1016/j.cretres.2017.02.007) [DOI] [Google Scholar]
- 50.Puebla GG, Iglesias A, Gomez MA, Pramparo MB. 2017. Fossil record of Ephedra in the lower cretaceous (Aptian), Argentina. J. Plant Res. 130, 975–988. ( 10.1007/s10265-017-0953-1) [DOI] [PubMed] [Google Scholar]
- 51.Magallón S, Hilu KW, Quandt D. 2013. Land plant evolutionary timeline: gene effects are secondary to fossil constraints in relaxed clock estimation of age and substitution rates. Am. J. Bot. 100, 556–573. ( 10.3732/ajb.1200416) [DOI] [PubMed] [Google Scholar]
- 52.Stanley SM. 1999. Earth system history. New York, NY: WH Freeman and Company. [Google Scholar]
- 53.Feild TS, Balun L. 2008. Xylem hydraulic and photosynthetic function of Gnetum (Gnetales) species from Papua New Guinea. New Phytol. 177, 665–675. ( 10.1111/j.1469-8137.2007.02306.x) [DOI] [PubMed] [Google Scholar]
- 54.Ran J-H, Shen T-T, Wang M-M, Wang X-Q. 2018. Data from: Phylogenomics resolves the deep phylogeny of seed plants and indicates partial convergent or homoplastic evolution between Gnetales and angiosperms Dryad Digital Repository. ( 10.5061/dryad.f7f57) [DOI] [PMC free article] [PubMed]
Associated Data
This section collects any data citations, data availability statements, or supplementary materials included in this article.
Data Citations
- Ran J-H, Shen T-T, Wang M-M, Wang X-Q. 2018. Data from: Phylogenomics resolves the deep phylogeny of seed plants and indicates partial convergent or homoplastic evolution between Gnetales and angiosperms Dryad Digital Repository. ( 10.5061/dryad.f7f57) [DOI] [PMC free article] [PubMed]
Supplementary Materials
Data Availability Statement
The transcriptome sequencing reads are deposited in NCBI. The GenBank accession numbers are shown in electronic supplementary material, table S1. Phylogenetic data, including alignments, are deposited in Dryad Digital Repository [54].