Abstract
Neurons frequently encounter neurodegenerative signals first in their periphery. For example, exposure of axons to oligomeric Aβ1‐42 is sufficient to induce changes in the neuronal cell body that ultimately lead to degeneration. Currently, it is unclear how the information about the neurodegenerative insult is transmitted to the soma. Here, we find that the translation of pre‐localized but normally silenced sentinel mRNAs in axons is induced within minutes of Aβ1–42 addition in a Ca2+‐dependent manner. This immediate protein synthesis following Aβ1–42 exposure generates a retrograde signaling complex including vimentin. Inhibition of the immediate protein synthesis, knock‐down of axonal vimentin synthesis, or inhibition of dynein‐dependent transport to the soma prevented the normal cell body response to Aβ1–42. These results establish that CNS axons react to neurodegenerative insults via the local translation of sentinel mRNAs encoding components of a retrograde signaling complex that transmit the information about the event to the neuronal soma.
Keywords: Alzheimer's disease, axonal protein synthesis, neurodegeneration, oligomeric Aβ1–42, retrograde signal
Subject Categories: Neuroscience
Introduction
Alzheimer's disease (AD) is a devastating disorder characterized by the gradual loss of cognitive abilities. The progressive nature of the disease is a reflection of the spread of pathological alterations in the patients’ brains 1. This spread is not random but follows a stereotypical pattern dictated by connectivity through neurites rather than by proximity 2. Accumulation of soluble oligomeric Aβ1‐42 in AD brains is positively correlated with the onset of cognitive defects 3, and due to their size, axons and dendrites often encounter neurodegenerative stimuli, such as Aβ1‐42, earlier and more frequently than soma. Thus, long‐projection axons in the brain have dual importance in the spread of AD: Locally triggered pathogenic changes within axons are part of the primary events driving the development of neurodegeneration 4, and they serve as conduits for the retrograde flow of information about the neurodegenerative stimulus back to their neuronal soma.
Exposure of axons to oligomeric Aβ1‐42 is sufficient to induce retrograde degeneration 5, 6, 7. Previously, we reported that axonally applied Aβ1‐42 triggered the local synthesis of the transcription factor ATF4, and inhibition of axonal ATF4 synthesis or of its retrograde transport prevented Aβ1‐42‐induced neurodegeneration in vitro and in a mouse model of amyloidopathy 7. However, the axonal synthesis of ATF4 is not an immediate reaction to Aβ1‐42 but occurs with a delay of several hours because Atf4 mRNA levels are normally very low in axons, requiring its recruitment from the soma to support local ATF4 synthesis. Here, we asked which signaling mechanisms get rapidly activated within Aβ1–42‐treated axons and are necessary to initiate mRNA recruitment from the soma. We hypothesized that the immediate Aβ1–42‐induced translation of pre‐localized sentinel mRNAs generates a retrograde signaling complex that carries information regarding the neurodegenerative insult back to the neuronal soma.
Intra‐neuritic protein synthesis allows neurons to react acutely and in a spatially confined manner to changes in their environment 8. During neurodevelopment, axonal translation is crucial for growth cone behavior, axonal pathfinding, axon maintenance, and retrograde signaling 9. In post‐developmental neurons, local protein synthesis functions in axonal survival, in neurotransmission, and in the context of neurodegenerative diseases 7, 10, 11, 12. In response to nerve injury, axons in the peripheral nervous system rapidly translate pre‐localized, silenced mRNAs, producing proteins, which signal retrogradely and act upstream of a nuclear transcriptional response 13, 14, 15, 16.
We found that axons of central nervous system neurons similarly induce axonal protein synthesis within minutes of Aβ1–42 exposure and that the resulting locally synthesized proteins travel retrogradely to the neuronal cell body initiating a nuclear response that leads to axonal Atf4 localization and translation.
Results
Immediate activation of axonal protein synthesis in response to Aβ1–42
To determine whether exposure to oligomeric Aβ1–42 immediately induces protein synthesis in axons, embryonic hippocampal neurons were cultured in tripartite microfluidic chambers, which allow for fluidic isolation of axons from soma and dendrites 17, 18. The hydrophobic nature of the microfluidic devices reduced the effective concentration of peptides such as oligomeric Aβ1–42 19; thus, axons were exposed to 3 μM oligomeric Aβ1–42, which we previously found to be equivalent to approximately 250 nM in regular cultures 7. The phosphorylation of S6, a marker for translation, was increased after 30 min of Aβ1‐42 treatment and returned to baseline by 1 h of treatment (Fig 1A), indicating that local Aβ1–42 exposure triggers the rapid but also transient activation of mRNA translation in axons.
Figure 1. Locally applied oligomeric Aβ1–42 rapidly induces axonal protein synthesis.
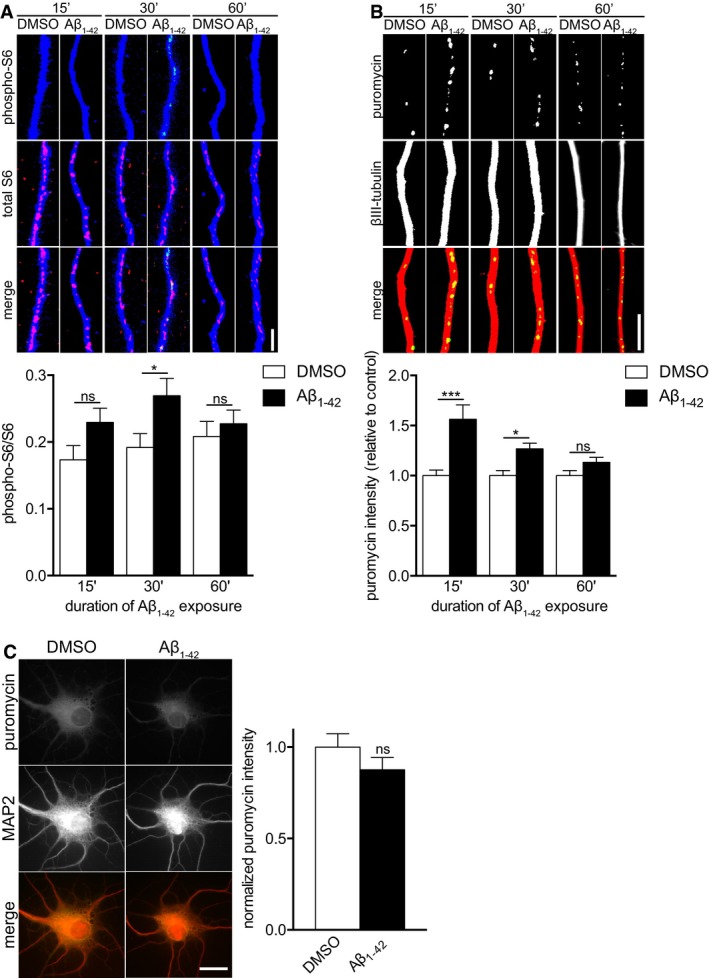
- Hippocampal neurons were cultured in microfluidic chambers for 11–12 DIV, and axons were treated with vehicle or Aβ1–42 for 15, 30, or 60 min. Axons were immunostained for phospho‐S6, S6, and βIII‐tubulin. Mean ± SEM of 27–40 optical fields per condition (n = 6–8 independently performed experiments per group). *P < 0.05; ns, not significant; two‐way ANOVA with Bonferroni's multiple comparisons test.
- Hippocampal neurons were cultured as in (A), and axons were treated vehicle or Aβ1–42 for 15, 30, or 60 min. During the 15‐min incubation or during the last 10 min prior to fixation for the 30 and 60 min time points, axons were treated with puromycin and then immunostained for puromycin and βIII‐tubulin. Mean ± SEM of 29–30 optical fields per condition (n = 6 independently performed experiments for 15 and 30 min, n = 3 independently performed experiments for 60 min). Aβ1–42 bars are normalized to their respective vehicle treatments. ***P < 0.001; *P < 0.05; ns, not significant; two‐way ANOVA with Bonferroni's multiple comparisons test.
- Dissociated hippocampal neurons were cultured at a low density for 11–12 DIV and treated with vehicle or Aβ1–42 for 30 min. Ten minutes prior to fixation, puromycin was added. The neurons were immunostained for puromycin and MAP2. Mean ± SEM of 28–30 optical fields per condition (n = 6 independently performed experiments). ns, not significant; unpaired t‐test.
To directly visualize protein synthesis, we used puromycylation/SUnSET 20. Puromycin is a tRNA mimetic that gets incorporated into nascent polypeptides leading to translation termination 21. Specific antibodies against puromycin allow the immunocytochemical detection of these puromycylated polypeptides as a quantitative correlate of protein synthesis. We first tested the specificity of the puromycylation assay by treating dissociated hippocampal neurons with puromycin for 10 min, resulting in a significantly increased puromycin staining intensity that was completely prevented in the presence of the protein synthesis inhibitor anisomycin (Fig EV1A).
Figure EV1. Validation of puromycylation assay.
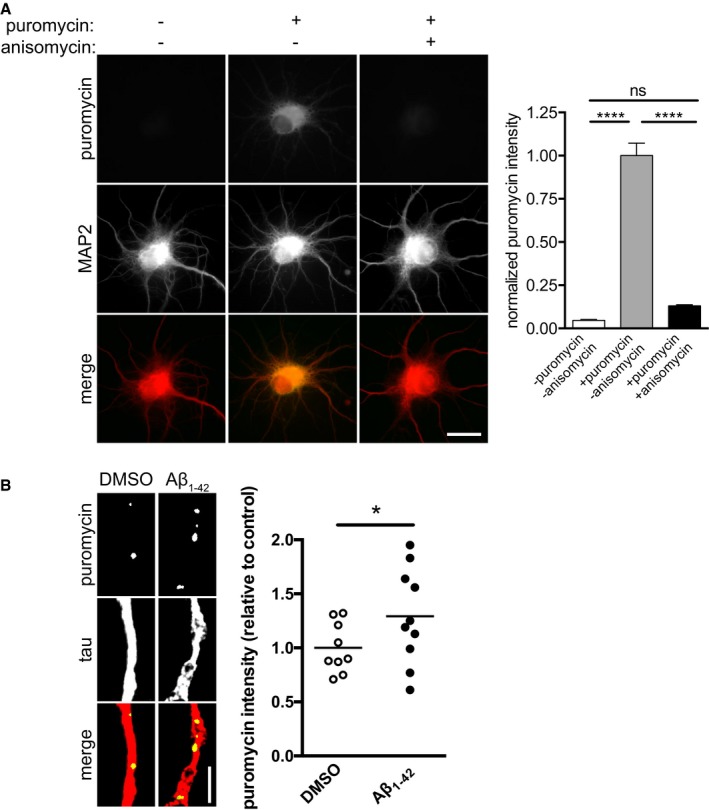
- Hippocampal neurons were cultured for 10–11 DIV. Puromycin was added to dissociated hippocampal neurons in the presence of vehicle or anisomycin. The neurons were fixed and immunostained for puromycin and MAP2. Mean ± SEM of 25–30 optical fields per condition (n = 3 independently performed experiments per group). ****P < 0.0001; ns, not significant; one‐way ANOVA with Bonferroni's multiple comparisons test. Scale bar, 10 μm.
- Hippocampal neurons were cultured for 10–11 DIV. Aβ1–42 was added to the cultured for 30 min, and puromycin was added 10 min prior to fixation. Neurons were fixed and immunostained for puromycin and tau. Mean of 9–10 optical fields per condition (sampled from two coverslips per condition) from one primary culture. *P < 0.05; unpaired, one‐tailed t‐test. Scale bar, 5 μm.
Puromycylation was significantly increased in axons when puromycin was applied to axons together with Aβ1‐42 for 15 min or during the last 10 min of 30 min Aβ1‐42 treatment and reverted back to baseline levels after 60 min (Fig 1B).
Next, to investigate whether immediate Aβ1–42‐dependent protein synthesis was specific to axons, we incubated dissociated hippocampal neurons with vehicle or Aβ1–42 for 30 min and added puromycin during the last 10 min. No changes in protein synthesis were observed in cell bodies (Fig 1C), while the puromycylation signal was increased in axons (Fig EV1B), indicating that the effect of Aβ1–42 on immediate protein synthesis is specific to axons and that the Aβ1–42 signal does not have to be exclusively axonal.
Calcium chelation blocks immediate translational activation
Oligomeric Aβ1–42 causes dysregulation of calcium homeostasis in neurons 22, 23, 24, 25, and Ca2+ signaling activates immediate‐early protein synthesis in axons following axotomy 15, 16. To investigate whether axonally applied oligomeric Aβ1–42 would have an effect on intra‐axonal calcium levels, we performed calcium imaging with on DMSO or Aβ1–42‐treated axons (Fig 2A and B). Aβ1–42 application to isolated axons caused a rapid increase in intra‐cellular calcium. A similar rapid increase in calcium was seen in distal axons of hippocampal neurons cultured in regular, i.e., non‐compartmentalized cultures (Fig EV2). Application of the calcium chelator BAPT‐AM or the NMDA receptor antagonist MK‐801 significantly reduced the Aβ1–42‐induced increase in intra‐axonal calcium concentration. To investigate whether the Aβ1–42‐dependent activation of protein synthesis required calcium dynamics, we measured total and phosphorylated S6 levels in axons exposed for 30 min to Aβ1–42 in the presence and absence of a cell‐permeable calcium chelator, BAPTA‐AM (Fig 2C). In axons pre‐treated with BAPTA‐AM, the activation of S6 was inhibited, indicating that calcium signaling is required for Aβ1–42‐dependent immediate‐early axonal translation.
Figure 2. Immediate Aβ1–42‐dependent S6 activation requires Ca2+ signaling.
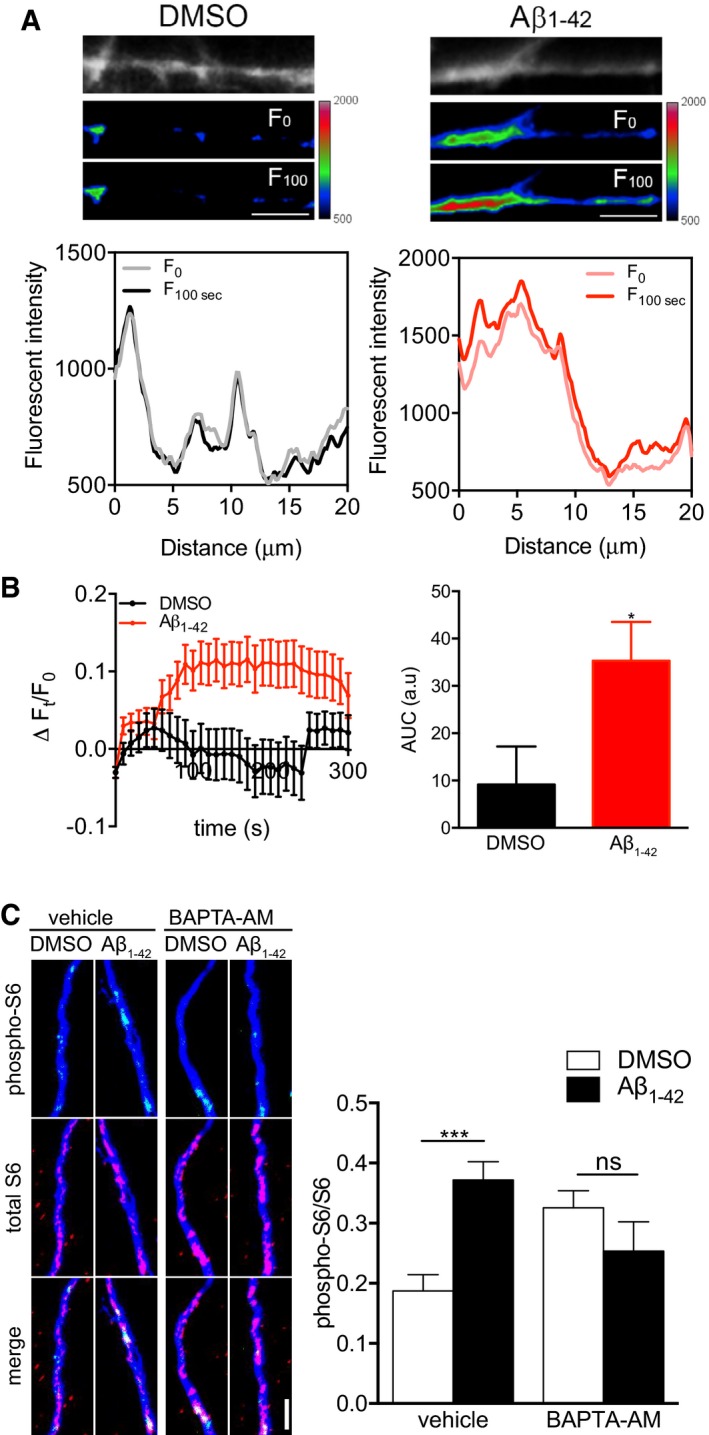
- Axons of hippocampal neurons grown in microfluidic chambers for ≥ 10 DIV were loaded with Fluo4‐AM, treated with DMSO or Aβ1–42, and live‐imaged for 5 min at 10‐s interval. Images of the Fluo4‐AM signal in representative axonal segments are shown in grayscale and pseudocolor for DMSO‐ (left) and Aβ1–42‐treated (right) axons at t = 0 s and t = 100 s. The fluorescence profile along the axonal segments at t = 0 s and t = 100 s is shown. Scale bars, 5 μm.
- Time course of the Fluo4‐AM signal (left) and cumulative fluorescence Fluo4‐AM intensity in area under curve (AUC) (right) of DMSO and Aβ1–42‐treated axons. Baseline correction was applied. Mean ± SEM of 55–65 individual axons (11–13 chambers per group; n = 6 independently performed experiments). *P < 0.05; unpaired t‐test.
- Hippocampal neurons were cultured in microfluidic chambers for 11–12 DIV, and axons were treated with vehicle or BAPTA‐AM (10 μM) for 30 min. Axons were then treated with vehicle or Aβ1–42 for 30 min and immunostained for phospho‐S6, total S6, and βIII‐tubulin. Mean ± SEM of 25 optical fields per condition (n = 5 independently performed experiments). ***P < 0.001; ns, not significant; two‐way ANOVA with Bonferroni's multiple comparisons test. Scale bar, 5 μm.
Figure EV2. Aβ1–42 oligomers increase Ca2+ levels in distal neurites in an NMDA‐dependent manner.
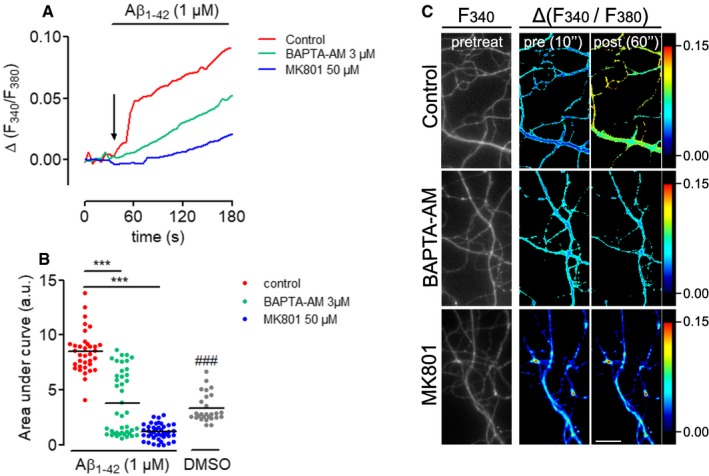
- Hippocampal neurons were grown at low density (5,000 cells cm−2) for > 10 DIV and loaded with Fura2‐AM. Ca2+ levels were measured before and during perfusion with Aβ1–42 oligomers in the presence or absence of the NMDA receptor antagonist MK801 and the Ca2+‐chelator BAPTA‐AM. Relative changes in Fura2‐AM fluorescence intensity were plotted as means of 35–42 neurites imaged in two independent experiments.
- Cumulative Ca2+ levels represented by the area under the curves in (A). Mean of 27–42 neurites imaged in two independent experiments. ***P < 0.001; one‐way ANOVA with Bonferroni's multiple comparisons test. ### P < 0.001, t‐test control Aβ1–42 vs. DMSO.
- Micrographs of representative axonal segments quantified in (A and B). Fura2‐AM levels before (two most left panels, grayscale and pseudocolor image) and after (right panel, pseudocolor image) Aβ1–42 perfusion at the indicated experimental conditions are shown. Scale bar, 25 μm.
Atf4 localization requires immediate axonal signaling
Previously, we have found that Aβ1–42 treatment leads to the axonal recruitment of Atf4 mRNA and the increased appearance of ATF4 protein in axons within 6 h 7. To confirm that the increased levels of ATF4 protein at this time point were dependent upon axonal protein synthesis, we transfected axons with a scrambled siRNA or an Atf4‐targeting siRNA prior to Aβ1–42 treatment. RNAi is functional in axons 26, and mRNAs can be selectively knocked down in axons by axon‐specific delivery of siRNAs 7, 17, 27, 28. Axons transfected with a scrambled siRNA showed increased ATF4 levels in response to Aβ1–42, while transfection with an Atf4‐targeting siRNA completely abolished this increase (Fig 3A), establishing the local synthesis of ATF4 at 6 h of Aβ1–42 treatment.
Figure 3. Aβ1–42‐dependent Atf4 localization requires immediate axonal signaling.
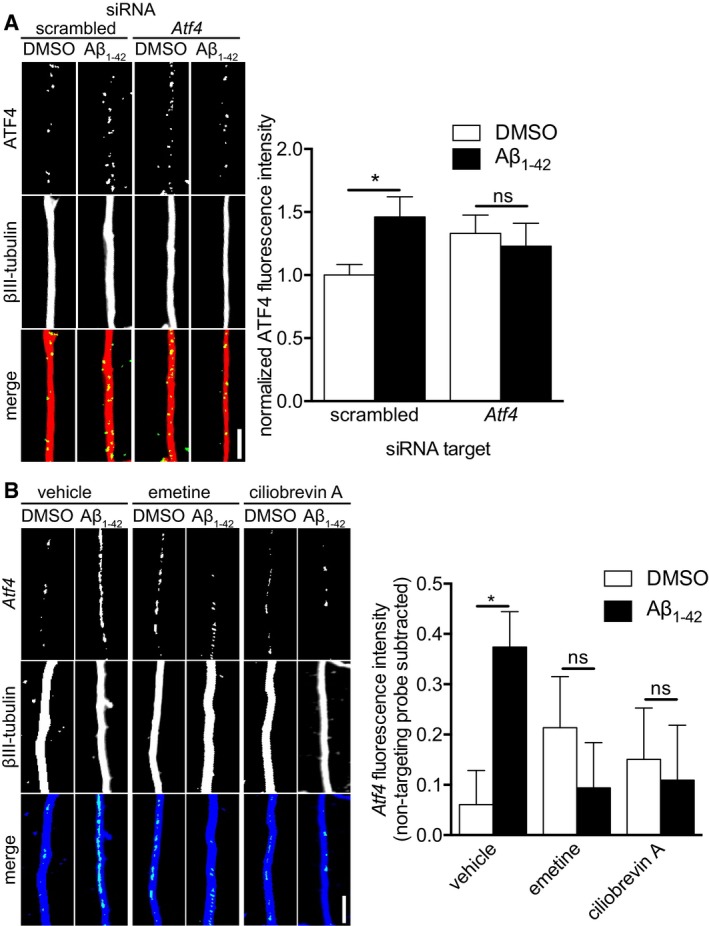
- Hippocampal neurons were cultured in microfluidic chambers for 10–11 DIV, and axons were transfected with scrambled or Atf4‐targeting siRNA. 24 h after transfection, axons were treated with vehicle or Aβ1–42 for 6 h. Axons were immunostained for ATF4 and βIII‐tubulin. Mean ± SEM of 30 optical fields per condition (n = 6 independently performed experiments per group). *P < 0.05; ns, not significant; Holm–Sidak multiple t‐tests.
- Hippocampal neurons were cultured in microfluidic chambers for 11–12 DIV and axons were treated with vehicle, emetine (100 nM), or ciliobrevin A (5 μM) for 45 min. Axons were then treated with vehicle or Aβ1–42 for 6 h. Neurons were fixed and Atf4 transcript levels were measured using quantitative FISH. The background fluorescence was determined using a non‐targeting Gfp probe set (neg. probe) and set to zero. Mean ± SEM of 26–30 optical fields per condition (n = 6 independently performed experiments per group). *P < 0.05; ns, not significant; Holm–Sidak multiple t‐tests.
Next, we asked what the signal from the axons to the neuronal cell bodies might be that triggers the anterograde transport of Atf4 mRNA into Aβ1–42‐exposed axons. We hypothesized that the immediate‐early protein synthesis of a retrograde signaling complex could coordinate communication between Aβ1–42‐treated axons and their cell bodies as had been seen in injured axons 13, 14, 16. Indeed, when we inhibited protein synthesis by pre‐treating the axons with the protein synthesis inhibitor emetine before applying Aβ1–42, the recruitment of Atf4 mRNA into axons was completely prevented (Fig 3B). Similarly, inhibition of dynein‐dependent retrograde transport in axons with ciliobrevin A abolished the Aβ1–42‐dependent increase in axonal Atf4 levels (Fig 3B).
Inhibition of transcription reduces Atf4 translation in axons
To test whether transcription is required for Aβ1–42‐induced axonal Atf4 translation, cell bodies were treated with the transcriptional inhibitor actinomycin D during the axonal Aβ1–42 treatment. After 6 h of Aβ1–42 treatment, cells were fixed and stained for ATF4 protein. As before, Aβ1–42 exposure significantly increased ATF4 levels in axons. Treatment of the cell bodies with actinomycin D did not fully prevent this effect, but the difference in ATF4 signal in vehicle and Aβ1–42‐treated axons was not significantly different (Fig 4A). The inhibitor was effective as it completely inhibited transcription as measured with a plasmid expressing Renilla luciferase expression under the control of a CMV promoter (Fig 4B). The partial inhibition of Aβ1–42‐induced axonal ATF4 synthesis by actinomycin D suggests that while transcription does play a role in regulating axonal Atf4 translation, there are other factors beyond transcription that act in response to Aβ1‐42 to regulate axonal ATF4 synthesis.
Figure 4. Transcription is partially required for Aβ1–42‐dependent axonal ATF4 synthesis.
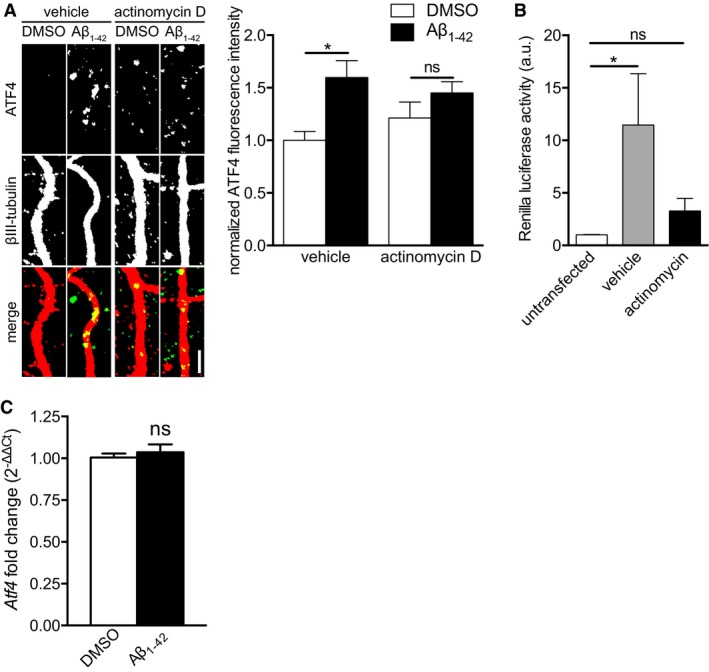
- Hippocampal neurons were cultured in microfluidic chambers for 11–12 DIV, cell bodies were treated with actinomycin D (40 μM), and axons were subsequently treated with vehicle and Aβ1–42 for 6 h. Axons were immunostained for ATF4 and βIII‐tubulin. Mean ± SEM of 39–40 optical fields per condition (n = 8 independently performed experiments per group). *P < 0.05; ns, not significant; Holm–Sidak multiple t‐tests. Scale bar, 5 μm.
- Hippocampal neurons were cultured in microfluidic chambers for 10–11 DIV. Cell bodies were transfected with Renilla luciferase plasmid. 24 h after transfection cell bodies were treated with actinomycin D (40 μM) for 6 h. Cell bodies were lysed, and luciferase activity was measured using a luciferase assay. Mean ± SEM of nine independently performed experiments (n = 9) each with duplicate luciferase measurement. *P < 0.05; ns, not significant; one‐way ANOVA with Bonferroni's multiple comparisons test.
- Hippocampal neurons were cultured in microfluidic chambers for 11–12 DIV, and axons were treated with Aβ1–42 for 1 h. Cell bodies were lysed, and RNA was purified. Atf4 transcript levels were measured by qRT–PCR. Levels were normalized to the RNA input. Mean ± SEM of six independently performed experiments (n = 6) each with triplicate qRT–PCR measurements. ns, not significant; unpaired t‐test.
Rapid Aβ1–42‐dependent increases in somatic Atf4
To determine whether Atf4 itself was being transcribed in response to axonal Aβ1–42 exposure, we measured Atf4 levels in cell bodies using qRT–PCR after 1 h of axonal Aβ1–42 treatment. Atf4 levels in cell bodies of Aβ1–42‐treated axons were indistinguishable from controls (Fig 4C), suggesting that the transcription of another target gene is required for Atf4 localization to the axons.
STAT3 is locally activated but not synthesized in response to Aβ1–42
In injured axons, the transcription factor STAT3 is immediately synthesized, phosphorylated, and retrogradely trafficked to the nucleus, where it induces regenerative gene expression 16. To determine whether this was also occurring in response to locally applied Aβ1–42, we measured STAT3 levels in axons 30 and 60 min after Aβ1–42 treatment. While the Tyr705 phosphorylation of STAT3 increased significantly within 1 h in Aβ1–42‐treated axons, total STAT3 levels did not change (Fig 5A). Conceivably, STAT3 might be locally synthesized in response to Aβ1–42 and rapidly retrogradely transported to the cell body, leading to the absence of a detectable increase in total STAT3 levels in Aβ1–42‐treated axons. To investigate this possibility, we measured axonal STAT3 levels in Aβ1–42‐treated axons in the presence of the dynein inhibitor ciliobrevin A and siRNAs targeting Stat3 mRNA. Neither ciliobrevin A nor Stat3 siRNA had an effect on axonal STAT3 levels (Fig 5B). We confirmed the efficacy of the Stat3 siRNA by qRT–PCR on transfected dissociated hippocampal neurons (Fig 5C). Together, these results establish that—unlike injured axons—Aβ1–42‐treated axons do not synthesize STAT3 but rather activate STAT3 via phosphorylation.
Figure 5. Aβ1–42 induces local activation but not synthesis of STAT3.
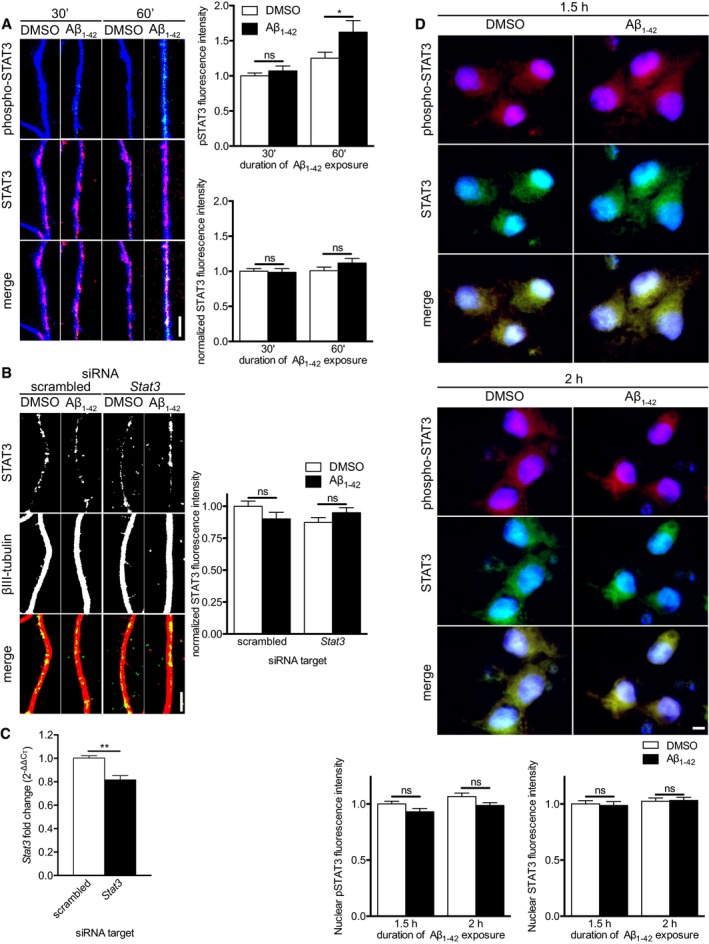
- Hippocampal neurons were cultured in microfluidic chambers for 11–12 DIV, and axons were treated with vehicle or Aβ1–42 for 30 or 60 min. Axons were immunostained for phospho‐STAT3 (Tyr705), STAT3, and βIII‐tubulin. Mean ± SEM of 39–40 optical fields (n = 8 independently performed experiments). *P < 0.05; ns, not significant; two‐way ANOVA with Bonferroni's multiple comparisons test.
- Hippocampal neurons were cultured in microfluidic chambers for 11–12 DIV, and axons were transfected with scrambled or Stat3‐targeting siRNA. 24 h after transfection, axons were pre‐treated with ciliobrevin A for 45 min before addition of vehicle or Aβ1–42 for 1 h. Axons were immunostained for STAT3 and β‐III‐tubulin. Mean ± SEM of 40 optical fields per condition (n = 8 independently performed experiments). ns, not significant; Holm–Sidak multiple t‐tests.
- Dissociated hippocampal neurons were cultured for 11–12 DIV. Neurons were transfected with scrambled or Stat3‐targeting siRNA. 48 h after transfection, neurons were lysed, and RNA was purified. Stat3 transcript levels were quantified using qRT–PCR. Mean ± SEM of six independently performed experiments (n = 6) each with triplicate qRT–PCR measurements. **P < 0.01; unpaired t‐test.
- Hippocampal neurons were cultured in microfluidic chambers for 11–12 DIV and axons were treated with vehicle or Aβ1–42 for 1.5 or 2 h. Neurons were immunostained for pSTAT3 and STAT3, and nuclei were stained with DAPI. Mean ± SEM for 39–50 optical fields (n = 8–10 independently performed experiments). ns, not significant; two‐way ANOVA with Bonferroni's multiple comparisons test.
STAT3 activation is restricted to axons
Canonically, phosphorylated STAT3 is transported to the nucleus where it induces gene expression 29. To investigate whether axonally phosphorylated STAT3 is trafficked to the nucleus in response to Aβ1–42, we measured nuclear levels of total and phosphorylated STAT3 1.5 and 2 h after axonal Aβ1–42 treatment. Neither total STAT3 nor phosphorylated STAT3 levels in the nuclei changed in response to Aβ1–42 (Fig 5D), suggesting a non‐nuclear function for axonally activated STAT3.
Vimentin is immediately synthesized in axons in response to Aβ1–42
To identify which proteins might be locally synthesized and form a retrograde signaling complex in Aβ1–42‐treated axons, we compiled a list of proteins that have been described to play roles in retrograde injury signaling 13, 14, 16 and cross‐referenced this list with published axonal transcriptomes from adult or mature neurons 30, 31, 32, 33, including our own transcriptome from non‐Aβ1–42‐treated axons 7 (Table 1). Three of these transcripts, coding for importin‐β, STAT3, and vimentin, were found not only in our published transcriptome but also in at least one other published transcriptome.
Table 1.
Presence of candidate molecules in axonal transcriptomes
| Encoded protein | Function in injury signaling | Adult rat hippocampal neurons 7 | Adult mouse DRG neurons 30 | Stage 32 Xenopus retinal ganglion cells 32 | Adult mouse cortical neurons 31 | Adult mouse motorneurons 33 |
|---|---|---|---|---|---|---|
| Importin‐β 13 | Nuclear import | X | X | |||
| STAT3 16 | Transcription | X | X | X | ||
| Vimentin 14 | Scaffolding | X | X | X | X |
We focused on Vim, which encodes vimentin, as it was found most consistently in published axonal transcriptomes and was found at significantly higher levels in our own transcriptome compared to Stat3 and Kpnb1, the mRNA encoding importin‐β. The FPKM value for Vim in our previously reported transcriptome of untreated hippocampal axons was lower than the value for Actb (encoding β‐actin, one of the most abundant mRNAs in axons) but still well above background levels (Fig 6A). qRT–PCR on axonal RNAs confirmed the presence of Vim (Fig 6A). To determine whether vimentin was locally synthesized in Aβ1–42‐treated axons, we measured vimentin protein levels 15 and 30 min after Aβ1–42 treatment. After 15 min, we detected a non‐significant trend toward increased axonal vimentin levels (Fig EV3), while after 30 min, we observed a significant decrease in axonal vimentin levels compared to vehicle‐treated axons (Fig 6B). This result was not unexpected as our evidence suggests that the locally synthesized proteins might be retrogradely transported to the nucleus and thus disappear from axons. Indeed, in axons pre‐treated with the dynein inhibitor ciliobrevin A, vimentin levels were increased upon exposure to Aβ1–42, and transfection with siRNA targeting Vim mRNA abolished this effect (Fig 6C). In injured axons, vimentin is required to translocate p‐ERK from the axons to the cell soma 14. In response to axonal Aβ1–42 treatment, we did not detect changes in ERK or phospho‐ERK levels in the cell body, suggesting a different cargo for vimentin (Fig EV4). Together, these data suggest that upon its Aβ1–42‐induced axonal synthesis, vimentin is retrogradely trafficked to the cell body, as is seen in injured axons.
Figure 6. Aβ1–42‐dependent axonal Atf4 translation requires immediate axonal Vim translation.
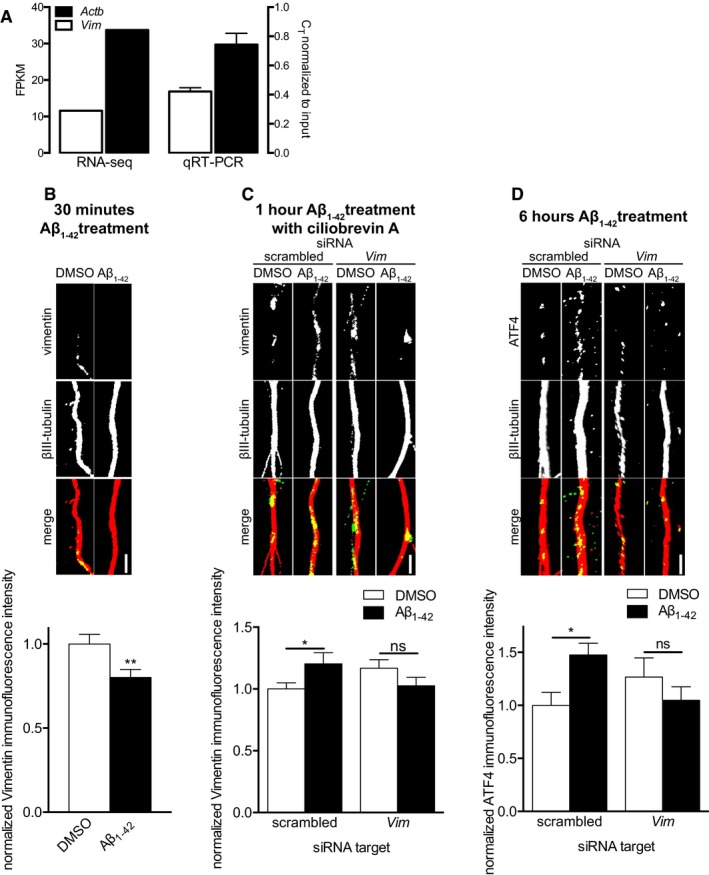
- Hippocampal neurons were grown in microfluidic chambers for 10–11 DIV, the RNA from the axonal compartment was harvested and mRNA levels for β‐actin (Actb) and vimentin (Vim) were determined by RNA‐Seq (left, data from Baleriola et al 7) and qRT–PCR (right). By both methods, vimentin transcripts are readily detectable at lower but comparable levels to β‐actin transcripts, one of the most abundant transcripts in axons. Mean ± SEM of three independently performed experiments (n = 3) each with triplicate qRT–PCR measurements.
- Hippocampal neurons were cultured in microfluidic chambers for 11–12 DIV, and axons were treated with vehicle or Aβ1–42 for 30 min. Axons were immunostained for vimentin and βIII‐tubulin. Mean ± SEM of 30 optical fields per condition (n = 6 independently performed experiments per group). **P < 0.01; unpaired t‐test.
- Hippocampal neurons were cultured in microfluidic chambers for 10–11 DIV, and axons were transfected with scrambled or Vim‐targeting siRNA. 24 h after transfection, axons were treated with ciliobrevin A for 45 min followed by vehicle or Aβ1–42 for 1 h. Axons were immunostained for vimentin and βIII‐tubulin. Mean ± SEM of 43–45 optical fields per condition (n = 9 independently performed experiments per group). *P < 0.05; ns, not significant; Holm–Sidak multiple t‐tests.
- Hippocampal neurons were cultured in microfluidic chambers for 10–11 DIV, and axons were transfected with scrambled or Vim‐targeting siRNA. 24 h after transfection, axons were treated with vehicle or Aβ1–42 for 6 h. Axons were immunostained for ATF4 and βIII‐tubulin. Mean ± SEM of 30–35 optical fields per condition (n = 6–7 independently performed experiments per group). *P < 0.05; ns, not significant; Holm–Sidak multiple t‐tests.
Figure EV3. Effect of 15‐min treatment on axonal vimentin levels.
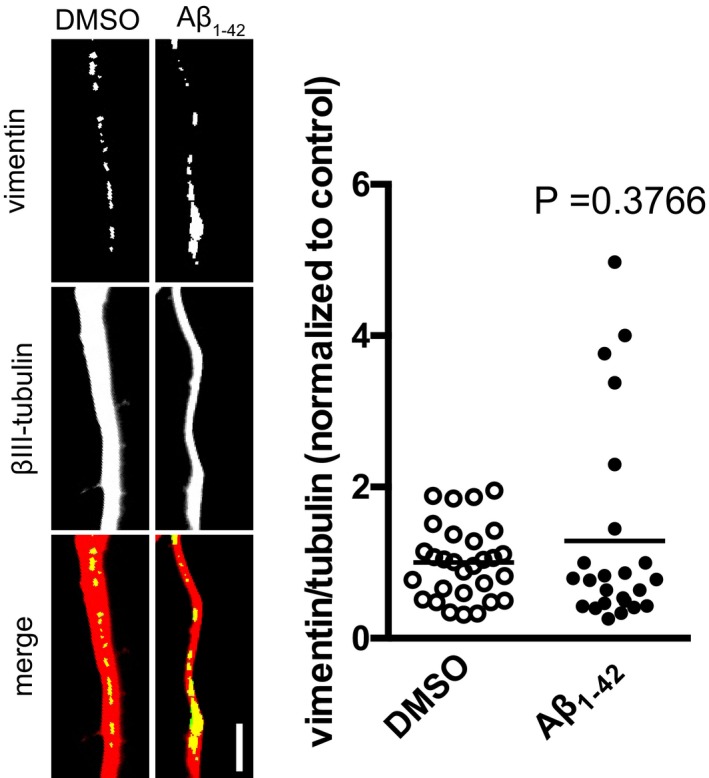
Hippocampal neurons were cultured in microfluidic chambers for 11–12 DIV, and axons were treated with vehicle or Aβ1–42 for 15 min. Axons were immunostained for vimentin and βIII‐tubulin, and the vimentin signal was normalized to the βIII‐tubulin signal. Mean of 24–29 optical fields per condition (sampled from 5 to 6 coverslips per condition) from one primary culture. Unpaired t‐test. Scale bar, 5 μm.
Figure EV4. ERK and phospho‐ERK levels in the cell body are not affected by axonal Aβ1–42 treatment.

Hippocampal neurons were cultured in microfluidic chambers for 10–11 DIV, and axons were transfected with scrambled or Vim‐targeting siRNA. 24 h after transfection, axons were treated with vehicle or Aβ1–42 for 1 h. ERK and phosphor‐ERK levels were determined by quantitative immunocytochemistry. Mean ± SEM of 24–30 optical fields per condition (n = 3 independently performed experiments per group). No significant differences were detected between DMSO and Aβ1–42 neurons; two‐way ANOVA with Bonferroni's multiple comparisons test.
Immediate vimentin synthesis is required for Atf4 translation
To determine whether local synthesis of vimentin played a role in regulating the recruitment or translation of Atf4 mRNA in axons, we transfected axons with scrambled or Vim‐targeting siRNAs prior to the 6 h Aβ1–42 treatment. Axons transfected with a scrambled, non‐targeting siRNA showed a significant increase in ATF4 levels between vehicle‐ and Aβ1–42‐treated axons, as we have seen previously. However, when axons were transfected with siRNA targeting Vim, axons no longer showed significant increases in ATF4 protein in response to Aβ1–42 (Fig 6D).
Discussion
Here, we report that exposure of axons to oligomeric Aβ1–42 within minutes triggers the translation of at least one, but likely several, axonally localized transcripts. Our study was in part motivated by findings that injured axons of the peripheral nervous system rapidly synthesize proteins that signal retrogradely to the nucleus to enable pro‐regenerative gene expression 16, 34. We wondered whether the generation of such retrograde signaling complexes through local translation might be a general axonal response to harmful events in neurons of both the peripheral and central nervous systems. Indeed, we found that immediate local protein synthesis is a shared response mechanism to both axonal injury and exposure to Aβ1–42 but the identities of the synthesized proteins are distinct between the insults. For example, while STAT3 is produced in injured axons 16, we did not detect any local STAT3 synthesis in Aβ1–42‐treated axons. In contrast, both injury and Aβ1–42 exposure trigger the local synthesis of vimentin, indicating that it might be central for the assembly or function of retrograde signaling complexes. A function of vimentin as a scaffolding protein has been revealed in injured axons, where axonally derived vimentin acts by linking activated ERK with importin‐β, thereby enabling its retrograde transport and somatic localization 14. The local translation of vimentin might be part of creating a retrograde signaling platform that is common to a diverse range of insults, while the identity of the retrogradely transported signaling molecules differs between neurons and insults. For example, we did not detect any change in ERK levels in the cell bodies, while in injured axons, vimentin is required to retrograde transport activated ERK 14. A role of vimentin in AD pathogenesis is strongly supported by the finding that its expression levels are greatly upregulated in neurons in AD brains compared to age‐matched controls 35. It is likely that the locally produced retrograde signaling molecules include context‐specific transcription factors, especially as we found that axonally sensed Aβ1–42 induces a rapid and transient transcription‐dependent increase in somatic Atf4 levels.
Although STAT3 does not act as an axonally derived transcription factor in response to Aβ1–42, as it does in response to nerve injury 16, we found that it is locally activated by phosphorylation in axons in response to Aβ1–42. We did not detect transport of the activated STAT3 to the cell body, suggesting a non‐nuclear role for activated STAT3 in Aβ1–42‐treated axons. For example, phosphorylated STAT3 can regulate axonal microtubule stability via interaction with stathmin or change ATP synthesis via association with PDC‐E1 in mitochondria 36, 37, 38.
Our results further support the notion that similar to peripheral neurons, axons of mature central nervous system contain transcripts and are capable of protein synthesis and that axonal translation in both contexts is required for transmitting information concerning injurious events to the neuronal soma. While this concept has been considered for a long time a “heretical hypothesis” 39, it is now becoming increasingly clear that local protein synthesis is an important response mechanism to changes in an axon's environment. That the levels of mRNAs and protein synthesis in mature axons are lower than those in developing axons or in dendrites is likely a reflection of a reduced demand for mature axons to response acutely to extracellular signals rather than of an inability to synthesize proteins. In fact, not only harmful signals trigger protein synthesis in post‐developmental axons, but it is also required for axonal maintenance and affects vesicle release at presynapses 10, 11. The development of highly sensitive techniques, such as compartment‐specific translatome analysis 12, will further aid in identifying additional functions for protein synthesis in axonal physiology, injury, and degeneration.
Materials and Methods
Compartmentalized neuronal culture
All reagents were from Thermo Fisher Scientific (Waltham, MA) unless otherwise noted. Microfluidic devices were made using a Dow Corning Sylgard 184 Silicone Encapsulant Clear Kit (Ellsworth Adhesives, Germantown, WI) at a 10:1 mix ratio. Chambers were cured at 70°C for ≥ 4 h. Prior to culturing, chambers were washed in ethanol and air‐dried. Glass coverslips (25 mm; Carolina Biological Supply Company, Burlington, NC) were coated in 0.01 mg ml−1 poly‐d‐lysine (Sigma‐Aldrich, St. Louis, MO) followed by 2 μg ml−1 laminin. Pregnant Sprague Dawley rats (Charles River, Kingston, NY) were euthanized on embryonic day 18 using carbon dioxide followed by thoracic thoracotomy. All rodent procedures were approved by Columbia University Institutional Animal Care and Use Committee. Hippocampi were dissected from the brains of embryos and were subsequently incubated in TrypLE Express at 37°C. Hippocampi were washed in Hank's balanced salt solution and resuspended in plating medium (10% fetal bovine serum, 2 mM L‐glutamine, 50 U ml−1 penicillin–streptomycin, 1 mM sodium pyruvate in Neurobasal). Hippocampi were dissociated via trituration with a pipette followed by a flame‐polished Pasteur pipette. After dissociation, cells were passed through a 40‐μm cell strainer (VWR, Radnor, PA) and then centrifuged at 800 rpm for 5 min at 4°C. Cells were resuspended in plating medium to a final concentration of 5,500,000 cells ml−1. 10 μl of cell suspension was added to each chamber, resulting in 55,000 cells per chamber. Cells were allowed to settle at 37°C, and then, plating medium was added to the somatic compartments and cells were returned to incubator. On DIV1, plating medium was replaced with growth medium (1× B‐27 supplement, 2 mM L‐glutamine in Neurobasal). On DIV4‐5, half of the medium was replaced with fresh growth medium containing 20 μM 5‐fluorodeoxyuridine and 20 μM uridine to prevent glial proliferation. All cells were cultured 11–12 days before treatment.
Oligomeric Aβ1–42 preparation
Synthetic Aβ1–42 peptides (purchased from Dr. David Teplow, UCLA) were dissolved to 1 mM hexafluoroisopropanol and dried using a SpeedVac. The peptides were resuspended to 1 mM in DMSO by bath sonication for 10 min. Solution was then aliquoted and stored at −20°C. For oligomer formation, the peptides were diluted to 100 μM in PBS and incubated overnight at 4°C. Oligomerized peptides were diluted to 33 μM in growth medium and were added to axonal compartments for a final concentration of 3 μM.
Inhibitors
To inhibit axonal protein translation, axons were treated with 100 nM emetine (EMD Millipore, Billerica, MA) 45 min prior to Aβ1–42 treatment. To prevent retrograde transport, axons were treated with 5 μM HPI‐4 (Sigma‐Aldrich) 45 min prior to Aβ1–42 treatment. To chelate intra‐cellular calcium, axons were treated with 10 μM BAPTA‐AM 30 min prior to Aβ1–42 treatment. To inhibit transcription, cell bodies were treated with 40 μM actinomycin D (Sigma‐Aldrich) immediately prior to Aβ1–42 treatment.
siRNA transfection
siRNAs were transfected to a final concentration of 50 nM using NeuroPORTER Reagent (Genlantis, San Diego, CA) according to manufacturer's instructions 24 h prior to Aβ1–42 treatment. Briefly, siRNAs were incubated in a NeuroPORTER solution in growth medium for 15 min at room temperature to form siRNA complexes. Half of the culture medium was removed, and complexes were added to cells. Neurons were incubated at 37°C for 2 h. Axons were supplemented with growth medium containing 2× B‐27 and were incubated at 37°C for an additional 22 h.
scrambled siRNA sequence: 5′‐CCCUUCGUUCCUUCCAAUCUGUCCA‐3′
Atf4 siRNA sequence: 5′‐AACCCAUGAGGUUUGAAGAGCUUGG‐3′
Stat3 siRNA sequence: 5′‐UUCCAUUGGCUUCUCAAGAUACCUG‐3′
Vim siRNA sequence: 5′‐CACCUGCGAAGUGGAUGCCCUUAAA‐3′
Immunofluorescence
Neurons were fixed with 4% paraformaldehyde (PFA) in cytoskeletal preservation buffer (10 mM MES, 138 mM KCl, 3 mM MgCl2, 2 mM EGTA, 320 mM sucrose, pH 6.1) for 20 min at room temperature. Cells were washed with PBS (three times; 5 min each) and blocked for 30 min with 3 mg ml−1 BSA, 100 mM glycine, 0.25% Triton X‐100 in 1× PBS. Samples were incubated overnight at 4°C with primary antibodies against 4EBP1 (1:500, ab37225, Abcam), p‐4EBP1 (1:500, #2855, Cell Signaling Technology, Danvers, MA), S6 (1:500, #2317, Cell Signaling Technology), p‐S6 (1:1,000, #4858, Cell Signaling Technology), vimentin (1:250, ab92547, Abcam, Cambridge, MA), p‐STAT3 (Tyr705, 1:100, #9131, Cell Signaling Technology), STAT3 (1:1,600, #9139, Cell Signaling Technology), βIII‐tubulin (1:500, PRB‐435B, Covance, Dedham, MA), Tau (1:500, A00393, GenScript, Piscataway, NJ), ERK (1:500, #4696, Cell Signaling Technology), p‐ERK (1:500, #4370, Cell Signaling Technology), or ATF4 (1:1,000, ab50546, Abcam). Samples were washed with PBS (three times; 5 min each) and incubated for 1 h at room temperature with fluorophore‐conjugated Alexa secondary antibodies (1:500). Samples were washed with PBS (three times; 5 min each), dipped in distilled water, and air‐dried. Samples were mounted with ProLong Diamond antifade reagent and imaged using an EC Plan‐Neofluar 40×/1.3 objective on an Axio‐Observer.Z1 microscope equipped with an AxioCam MRm Rev. 3 camera (Zeiss, Thornwood, NY).
Fluorescent in situ hybridization
Antisense riboprobes were transcribed in vitro from sense oligonucleotides using the MEGAshortscript kit with digoxigenin‐labeled UTP (Roche Applied Sciences, Indianapolis, IN) according to the manufacturer's instructions. Five non‐overlapping probes recognizing Egfp (negative control) or Atf4 mRNA were used for FISH staining. All sense oligonucleotides used were transcribed using a T7 promoter site (…GCCCTATAGTGAGTCGTATTAC‐3′) at the 3′ end.
Egfp.1, 5′‐GATGCCACCTACGGCAAGCTGACCCTGAAGTTCATCTGCACCACCGGCAA…
Egfp.2, 5′‐GACCACATGAAGCAGCACGACTTCTTCAAGTCCGCCATGCCCGAAGGCTA…
Egfp.3, 5′‐ACTTCAAGGAGGACGGCAACATCCTGGGGCACAAGCTGGAGTACAACTAC…
Egfp.4, 5′‐AAGCAGAAGAACGGCATCAAGGTGAACTTCAAGATCCGCCACAACATCGA…
Egfp.5, 5′‐AGTTCGTGACCGCCGCCGGGATCACTCTCGGCATGGACGAGCTGTACAAG…
Atf4.1, 5′‐AGCCCCCTCAGACAGTGAACCCAATTGGCCATCTCCCAGAAAGTGTAATA…
Atf4.2, 5′‐GTTAAGCACATTCCTCGATACCAGCAAATCCCTACAACATGACCGAGATG…
Atf4.3, 5′‐AAGGAGGAAGACACTCCCTCTGATAGTGACAGTGGCATCTGTATGAGCCC…
Atf4.4, 5′‐CTTAGATGACTATCTGGAGGTGGCCAAGCACTTCAAACCTCATGGGTTCT…
Atf4.5, 5′‐AACGAGGCTCTGAAAGAGAAGGCAGATTCTCTCGCCAAAGAGATTCAGTA…
T7, 5′‐GTAATACGACTCACTATAGGGC‐3′
FISH was performed as previously described 17. Cells were fixed with 4% paraformaldehyde (PFA) in cytoskeletal preservation buffer (10 mM MES, 138 mM KCl, 3 mM MgCl2, 2 mM EGTA, 320 mM sucrose, pH 6.1) for 20 min at room temperature. Samples were washed in PBS (three times; 5 min each), permeabilized with 0.5% Triton X‐100 in PBS for 30 min at room temperature, and then washed again (three times; 5 min each). Samples were incubated with a total of 125 ng of digoxigenin‐labeled riboprobe (25 ng each) in 25 μl hybridization buffer overnight at 37°C. Cells were then washed in 50% formamide/2× SSC (30 min with agitation at 37°C) followed by another wash in 50% formamide/1× SSC (30 min with agitation at 37°C). Samples were washed further in 1× SSC (three times; 15 min each) and 0.1% Tween in PBS (three times; 5 min each). Samples were blocked with 3% BSA in PBS‐T for 30 min at room temperature and were incubated overnight at 4°C in primary antibodies against digoxin (1:500, Sigma‐Aldrich) and β‐III‐tubulin (1:500, Covance). Cells were washed with PBS‐T (three times; 5 min each) and then further incubated with fluorophore‐conjugated Alexa secondary antibodies (1:500). Samples were washed with PBS‐T (three times; 5 min each), dipped in distilled water, and air‐dried. Samples were mounted with ProLong Diamond antifade reagent.
Puromycylation assay
Neurons were incubated with 2 μM puromycin and incubated at 37°C for 10 or 15 min. To inhibit translation, neurons were co‐incubated with 10 μM anisomycin (Sigma‐Aldrich). Medium was aspirated, and cells were washed twice with pre‐warmed 1× PBS. Cells were fixed with 4% paraformaldehyde (PFA) in cytoskeletal preservation buffer (10 mM MES, 138 mM KCl, 3 mM MgCl2, 2 mM EGTA, 320 mM sucrose, pH 6.1) for 20 min at room temperature. Cells were washed with PBS (three times; 5 min each) and blocked for 30 min with 3 mg ml−1 BSA, 100 mM glycine, and 0.25% Triton X‐100 in 1× PBS. Samples were washed with PBS (three times; 5 min each) and incubated overnight at 4°C with primary antibodies against puromycin (1:250, MABE343, EMD Millipore) and βIII‐tubulin (1:500, PRB‐435B, Covance) or MAP2 (1:500, Abcam). Samples were washed with PBS (three times; 5 min each) and incubated for 1 h at room temperature with fluorophore‐conjugated Alexa secondary antibodies (1:500). Samples were washed with PBS (three times; 5 min each), dipped in distilled water, and air‐dried. Samples were mounted with ProLong Diamond antifade reagent.
Image acquisition and analysis
Image acquisition was determined automatically on a random field of a control sample, ensuring pixel intensities were within the linear range and avoiding pixel saturation using AxioVision acquisition software (Zeiss). Acquisition settings were kept the constant for all samples of an experiment. Optical fields were chosen using the counterstaining channel to ensure blind acquisition of the staining of interest. A region of interest (ROI; total axonal area) was demarked in the counterstaining channel and average pixel intensity within the ROI was measured in all channels. Background pixel intensity was calculated in an area outside the ROI and subtracted from the measurements. For presentation in figures, the grayscale images were converted to RGB and contrast and background settings were set the same in control and experimental conditions. Images shown are of optical fields representing the average.
Quantitative RT–PCR
Total RNA was extracted from somatic compartments and purified using the PrepEase RNA isolation kit (Affymetrix, Santa Clara, CA) and concentrated with RNeasy MinElute Cleanup Kit (QIAGEN, Valencia, CA). Reverse transcription was performed with 100 ng RNA using SuperScript III First‐Strand Synthesis SuperMix for qRT–PCR according to the manufacturer's instructions using the following conditions: 25°C for 10 min, 50°C for 30 min, 85°C for 5 min and finally 4°C. Quantitative PCR was performed with TaqMan Gene Expression Master Mix in a StepOnePlus Real‐Time PCR instrument using the following conditions: an initial denaturation step at 95°C for 10 min, followed by 40 cycles of denaturation at 95°C for 15 s and extension at 60°C for 1 min. Atf4 gene expression set (Rn00824644_g1) was used. Gene expression was normalized to Gapdh gene expression set (Rn01775763_g1).
Calcium recording in microfluidic chambers
To test the effect of oligomeric Aβ1–42 on calcium levels in axons, time‐lapse fluorescence microscopy was performed on an Axio‐Observer.Z1 microscope equipped with an AxioCam MRm Rev. Three camera (Zeiss). Hippocampal neurons were grown in microfluidic chambers for ≥ 10 DIV. Axons were treated with 2.5 μM Fluo4‐AM (Molecular Probes) in culture medium for 15 min. Culture medium was replaced with recording medium containing 20 mM HEPES, 10 mM glucose, and 2 mM CaCl2 in HBSS, and cells were incubated at 37°C, 5% CO2 for 10 min. Axons were treated with DMSO or Aβ1–42 and immediately imaged under a 40× objective. Each axonal field was observed for 5 min.
Calcium imaging in distal neurites
Neurons grown in regular cultures at low density (5,000 cells cm−2) for > 10 DIV were loaded with 5 μM Fura2‐AM (Molecular Probes) in culture medium for 30 min at 37°C. Cells were washed in HBSS containing 20 mM HEPES, pH 7.4, 10 mM glucose, and 2 mM CaCl2 (incubation buffer) for 10 min at room temperature. Experiments were performed in a coverslip chamber continuously perfused with incubation buffer at 4 ml min−1. The perfusion chamber was mounted on the stage of an inverted epifluorescence microscope (Zeiss Axiovert 35, Oberkochen, Germany) equipped with a 150W xenon lamp Polychrome V (T.I.L.L. Photonics, Martinsried, Germany) and a Plan‐Neofluar 40× oil immersion objective (Zeiss). Cells were visualized with a high‐resolution digital black/white CCD camera (ORCA C4742‐80‐12 AG; Hamamatsu Photonics Iberica).
Statistical analysis
Statistical analysis was performed using GraphPad Prism 7 software (GraphPad Software, Inc; La Jolla, CA). When comparing the means of two groups, an unpaired t‐test was performed. When comparing the means of three independent groups, a one‐way analysis of variance (ANOVA) with Bonferroni's multiple comparisons tests was performed. When comparing the means of multiple groups encompassing two independent variables, two‐way ANOVA with Bonferroni's multiple comparisons tests (time courses) or Holm–Sidak multiple t‐tests (siRNAs, pharmacological inhibitors) were performed.
Author contributions
UH conceived the project, and CAW, JB, and UH designed the experiments. CAW with LKR and JB performed most experiments and data analysis. JB, CM, and EA performed the calcium imaging experiments. CAW and UH wrote the paper.
Conflict of interest
The authors declare that they have no conflict of interest.
Supporting information
Expanded View Figures PDF
Review Process File
Acknowledgements
C.A.W. was supported by the National Institute on Aging (R36AG050696), L.K.R. was supported by a training grant from the Eunice Kennedy Shriver National Institute of Child Health and Human Development (T32HD007430), C.M. and E.A. received funding from the Ministerio de Economía y Competitividad (MINECO, SAF2016‐75292‐R), and J.B. from IKERBASQUE and the Ministerio de Economía y Competitividad (MINECO, SAF2016‐76347‐R). U.H. was supported by grants from the National Institute of Mental Health (R01MH096702), the BrightFocus Foundation, and the Irma T. Hirschl Trust.
EMBO Reports (2018) 19: e45435
References
- 1. Pearson RC, Esiri MM, Hiorns RW, Wilcock GK, Powell TP (1985) Anatomical correlates of the distribution of the pathological changes in the neocortex in Alzheimer disease. Proc Natl Acad Sci USA 82: 4531–4534 [DOI] [PMC free article] [PubMed] [Google Scholar]
- 2. Khan UA, Liu L, Provenzano FA, Berman DE, Profaci CP, Sloan R, Mayeux R, Duff KE, Small SA (2014) Molecular drivers and cortical spread of lateral entorhinal cortex dysfunction in preclinical Alzheimer's disease. Nat Neurosci 17: 304–311 [DOI] [PMC free article] [PubMed] [Google Scholar]
- 3. Lacor PN, Buniel MC, Furlow PW, Clemente AS, Velasco PT, Wood M, Viola KL, Klein WL (2007) Abeta oligomer‐induced aberrations in synapse composition, shape, and density provide a molecular basis for loss of connectivity in Alzheimer's disease. J Neurosci 27: 796–807 [DOI] [PMC free article] [PubMed] [Google Scholar]
- 4. Krstic D, Knuesel I (2013) Deciphering the mechanism underlying late‐onset Alzheimer disease. Nat Rev Neurol 9: 25–34 [DOI] [PubMed] [Google Scholar]
- 5. Liu Y, Yoo MJ, Savonenko A, Stirling W, Price DL, Borchelt DR, Mamounas L, Lyons WE, Blue ME, Lee MK (2008) Amyloid pathology is associated with progressive monoaminergic neurodegeneration in a transgenic mouse model of Alzheimer's disease. J Neurosci 28: 13805–13814 [DOI] [PMC free article] [PubMed] [Google Scholar]
- 6. Marcyniuk B, Mann DM, Yates PO (1986) The topography of cell loss from locus caeruleus in Alzheimer's disease. J Neurol Sci 76: 335–345 [DOI] [PubMed] [Google Scholar]
- 7. Baleriola J, Walker CA, Jean YY, Crary JF, Troy CM, Nagy PL, Hengst U (2014) Axonally synthesized ATF4 transmits a neurodegenerative signal across brain regions. Cell 158: 1159–1172 [DOI] [PMC free article] [PubMed] [Google Scholar]
- 8. Holt CE, Schuman EM (2013) The central dogma decentralized: new perspectives on RNA function and local translation in neurons. Neuron 80: 648–657 [DOI] [PMC free article] [PubMed] [Google Scholar]
- 9. Jung H, Gkogkas CG, Sonenberg N, Holt CE (2014) Remote control of gene function by local translation. Cell 157: 26–40 [DOI] [PMC free article] [PubMed] [Google Scholar]
- 10. Yoon BC, Jung H, Dwivedy A, O'Hare CM, Zivraj KH, Holt CE (2012) Local translation of extranuclear lamin B promotes axon maintenance. Cell 148: 752–764 [DOI] [PMC free article] [PubMed] [Google Scholar]
- 11. Taylor AM, Wu J, Tai HC, Schuman EM (2013) Axonal translation of beta‐catenin regulates synaptic vesicle dynamics. J Neurosci 33: 5584–5589 [DOI] [PMC free article] [PubMed] [Google Scholar]
- 12. Shigeoka T, Jung H, Jung J, Turner‐Bridger B, Ohk J, Lin JQ, Amieux PS, Holt CE (2016) Dynamic axonal translation in developing and mature visual circuits. Cell 166: 181–192 [DOI] [PMC free article] [PubMed] [Google Scholar]
- 13. Hanz S, Perlson E, Willis D, Zheng JQ, Massarwa R, Huerta JJ, Koltzenburg M, Kohler M, van‐Minnen J, Twiss JL et al (2003) Axoplasmic importins enable retrograde injury signaling in lesioned nerve. Neuron 40: 1095–1104 [DOI] [PubMed] [Google Scholar]
- 14. Perlson E, Hanz S, Ben‐Yaakov K, Segal‐Ruder Y, Seger R, Fainzilber M (2005) Vimentin‐dependent spatial translocation of an activated MAP kinase in injured nerve. Neuron 45: 715–726 [DOI] [PubMed] [Google Scholar]
- 15. Yudin D, Hanz S, Yoo S, Iavnilovitch E, Willis D, Gradus T, Vuppalanchi D, Segal‐Ruder Y, Ben‐Yaakov K, Hieda M et al (2008) Localized regulation of axonal RanGTPase controls retrograde injury signaling in peripheral nerve. Neuron 59: 241–252 [DOI] [PMC free article] [PubMed] [Google Scholar]
- 16. Ben‐Yaakov K, Dagan SY, Segal‐Ruder Y, Shalem O, Vuppalanchi D, Willis DE, Yudin D, Rishal I, Rother F, Bader M et al (2012) Axonal transcription factors signal retrogradely in lesioned peripheral nerve. EMBO J 31: 1350–1363 [DOI] [PMC free article] [PubMed] [Google Scholar]
- 17. Hengst U, Deglincerti A, Kim HJ, Jeon NL, Jaffrey SR (2009) Axonal elongation triggered by stimulus‐induced local translation of a polarity complex protein. Nat Cell Biol 11: 1024–1030 [DOI] [PMC free article] [PubMed] [Google Scholar]
- 18. Taylor AM, Blurton‐Jones M, Rhee SW, Cribbs DH, Cotman CW, Jeon NL (2005) A microfluidic culture platform for CNS axonal injury, regeneration and transport. Nat Methods 2: 599–605 [DOI] [PMC free article] [PubMed] [Google Scholar]
- 19. Toepke MW, Beebe DJ (2006) PDMS absorption of small molecules and consequences in microfluidic applications. Lab Chip 6: 1484–1486 [DOI] [PubMed] [Google Scholar]
- 20. Schmidt EK, Clavarino G, Ceppi M, Pierre P (2009) SUnSET, a nonradioactive method to monitor protein synthesis. Nat Methods 6: 275–277 [DOI] [PubMed] [Google Scholar]
- 21. Yarmolinsky MB, Haba GL (1959) Inhibition by puromycin of amino acid incorporation into protein. Proc Natl Acad Sci USA 45: 1721–1729 [DOI] [PMC free article] [PubMed] [Google Scholar]
- 22. Demuro A, Parker I, Stutzmann GE (2010) Calcium signaling and amyloid toxicity in Alzheimer disease. J Biol Chem 285: 12463–12468 [DOI] [PMC free article] [PubMed] [Google Scholar]
- 23. Resende R, Ferreiro E, Pereira C, Resende de Oliveira C (2008) Neurotoxic effect of oligomeric and fibrillar species of amyloid‐beta peptide 1‐42: involvement of endoplasmic reticulum calcium release in oligomer‐induced cell death. Neuroscience 155: 725–737 [DOI] [PubMed] [Google Scholar]
- 24. Kuchibhotla KV, Goldman ST, Lattarulo CR, Wu HY, Hyman BT, Bacskai BJ (2008) Abeta plaques lead to aberrant regulation of calcium homeostasis in vivo resulting in structural and functional disruption of neuronal networks. Neuron 59: 214–225 [DOI] [PMC free article] [PubMed] [Google Scholar]
- 25. Demuro A, Smith M, Parker I (2011) Single‐channel Ca(2 + ) imaging implicates Abeta1‐42 amyloid pores in Alzheimer's disease pathology. J Cell Biol 195: 515–524 [DOI] [PMC free article] [PubMed] [Google Scholar]
- 26. Hengst U, Cox LJ, Macosko EZ, Jaffrey SR (2006) Functional and selective RNA interference in developing axons and growth cones. J Neurosci 26: 5727–5732 [DOI] [PMC free article] [PubMed] [Google Scholar]
- 27. Gracias NG, Shirkey‐Son NJ, Hengst U (2014) Local translation of TC10 is required for membrane expansion during axon outgrowth. Nat Commun 5: 3506 [DOI] [PMC free article] [PubMed] [Google Scholar]
- 28. Villarin JM, McCurdy EP, Martinez JC, Hengst U (2016) Local synthesis of dynein cofactors matches retrograde transport to acutely changing demands. Nat Commun 7: 13865 [DOI] [PMC free article] [PubMed] [Google Scholar]
- 29. Zhong Z, Wen Z, Darnell JE Jr (1994) Stat3: a STAT family member activated by tyrosine phosphorylation in response to epidermal growth factor and interleukin‐6. Science 264: 95–98 [DOI] [PubMed] [Google Scholar]
- 30. Gumy LF, Yeo GS, Tung YC, Zivraj KH, Willis D, Coppola G, Lam BY, Twiss JL, Holt CE, Fawcett JW (2011) Transcriptome analysis of embryonic and adult sensory axons reveals changes in mRNA repertoire localization. RNA 17: 85–98 [DOI] [PMC free article] [PubMed] [Google Scholar]
- 31. Taylor AM, Berchtold NC, Perreau VM, Tu CH, Li Jeon N, Cotman CW (2009) Axonal mRNA in uninjured and regenerating cortical mammalian axons. J Neurosci 29: 4697–4707 [DOI] [PMC free article] [PubMed] [Google Scholar]
- 32. Zivraj KH, Tung YC, Piper M, Gumy L, Fawcett JW, Yeo GS, Holt CE (2010) Subcellular profiling reveals distinct and developmentally regulated repertoire of growth cone mRNAs. J Neurosci 30: 15464–15478 [DOI] [PMC free article] [PubMed] [Google Scholar]
- 33. Saal L, Briese M, Kneitz S, Glinka M, Sendtner M (2014) Subcellular transcriptome alterations in a cell culture model of spinal muscular atrophy point to widespread defects in axonal growth and presynaptic differentiation. RNA 20: 1789–1802 [DOI] [PMC free article] [PubMed] [Google Scholar]
- 34. Terenzio M, Koley S, Samra N, Rishal I, Zhao Q, Sahoo PK, Urisman A, Marvaldi L, Oses‐Prieto JA, Forester C et al (2018) Locally translated mTOR controls axonal local translation in nerve injury. Science 359: 1416–1421 [DOI] [PMC free article] [PubMed] [Google Scholar]
- 35. Levin EC, Acharya NK, Sedeyn JC, Venkataraman V, D'Andrea MR, Wang HY, Nagele RG (2009) Neuronal expression of vimentin in the Alzheimer's disease brain may be part of a generalized dendritic damage‐response mechanism. Brain Res 1298: 194–207 [DOI] [PubMed] [Google Scholar]
- 36. Selvaraj BT, Frank N, Bender FL, Asan E, Sendtner M (2012) Local axonal function of STAT3 rescues axon degeneration in the pmn model of motoneuron disease. J Cell Biol 199: 437–451 [DOI] [PMC free article] [PubMed] [Google Scholar]
- 37. Xu YS, Liang JJ, Wang Y, Zhao XJ, Xu L, Xu YY, Zou QC, Zhang JM, Tu CE, Cui YG et al (2016) STAT3 undergoes acetylation‐dependent mitochondrial translocation to regulate pyruvate metabolism. Sci Rep 6: 39517 [DOI] [PMC free article] [PubMed] [Google Scholar]
- 38. Luo X, Ribeiro M, Bray ER, Lee DH, Yungher BJ, Mehta ST, Thakor KA, Diaz F, Lee JK, Moraes CT et al (2016) Enhanced transcriptional activity and mitochondrial localization of STAT3 co‐induce axon regrowth in the adult central nervous system. Cell Rep 15: 398–410 [DOI] [PMC free article] [PubMed] [Google Scholar]
- 39. Perry RB, Fainzilber M (2014) Local translation in neuronal processes–in vivo tests of a “heretical hypothesis”. Dev Neurobiol 74: 210–217 [DOI] [PubMed] [Google Scholar]
Associated Data
This section collects any data citations, data availability statements, or supplementary materials included in this article.
Supplementary Materials
Expanded View Figures PDF
Review Process File


