

Abstract
Membrane contact sites are cellular structures that mediate interorganelle exchange and communication. The two major tether proteins of the endoplasmic reticulum (ER), VAP‐A and VAP‐B, interact with proteins from other organelles that possess a small VAP‐interacting motif, named FFAT [two phenylalanines (FF) in an acidic track (AT)]. In this study, using an unbiased proteomic approach, we identify a novel ER tether named motile sperm domain‐containing protein 2 (MOSPD2). We show that MOSPD2 possesses a Major Sperm Protein (MSP) domain which binds FFAT motifs and consequently allows membrane tethering in vitro. MOSPD2 is an ER‐anchored protein, and it interacts with several FFAT‐containing tether proteins from endosomes, mitochondria, or Golgi. Consequently, MOSPD2 and these organelle‐bound proteins mediate the formation of contact sites between the ER and endosomes, mitochondria, or Golgi. Thus, we characterized here MOSPD2, a novel tethering component related to VAP proteins, bridging the ER with a variety of distinct organelles.
Keywords: endoplasmic reticulum, ER–organelle contact, FFAT motif, membrane contact site, VAP proteins
Subject Categories: Membrane & Intracellular Transport
Introduction
Eukaryotic cells are partitioned in discrete organelles which provide the cell with functionally specialized subregions. Organelles are interdependent units which are each delimited by membranes that constitute a barrier to the diffusion of soluble signaling molecules or metabolites. The formation of membrane contact sites (MCSs), where organelle membranes are in close apposition, supports their ability to communicate and exchange material. A variety of MCSs, in which the membranes of two distinct organelles are bridged, have been observed in cells. Although contacts were shown to exist between almost every type of organelle, the endoplasmic reticulum (ER) appears to be central for this kind of interorganelle communication 1, 2. Indeed, the ER is a network of tubes and sheets which extents throughout the cytoplasm and makes extensive contacts with most organelles 3.
The formation of MCSs primarily requires protein–lipid and/or protein–protein complexes to allow the tethering of organelles 4, 5, 6. Noteworthy, multiple molecular bridges between the ER and other organelles involve the same receptors on the ER, named VAPs (VAMP‐associated proteins) 7, 8. In human, there are two VAPs, VAP‐A and VAP‐B, which are anchored in the ER membrane by a C‐terminal transmembrane domain, and which interact with small motifs named FFAT (two phenylalanine in an acidic tract) using an N‐terminal and cytosolic MSP (major sperm protein) domain 9. FFAT motifs are found in a wide variety of proteins localized in MCSs between the ER and other organelles such as the Golgi, endosomes, mitochondria, peroxisomes, or the plasma membrane 8. VAP proteins build MCSs either by directly interacting with other membrane‐anchored proteins such as STARD3 and STARD3NL 10, or by interacting with soluble proteins that can also bind a second organelle, such as STARD11, PTPIP51, OSBP, ORP1L, and ORP3 11, 12, 13, 14, 15, 16, 17. MCSs scaffolded by VAPs and their interacting partners are involved in diverse biological functions, such as lipid transport, calcium homeostasis, signaling regulation, autophagy, and endosome dynamics 10, 11, 12, 14, 29, 30, 31.
Despite the prominent role of VAPs in tethering membranes, and transferring lipids and other metabolites, VAP‐deficient cells are viable and contacts between the ER and other organelles persist 16, 19, 24. These findings suggest that other tethering systems may compensate for the absence of VAP proteins to anchor FFAT‐containing proteins onto the ER and create MCSs; however, potential surrogates for VAPs have not yet been identified. In this study, using an unbiased proteomic approach in mammalian cells, we isolated a novel ER‐resident FFAT‐binding protein named MOSPD2.
Results
Identification of a novel FFAT motif‐interacting protein
Consistent with the notion that VAP‐independent tethering mechanisms exist, VAP silencing has only a moderate effect on contacts involving the ER. For instance, loss of VAP‐B only reduces ER–mitochondria contacts by 30% 16 and has no effect on ER–peroxisome contacts 25. The combined loss of VAP‐A and VAP‐B only decreases by half contacts with the ER in a subpopulation of endosomes and in lysosomes 24. This raises the possibility that the absence of VAP‐A and VAP‐B is compensated by (an)other protein(s) with similar functionalities and, notably, the ability to recruit FFAT‐containing proteins. To identify candidates, a pull‐down assay was performed using a synthetic and biotinylated peptide encompassing the FFAT motif of oxysterol‐binding protein‐related protein 1 (OSBPL1A aka ORP1) as a bait (Fig 1A). Its sequence fits to the consensus FFAT motif 9, 26. A non‐binding peptide with a random sequence was used as control (Fig 1A). These peptides were attached to streptavidin beads and further incubated with HeLa cell protein extracts. Bound proteins were eluted and analyzed by SDS–PAGE followed by silver nitrate staining (Fig 1B). Two major bands, with apparent molecular weights of ~ 30 and ~ 60 kDa, were visualized (Fig 1B). To identify the corresponding proteins, the whole elutions were analyzed by tandem mass spectrometry (MS/MS; Fig 1C). Identified proteins were ranked based on their enrichment in the FFAT peptide sample over the control peptide sample, and on their MS/MS score (Fig 1C). Consistent with the current knowledge, the first two hits identified were VAP‐A and VAP‐B. The third one corresponded to a poorly characterized protein named motile sperm domain–containing protein 2 (MOSPD2). MOSPD2 is a 518 residue protein composed of three structural domains (Fig 1D): an amino‐terminal CRAL/TRIO domain, named after cellular retinaldehyde‐binding protein (CRALBP) and triple functional domain protein (TRIO), which is potentially involved in small lipophilic molecule binding; a major sperm protein (MSP) domain, also present in VAP‐A and VAP‐B; and a potential carboxyl‐terminal transmembrane domain (Figs 1D and EV1A). To confirm that MOSPD2 interacted specifically with the FFAT‐containing peptide, we repeated the binding experiment and analyzed the different fractions by Western blot using specific antibodies (Fig 1E). Consistently, VAP‐A and VAP‐B were specifically depleted from the cell extract by the resin‐bound FFAT peptide and were highly enriched in the corresponding elution. Likewise, MOSPD2 was retained by the FFAT peptide, and not by the control peptide, and the protein was highly enriched in the FFAT peptide elution.
Figure 1. Identification of MOSPD2, a new FFAT motif‐binding protein.
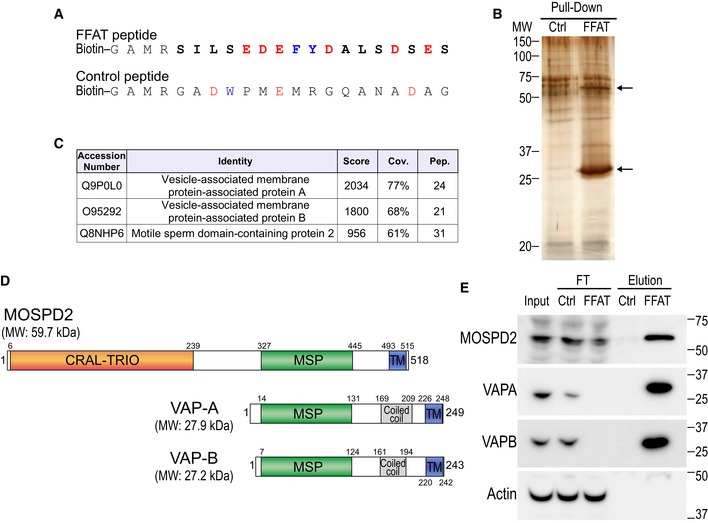
- Sequence of the two peptides used for the pull‐down assay. The peptides are composed of an amino‐terminal biotin, a linker sequence and the FFAT sequence of ORP1 (FFAT peptide) or a random sequence (control peptide). The FFAT sequence of ORP1 is in bold and corresponds to residues 469–483 (Accession Number Q9BXW6‐1). Aromatic and acidic residues are in blue and red, respectively.
- Silver nitrate staining of proteins pulled down using the control peptide (left) or the FFAT peptide (right), after SDS–PAGE. The two major differential bands are highlighted by arrows.
- Tandem mass spectrometry result table showing the three top‐scored proteins identified in the FFAT peptide‐bound fraction. Score: protein score based on the sum of the ion scores of all peptides identified; Cov.: percentage of the protein sequence covered by identified peptides; Pep.: number of unique peptide sequences identified.
- Schematic representation of MOSPD2, VAP‐A, and VAP‐B. Numbers correspond to the predicted positions of the beginning and the end of each domain. Calculated molecular weights (MW) of the proteins are shown.
- Western blot analysis of proteins pulled down using the control (Ctrl) peptide (left), or the FFAT (FFAT) peptide (right). The input, FT (flow through), and elution fractions correspond to HeLa cell total protein extract, unbound proteins, and bound proteins, respectively. Representative illustration of at least two independent experiments.
Source data are available online for this figure.
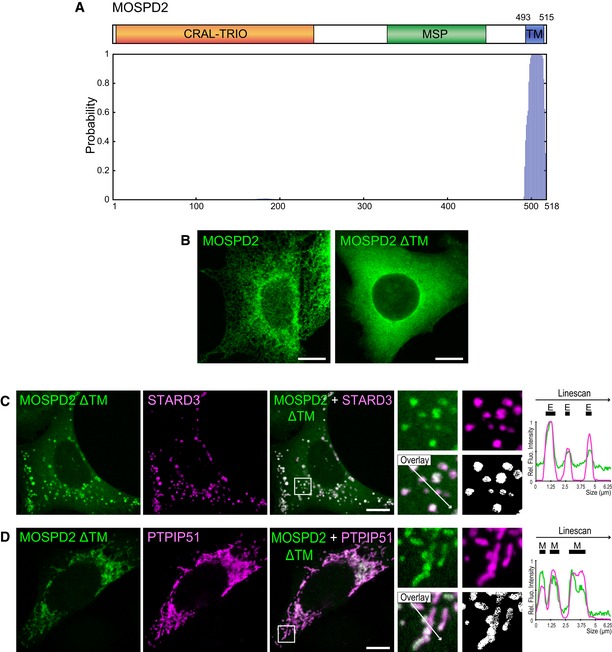
Figure EV1. MOSPD2 is a putative tail‐anchored protein.
-
ATop: Schematic representation of MOSPD2. Numbers indicate the positions of the first and the last residue of the putative transmembrane domain (blue box). Bottom: Determination of the number and position of transmembrane helices using TMHMM software 73. Vertical bars of the diagram represent the probability for a given amino acid to be included in a transmembrane helix. MOSPD2 is predicted to possess a single carboxyl‐terminus transmembrane helix.
-
BLocalization of GFP‐MOSPD2 (left, green) and GFP‐MOSPD2 ΔTM (right, green) expressed in HeLa cells. The GFP‐MOSPD2 ΔTM protein is lacking the last 26 amino acids of MOSPD2, which include the transmembrane domain. Scale bars: 10 μm.
-
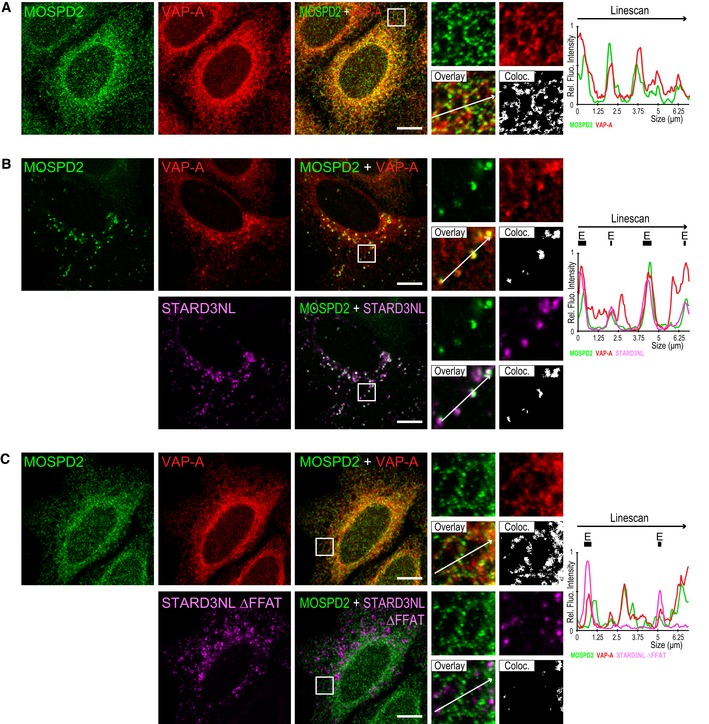
C, DLocalization of GFP‐MOSPD2 ΔTM (green) and Flag‐STARD3 (C, magenta), or HA‐PTPIP51 (D, magenta), expressed in HeLa cells. The subpanels on the right are higher magnification (3.5×) images of the area outlined in white. The Overlay panel shows merged green and magenta images. The Coloc panel displays a colocalization mask on which pixels where the green and the magenta channels co‐localize are shown in white. Right: Linescan analyses with fluorescence intensities of the green and magenta channels along the white arrow shown on the subpanel Overlay. Black rectangles indicate the positions of late endosomes (E) and mitochondria (M). Scale bars: 10 μm.
Together, using an unbiased proteomic approach, we identified MOSPD2 as a new FFAT motif‐interacting protein.
The MSP domain of MOSPD2 binds the FFAT motif
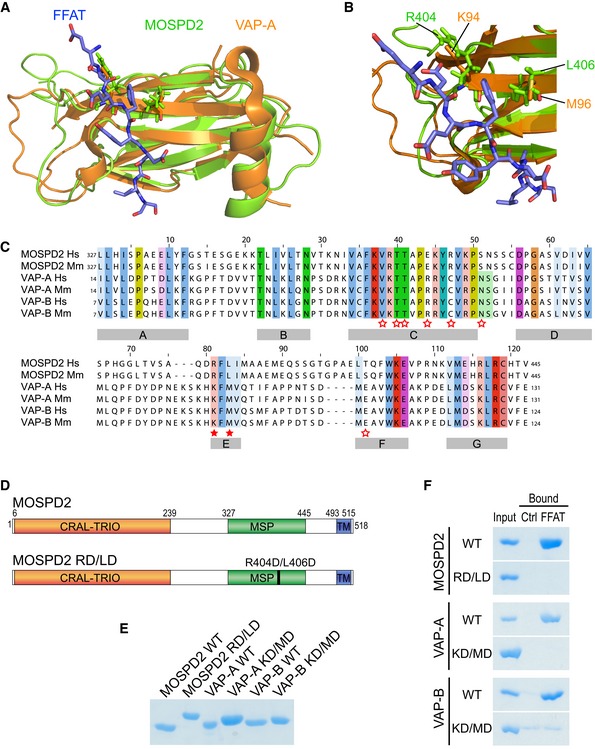
The presence of an MSP domain in MOSPD2 suggested that this part of the protein is responsible for binding the FFAT motif. Given that the tridimensional structure of the mouse MOSPD2 MSP domain was available (PDB ID: 1WIC), we compared it with that of rat VAP‐A in complex with an FFAT peptide (PDB ID: 1Z9O) 27. The 3D alignment of these two structures (Fig 2A) showed a conserved fold for both domains. In particular, two critical residues in VAP proteins (K94 and M96 in VAP‐A), which are essential for FFAT‐binding 27, 28, align with two MOSPD2 residues having similar physicochemical properties, a basic residue (R404) and a polar residue with a similar volume (L406), respectively (Fig 2B). These data were corroborated by primary sequence alignment of the MSP domains of MOSPD2, VAP‐A, and VAP‐B. Despite a relatively low percentage of identity (MOSPD2/VAP‐A: 28% identity; MOSPD2/VAP‐B: 30% identity; compared to VAP‐A/VAP‐B: 82% identity), FFAT‐binding residues in VAP‐A are present in regions conserved in MOSPD2 (Fig 2C). More specifically, K94 and M96 in VAP‐A and K87 and M89 in VAP‐B align with R404 and L406 in MOSPD2. These conservative changes suggest that the residues R404 and L406 in the MSP domain sequence of MOSPD2 are involved in FFAT‐binding in a similar way as the lysine (K94 or K87) and methionine (M96 or M89) in VAP‐A and VAP‐B proteins (Fig 2D). Together, this conserved structure supports the notion that MOSPD2 interacts with FFAT motifs as VAP proteins do.
Figure 2. The MSP domain of MOSPD2 binds the FFAT motif.
-
A, B(A) Structural alignment of the MSP domains of MOSPD2 (PDB ID: 1WIC; green) and VAP‐A in complex with the FFAT motif of ORP1 (PDB ID: 1Z9O; orange). The FFAT peptide is in blue. (B) FFAT‐MSP binding interface: the critical residues K94, M96 in VAP‐A, and R404, L406 in MOSPD2 are shown as sticks.
-
CSequence alignment of the MSP domains of MOSPD2, VAP‐A, and VAP‐B from human (Hs) and mouse (Mm). Numbers refer to amino acid positions. Red stars indicate the position of residues interacting with the FFAT motif in VAP‐A 27. Filled stars indicate the position of the two critical residues in VAP proteins (K94 and M96 in VAP‐A; K87 and M89 in VAP‐B) for FFAT interaction. Subregions with high homology between the three proteins are indicated with gray boxes (A–G).
-
DSchematic representation of MOSPD2 showing the position of the RD/LD mutation of the MSP domain.
-
ECoomassie blue staining of recombinant wild‐type and mutant MSP domains of MOSPD2, VAP‐A, and VAP‐B on SDS–PAGE. Note that the mutant MSP domains of MOSPD2, VAP‐A, and VAP‐B displayed a slowed migration, likely resulting from the negative charges introduced by the mutations.
-
FCoomassie blue staining of proteins pulled down with the control or the FFAT peptide. Representative illustration of at least two independent experiments.
To gain more insight into how the MSP domain of MOSPD2 binds an FFAT motif, we used recombinant protein and tested its capacity to directly interact with a consensus FFAT motif‐containing synthetic peptide. We produced, in Escherichia coli, and purified the MSP domain of MOSPD2 and, as positive and negative controls, the wild‐type and mutated MSP domains of both VAP‐A and VAP‐B, respectively (Fig 2E). These K94D/M96D and K87D/M89D double mutants (hereafter both referred to as KD/MD mutants) of VAP‐A and VAP‐B, respectively, are unable to bind the FFAT motif 10, 27. Based on our structure comparison, we designed and purified the cognate MOSPD2 mutant R404D/L406D (hereafter referred to as RD/LD mutant; Fig 2E). Recombinant proteins corresponding to the wild‐type and RD/LD mutant of the MSP domain of MOSPD2 together with controls were incubated with streptavidin beads coupled to FFAT or control peptides, as described above. Retained proteins were eluted and analyzed by SDS–PAGE followed by Coomassie blue staining (Fig 2F). We found that the MSP domain of MOSPD2 did specifically bind the FFAT peptide, similar to the MSP domains of VAP‐A and VAP‐B. Consistent with our predictions, the mutated MSP domain of MOSPD2 did not bind the FFAT peptide, like the mutated form of VAP‐A and B.
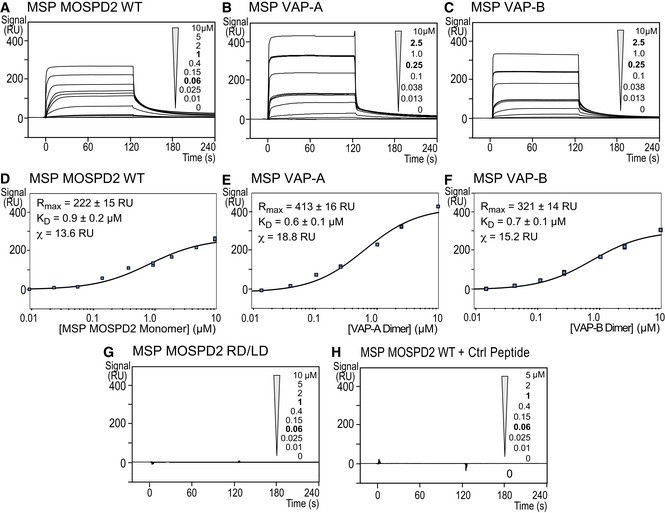
In order to compare the binding properties of the MSP domains of MOSPD2, VAP‐A and VAP‐B to the FFAT peptide, we used an optical biosensing method, surface plasmon resonance (SPR; Fig 3). To do so, the FFAT peptide was immobilized onto a chip and increasing concentrations of recombinant MSP domain were injected. A dose‐dependent signal increase showed that the MSP domains of either MOSPD2 (Fig 3A), VAP‐A (Fig 3B), or VAP‐B (Fig 3C) interacted with the FFAT peptide. In contrast, the RD/LD mutant MSP domain of MOSPD2 did not show any binding onto the FFAT peptide (Fig 3G) nor did the MSP domain of MOSPD2 onto the control peptide (Fig 3H). Although the sensorgrams displayed very steep association and dissociation behaviors (Fig 3A–C) impeding the determination of kinetic rates, they reached a steady‐state response (R eq) during the association phase. Therefore, affinities could be evaluated by fitting the variations of R eq as a function of the MSP domain concentration, assuming a 1:1 model. Prior to determine affinities, we controlled the quaternary structure of the proteins. Indeed, VAP proteins dimerize through a coiled‐coil domain 27, 29, 30, 31. Consistently, gel filtration analysis showed that our VAP‐A and VAP‐B recombinant proteins, which included both the MSP and the coiled‐coil domains, were dimeric (Appendix Fig S1A and B). Unlike VAPs, the MSP domain of MOSPD2 was monomeric as shown by size exclusion chromatography equipped with multi‐angle light scattering analysis (SEC‐MALS; Appendix Fig S1C). Eventually, the concentrations used to calculate affinities correspond to a monomeric form for MOSPD2 and to a dimeric form for VAP‐A and VAP‐B proteins, with the assumption that the monomer–dimer equilibrium is negligible. A K D of 0.9 ± 0.2 μM was determined by fitting the binding isotherm obtained for the MSP domain of MOSPD2/FFAT peptide interaction (Fig 3D). Comparable dissociation constant (K D) values were obtained for VAP‐A (0.6 ± 0.1 μM) and VAP‐B (0.7 ± 0.1 μM) MSP domains/FFAT peptide interaction (Fig 3E and F). These experiments showed that the MSP domains of MOSPD2, VAP‐A, and VAP‐B have similar micromolar affinities for the FFAT motif. Protein–protein interactions are governed by an ensemble of parameters, including affinity, co‐localization, and concentration. We reasoned that despite having similar affinities, MOSPD2 and VAPs might differ by their abundance in cells. To measure absolute VAP‐A, VAP‐B, and MOSPD2 protein amounts, we performed quantitative immunoblots and used recombinant proteins to build standard curves (Appendix Fig S1D–G). We also controlled the immunoblot specificity by running in parallel whole cell protein extracts from wild‐type and silenced cells. Next, absolute protein levels were expressed as a function of total protein mass. Of interest, we noted that the level of VAP‐A, VAP‐B, and MOSPD2 differed by several order of magnitude in HeLa cells (Appendix Fig S1G). VAP‐A is the most abundant protein, and VAP‐B and MOSPD2 are thirty and two hundred times less abundant, respectively. Altogether, these results indicate that the level of MSP‐containing protein is diverse, and one can speculate that despite using a similar mode of interaction, their relative concentration might regulate the dynamics of the formation of MCS.
Figure 3. The MSP domain of MOSPD2 binds the FFAT motif with an affinity in the micromolar range.
-
A–HSurface plasmon resonance analysis of the MSP domain of MOSPD2, VAP‐A, or VAP‐B binding onto immobilized FFAT peptide. Representative sensorgrams resulting from the interaction between the MSP domain of MOSPD2 (A), VAP‐A (B), or VAP‐B (C) injected at different concentrations, and the FFAT peptide. No binding was detected when the RD/LD mutant MSP domain of MOSPD2 was injected onto the FFAT peptide (G), or when the wild‐type MSP domain of MOSPD2 was injected onto the immobilized control peptide (H). Binding curves display the SPR signal (RU) as a function of time. Concentrations printed in bold indicate samples measured three times. Samples with no protein (0 μM concentration) were measured two times. (D) Steady‐state analysis of the FFAT peptide/MSP domain of MOSPD2 interaction: Equilibrium responses (R eq) extracted from panel (A) were plotted as a function of the MSP domain of MOSPD2 concentration, and fitted with a 1:1 binding model. (E, F) Steady‐state analysis of the FFAT peptide/MSP domain of VAP‐A (E) or VAP‐B (F) interaction: equilibrium responses (R eq) extracted from panel (A) were plotted as a function of dimeric VAP concentration and fitted with a 1:1 binding model.
Together, in vitro structure–function analysis shows that the MSP domain of MOSPD2 is a bona fide FFAT motif‐interacting domain.
MOSPD2 is an ER‐resident protein
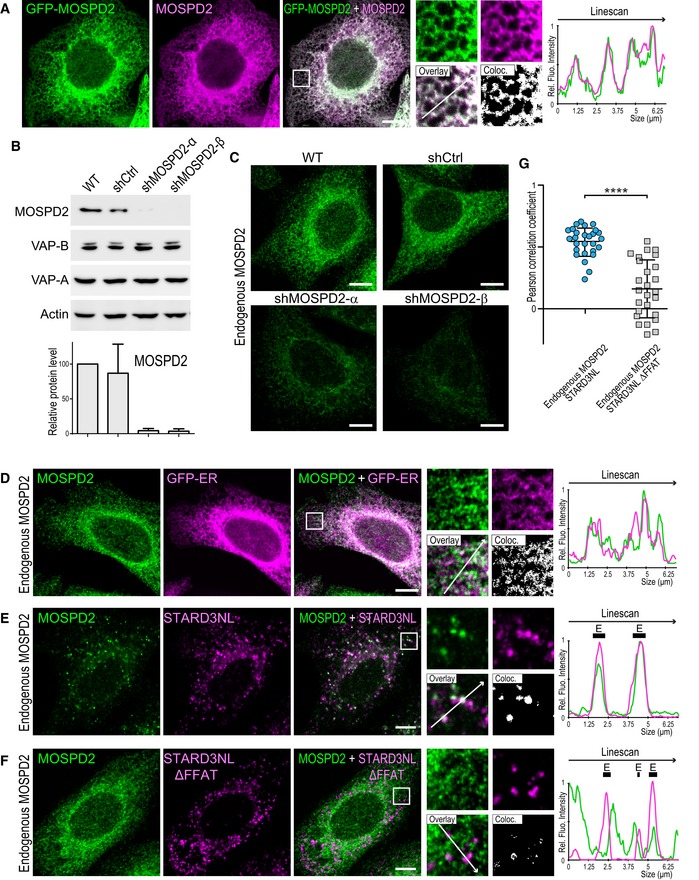
Analysis of the primary sequence of MOSPD2 points to the existence of a potential C‐terminal transmembrane domain (Figs 1D and EV1A), suggesting that the protein is anchored in a membrane. To know to which cellular membrane MOSPD2 is bound, we sought for its subcellular localization. To do so, we generated a HeLa cell line expressing a GFP‐MOSPD2 construct and observed the GFP signal (Fig 4A). GFP‐MOSPD2 exhibited a reticular pattern extending throughout the cytoplasm with a perinuclear enrichment, suggesting that the protein was present in the ER. Next, we labeled GFP‐MOSPD2 expressing cells with two ER markers, Calnexin and VAP‐A (Fig 4A). GFP‐MOSPD2 co‐localized extensively with Calnexin and VAP‐A. Accordingly, MOSPD2 signal was highly correlated to Calnexin signal (Fig 4B). These data show that MOSPD2 is an ER‐resident protein. In order to verify that MOSPD2 was anchored in the ER membrane by its TM, we expressed an MOSPD2 mutant lacking the TM. The GFP‐MOSPD2 ΔTM protein exhibited an even distribution in the cytoplasm (Fig EV1B). Together, these data show that MOSPD2 is a tail‐anchored ER‐resident protein.
Figure 4. MOSPD2 is an ER‐resident protein able to tether synthetic vesicles by binding the FFAT motif.
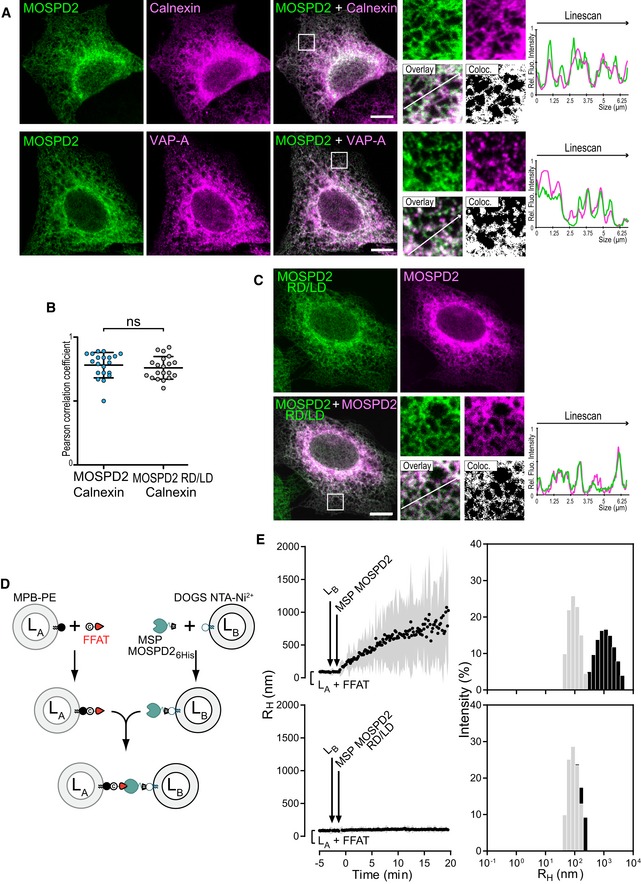
- HeLa/GFP‐MOSPD2 cells were labeled with anti‐Calnexin antibodies (top; magenta) or with anti‐VAP‐A antibodies (bottom; magenta).
- Pearson correlation coefficients between GFP‐MOSPD2 and Calnexin (left) or GFP‐MOSPD2 RD/LD and Calnexin (right) staining are shown. Each dot represents a single cell (20 cells from three independent experiments). Means and error bars (SD) are shown. Mann–Whitney test.
- HeLa cells co‐expressing GFP‐MOSPD2 RD/LD (green) and mCherry‐MOSPD2 (magenta).
- Description of the liposome aggregation assay experimental strategy. LA liposomes are decorated with an FFAT peptide owing to covalent links with MPB‐PE lipids, and mixed with LB liposomes covered by 6His‐tagged MOSPD2 MSP domain attached to DOGS‐NTA‐Ni2+.
- Aggregation assays in real time. LA liposomes (50 μM total lipids) decorated with conventional FFAT peptide (380 nM) were mixed with LB liposomes (50 μM total lipids) covered with the wild‐type (top; 760 nM) or the RD/LD mutant (bottom; 760 nM) MSP domain of MOSPD2. Aggregation was followed by dynamic light scattering (DLS). Left panels: mean radius (black dots) and polydispersity (shaded area) over time. Right panels: size distribution before (gray bars) and after (black bars) the reaction. Representative illustration of at least three independent experiments.
To evaluate whether the FFAT‐binding ability of MOSPD2 contributes to the steady‐state localization of the protein, the localization of a mutant of the MSP domain unable to bind FFAT motifs, the GFP‐MOSPD2 RD/LD mutant (Fig 2D) was studied (Fig 4C). Of interest, the localization of MOSPD2 at steady state was not affected by the inactivation of the MSP domain, the protein being distributed in reticular ER (Fig 4C and data not shown). To be certain that we did not miss a subtle change in localization, we also co‐expressed wild‐type and RD/LD MOSPD2 proteins fused to mCherry and GFP, respectively, and compared their localizations. The mCherry and GFP signal were highly similar (Fig 4C). In addition, co‐labeling with the ER protein Calnexin showed that MOSPD2 and MOSPD2 RD/LD signals were similarly correlated with Calnexin signal (Fig 4B). Thus, inactivating binding to FFAT does not modify MOSPD2 localization, supporting the idea that the C‐terminal membrane anchor is attaching MOSPD2 to the ER.
Collectively, these data showed that MOSPD2 is an ER‐resident protein. Moreover, MOSPD2 localization is not dependent on the presence of a functional MSP domain; therefore, we can reason that at steady state and in HeLa cells, MOSPD2 does not have a favored FFAT motif‐interacting protein partner localized at a discrete subcellular region.
The MSP domain of MOSPD2 allows membrane tethering
As a number of FFAT‐containing proteins are also physically associated with membranes of various organelles 8, it is likely that the interaction between the MSP domain of MOSPD2 and the FFAT motif drives a membrane tethering mechanism between the ER and (an)other organelle(s). To show that, we did in vitro tethering assays with the recombinant MSP domain of MOSPD2 and liposomes (Fig 4D and E). Using dynamic light scattering (DLS), we monitored tethering by recording the size of particles formed in the presence of two liposomes populations, one bearing an FFAT‐containing peptide (LA liposomes) and the other covered by the MSP domain of MOSPD2 (LB liposomes). The peptide was attached to LA liposomes via a covalent link with thiol‐reactive MPB‐PE lipids (3 mol%). The MSP domain of MOSPD2 was bound to LB liposomes thanks to a C‐terminal 6His‐tag attached to DOGS‐NTA‐Ni2+ lipids (2 mol%, Fig 4D). LA liposomes bearing the FFAT peptide were then mixed with LB liposomes together with the MSP domain of MOSPD2. A rapid increase in the initial mean radius (80 nm on average) up to 600 nm was observed upon MSP addition (Fig 4E). Size distribution analysis at the end of the kinetics was indicative of the formation of liposome aggregates with high polydispersity (479 ± 87 nm) at the expense of free liposomes (97 ± 15 nm). The same experiment was performed using the RD/LD MSP mutant unable to bind FFAT, and no aggregation was observed in the presence of this mutant.
These results show that the MSP domain of MOSPD2 and the FFAT motif trigger the formation of membrane contacts between synthetic vesicles.
MOSPD2 interacts with FFAT and FFAT‐like motif‐containing proteins
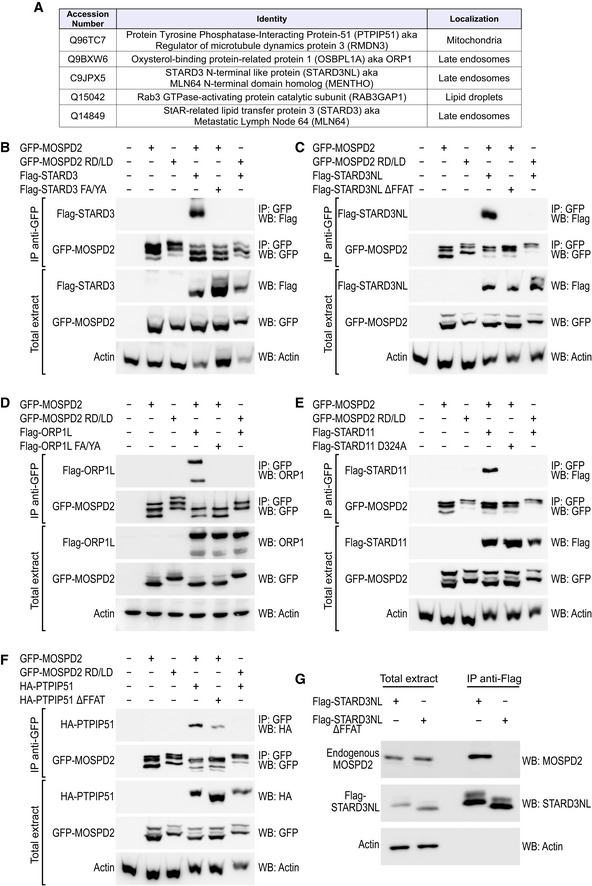
The ability of the MSP domain of MOSPD2 to bind FFAT motifs supports the notion that, like VAP proteins, MOSPD2 might interact with a variety of FFAT‐containing proteins. To test this hypothesis, we performed immunoprecipitation experiments using GFP‐MOSPD2 and GFP‐MOSPD2 RD/LD as baits and analyzed their interacting partners by mass spectrometry. GFP‐MOSPD2 RD/LD was used as a negative control to filter proteins according to their ability to interact with MOSPD2 in an FFAT‐dependent manner. Among the 109 proteins identified (Appendix Table S1), five were established VAP partners containing a FFAT motif (Fig 5A), and nine additional proteins were already identified as VAP partners in interaction databases 32.
Figure 5. MOSPD2 interacts with FFAT‐containing proteins.
-
AList of the five top‐scored proteins interacting with MOSPD2 and known to contain a FFAT motif (see Appendix Table S1 for the full list). Proteins co‐precipitated with GFP‐MOSPD2 and GFP‐MOSPD2 RD/LD proteins were identified by mass spectrometry; proteins were filtered for their ability to bind MOSPD2 and not the RD/LD mutant. The subcellular localization of the proteins is indicated 53, 65, 66, 67, 68, 69.
-
B–FImmunoprecipitation (GFP‐Trap) experiments between GFP‐MOSPD2 (WT and RD/LD mutant) and Flag‐tagged STARD3 (B), STARD3NL (C), ORP1L (D), STARD11 (E), and HA‐tagged PTPIP51 (F) (WT and FFAT‐deficient). Approximatively 5 μg of total protein extracts was analyzed by Western blot using anti‐Flag (B, C, E), anti‐ORP1 (D), anti‐HA (F), anti‐GFP (B–F), and anti‐actin (B–F) antibodies. Immunoprecipitated material was analyzed using anti‐Flag (B, D–F) or anti‐ORP1 (C), and anti‐GFP (B–F) antibodies.
-
GImmunoprecipitation (anti‐Flag) experiment between Flag‐tagged STARD3NL (WT and FFAT‐deficient) and endogenous MOSPD2. Proteins extracts and immunoprecipitated material were analyzed by Western blot using anti‐MOSPD2, anti‐STARD3NL, and anti‐actin antibodies.
Source data are available online for this figure.
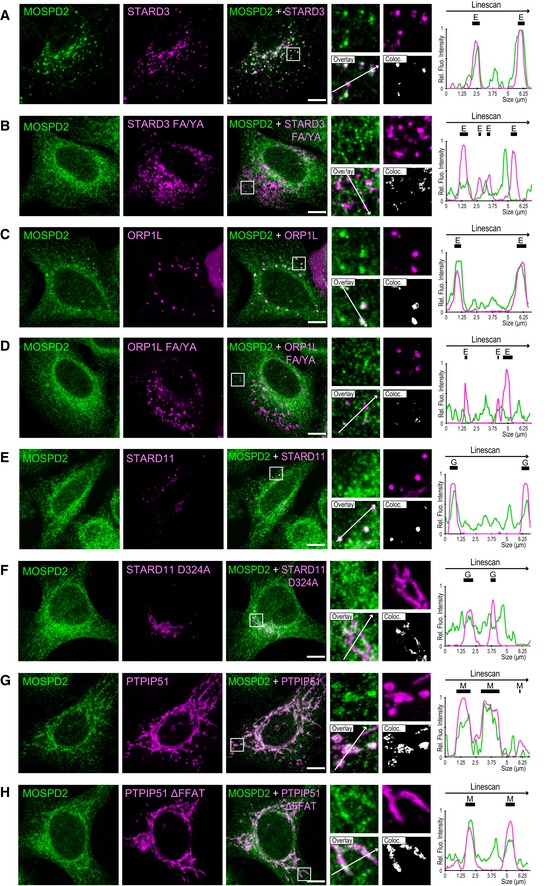
To test the robustness of the proteomic analysis of the MOSPD2 interactome, we performed co‐immunoprecipitation assays between MOSPD2 and several FFAT‐containing proteins, namely STARD3 (StAR‐related lipid transfer domain protein 3, also known as metastatic lymph node 64, MLN64), STARD3NL (STARD3 N‐terminal‐like protein, also known as MLN64 N‐terminal homologue, MENTHO), ORP1L (oxysterol‐binding protein‐related protein 1L), and PTPIP51 (protein tyrosine phosphatase‐interacting protein‐51, also known as regulator of microtubule dynamics protein 3, RMD3), which were all identified in our proteomic analysis. We also included STARD11 (StAR‐related lipid transfer domain protein 11, also known as CERT), another established VAP partner 11. All these proteins, by binding VAP proteins, are known to build contact sites between the ER and endosomes (STARD3, STARD3NL, ORP1L), mitochondria (PTPIP51), and Golgi (STARD11) 10, 11, 14, 18, 27. Interestingly, these proteins harbor either a consensus FFAT motif as originally defined (ORP1L, STARD11) or slightly divergent sequences, so‐called FFAT‐like motifs (STARD3, STARD3NL, and PTPIP51) 8. GFP‐tagged MOSPD2 was co‐expressed in HeLa cells with wild‐type and with FFAT‐mutant forms of all these proteins namely STARD3 and STARD3 FA/YA (Fig 5B), STARD3NL and STARD3NL ∆FFAT (Fig 5C), ORP1L and ORP1L FA/YA (Fig 5D), STARD11 and STARD11 D324A (Fig 5E), and PTPIP51 and PTPIP51 ∆FFAT (Fig 5F) and subjected to immunoprecipitation. As a result, wild‐type STARD3, STARD3NL, ORP1L, STARD11, and PTPIP51 were co‐immunoprecipitated with MOSPD2. Of note, the FFAT‐defective mutants of STARD3, STARD3NL, ORP1L, and STARD11 were not co‐immunoprecipitated. The FFAT mutant of PTPIP51 was poorly co‐immunoprecipitated by MOSPD2. Thus, the interaction between MOSPD2 and these proteins requires an FFAT motif. Reciprocally, we performed co‐immunoprecipitation experiments between the RD/LD mutant form of MOSPD2 and wild‐type STARD3, STARD3NL, ORP1L, STARD11, and PTPIP51 (Fig 5B–F). Consistently, the MOSPD2 RD/LD mutant did not interact with any of the proteins above mentioned which indicated the necessity for the MSP domain of MOSPD2 to bind these proteins (STARD3, STARD3NL, ORP1L, STARD11, and PTPIP51) in a FFAT‐dependent manner.
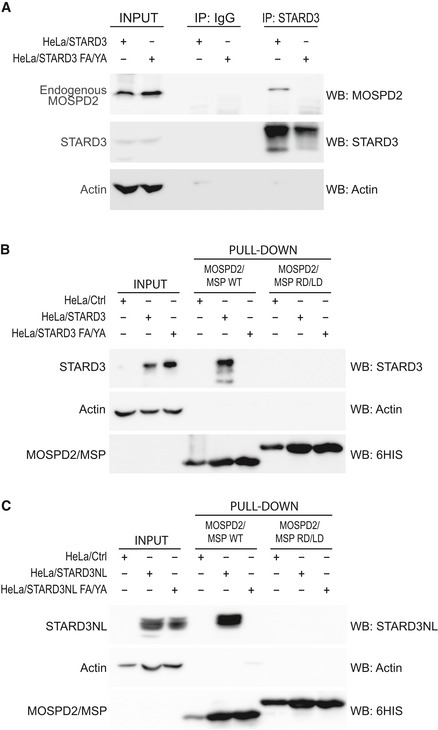
To determine whether endogenous MOSPD2 interacts with FFAT‐containing proteins, we performed co‐immunoprecipitation assays. Wild‐type and FFAT‐mutant Flag‐STARD3NL (Fig 5G) or STARD3 (Fig EV2A) were expressed in HeLa cells and immunoprecipitated using anti‐Flag and anti‐STARD3 antibodies, respectively. Endogenous MOSPD2 was co‐immunoprecipitated with Flag‐STARD3NL (Fig 5G) and STARD3 (Fig EV2A) and not with the FFAT‐mutant Flag‐STARD3NL ΔFFAT and STARD3 FA/YA. Thus, endogenous MOSPD2 interacts with FFAT‐containing proteins.
Figure EV2. The MSP domain of MOSPD2 is sufficient to interact with STARD3 and STARD3NL .
-
AImmunoprecipitation experiment between STARD3 (WT and FFAT‐deficient) and endogenous MOSPD2. Proteins were immunoprecipitated using anti‐STARD3 antibodies or control IgG. Protein extracts and immunoprecipitates were analyzed by Western blot using anti‐MOSPD2, anti‐STARD3, and anti‐actin antibodies.
-
B, CInteraction of STARD3 (B), or STARD3NL (C), with the recombinant MSP domain of MOSPD2. The WT and the RD/LD mutant MSP domain of MOSPD2 were bound to a Ni2+‐NTA resin and used in a pull‐down assay with protein extracts of control (HeLa/Ctrl), STARD3, and STARD3 FA/YA FFAT‐defective mutant (B), and STARD3NL and STARD3NL FA/YA FFAT‐defective mutant (C) expressing cells. Total and bound proteins were analyzed by Western blot using anti‐STARD3 (B), anti‐STARD3NL (C), anti‐HIS tag (B and C), and anti‐actin (B and C).
Source data are available online for this figure.
To examine whether the binding process solely relies on the MSP domain, we performed pull‐down experiments using 6His‐tagged recombinant wild‐type and RD/LD MSP domains of MOSPD2 (Fig 2E). Each recombinant protein was immobilized onto a NTA‐Ni2+ resin, and beads were then incubated with protein extracts from HeLa cells stably expressing STARD3 (HeLa/STARD3) or the defective FFAT mutant (HeLa/STARD3 FA/YA; Fig EV2B) 23. Bound proteins were analyzed by Western blot. The wild‐type MSP domain of MOSPD2 interacted specifically with STARD3, but not with the STARD3 FA/YA mutant (Fig EV2B). Likewise, the mutant RD/LD MSP domain did not interact with STARD3. Similar results were obtained with STARD3NL (Fig EV2C). These experiments showed that the MSP domain of MOSPD2 is sufficient to interact with FFAT‐containing proteins.
Collectively, these results showed that MOSPD2 interacts through its MSP domain with a variety of proteins containing consensus FFAT or FFAT‐like motifs.
MOSPD2 is enriched in membrane contact sites by FFAT motif‐containing proteins
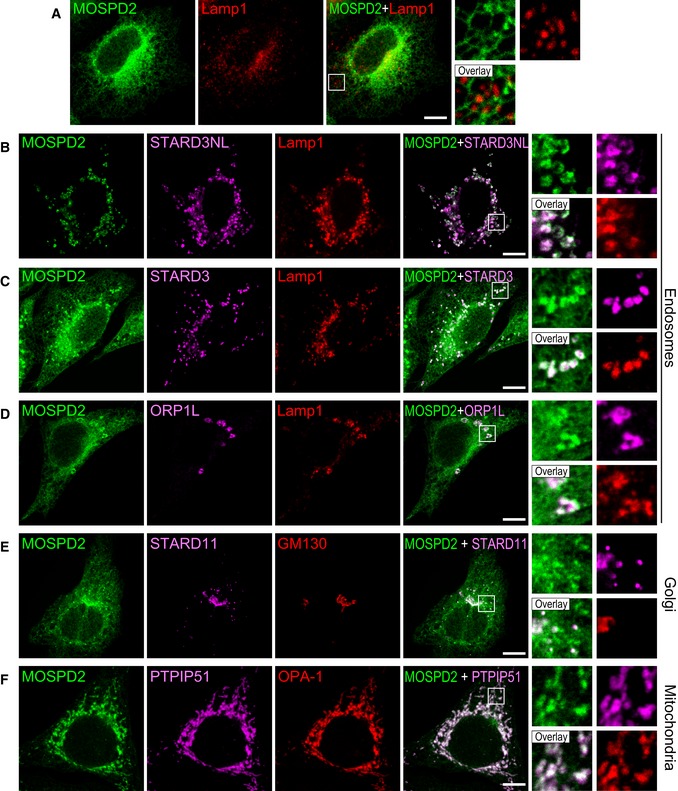
It is known that VAP proteins bind a variety of FFAT‐containing proteins 9, 26. As a result, VAPs are enriched in ER subdomains contacting the organelle bearing their protein partners 10, 12, 14, 33. We wondered whether MOSPD2 too could be relocalized in ER subregions engaged in specific interorganelle contacts. To test this assumption, we co‐expressed MOSPD2 with STARD3, STARD3NL, ORP1L, STARD11, and PTPIP51 10, 11, 14, 18 (Fig 6). MOSPD2 expressed alone was evenly present in the ER (Fig 4A) with little association with endosomes (Fig 6A), Golgi, and mitochondria (data not shown). In contrast, in the presence of each of the FFAT‐bearing proteins, MOSPD2 was predominantly recruited toward the organelles harboring this partner, either on endosomes when STARD3, STARD3NL, and ORP1L were expressed (Fig 6B–D), on the Golgi with STARD11 (Fig 6E), or on mitochondria with PTPIP51 (Fig 6F). To test whether this recruitment was solely dependent on the interaction between the MSP domain of MOSPD2 and the FFAT motif, localization experiments were repeated between STARD3NL‐ and MOSPD2‐bearing mutations in the FFAT motif and the MSP domain, respectively. When expressed together, MOSPD2 was recruited toward STARD3NL/Lamp1‐positive endosomes (Fig 7A) and both signals were correlated (Fig 7D). Consistent with the notion that MSP‐FFAT interaction is the driving force for the recruitment of MOSPD2 on organelles bearing a partner, no specific recruitment was observed on endosomes when the MSP domain of MOSPD2 (RD/LD) or the FFAT motif of STARD3NL (ΔFFAT) was mutated (Fig 7B and C). In addition, under these conditions, MOSPD2 and STARD3NL signals were not correlated (Fig 7D). Likewise, MOSPD2 RD/LD was not recruited by STARD3 (Fig EV3A and E) and ORP1L (Fig EV3B and E) around endosomes. It was not recruited either by STARD11 around the Golgi (Fig EV3C and E) or by PTPIP51 around mitochondria (Fig EV3D and E). Moreover, mutant forms of STARD3, ORP1L, STARD11, and PTPIP51 lacking a functional FFAT motif were also unable to recruit MOSPD2 (data not shown and Fig EV3E). Interestingly, consistent with the fact that the recruitment operates in a MSP‐FFAT‐dependent manner, the GFP‐MOSPD2 ΔTM which exhibited an even distribution in the cytosol when expressed alone (Fig EV1B) was also recruited onto STARD3‐positive endosomes (Fig EV1C) and onto PTPIP51‐positive mitochondria (Fig EV1D), in STARD3‐ and PTPIP51‐expressing cells, respectively.
Figure 6. FFAT‐containing proteins recruit the ER‐resident MOSPD2 protein to interorganelle contact sites.
-
AGFP‐MOSPD2 (green)‐expressing cells were stained with an anti‐Lamp1 antibody (red) to label late endosomes/lysosomes.
-
B–FGFP‐MOSPD2 (green)‐expressing cells were transfected with Flag‐STARD3NL (B), Flag‐STARD3 (C), Flag‐ORP1L (D), Flag‐STARD11 (E), or HA‐PTPIP51 (F), and labeled using anti‐Flag (B–E; magenta), anti‐HA (F: magenta), and anti‐Lamp1 (B–D; red), GM130 (E; red), or OPA‐1 (F; red) as markers of late endosomes/lysosomes, Golgi, and mitochondria, respectively.
Figure 7. FFAT motif‐dependent recruitment of MOSPD2 in ER–endosome contacts by STARD3NL.
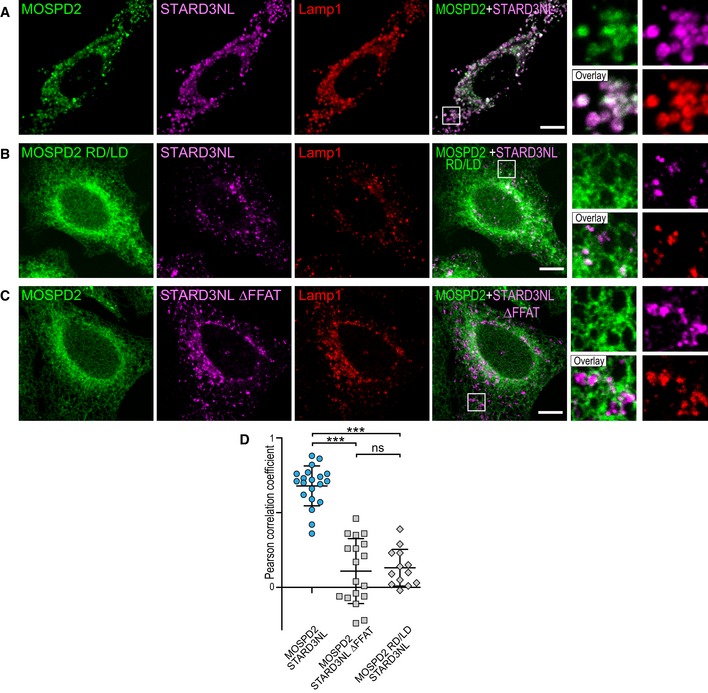
-
A–CGFP‐MOSPD2‐ (A and C) and GFP‐MOSPD2 RD/LD‐expressing cells (B) were transfected with Flag‐STARD3NL (A and B), or Flag‐STARD3NL ΔFFAT (C), and labeled using anti‐Flag (magenta) and anti‐Lamp1 (late endosomes/lysosomes marker; red) antibodies. The subpanels on the right are higher magnification (3.5×) images of the area outlined in white. The Overlay panel shows merged green and magenta images. Scale bars: 10 μm.
-
DPearson's correlation coefficients between MOSPD2 (WT or RD/LD mutant) and STARD3NL (WT or ΔFFAT) staining are shown. Each dot represents a single cell (number of cells: MOSPD2–STARD3NL: 20; MOSPD2–STARD3NL ΔFFAT: 18; MOSPD2 RD/LD–STARD3NL: 13, from three independent experiments). Means and error bars (SD) are shown. Kruskal–Wallis with Dunn's multiple comparison test (***P < 0.001).
Figure EV3. MOSPD2 recruitment to interorganelle contact sites depends on the interaction between the FFAT motif and the MSP domain.
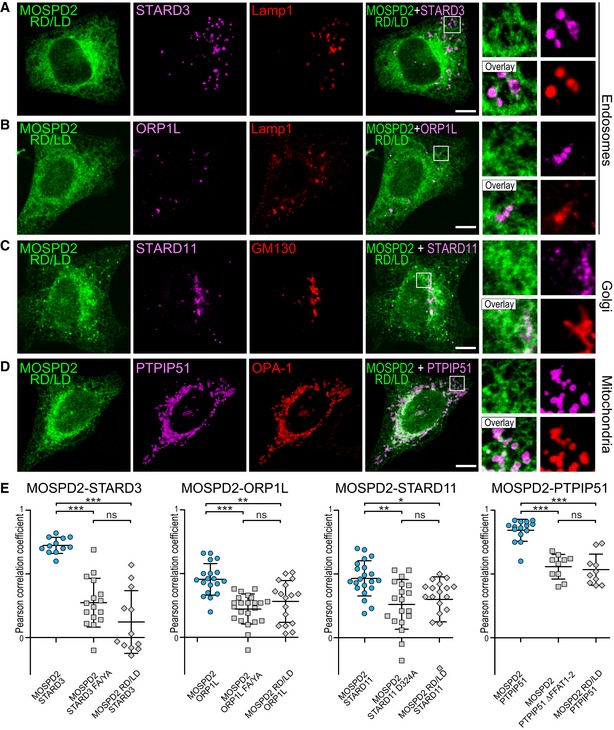
-
A–DGFP‐MOSPD2 RD/LD (green)‐expressing cells were transfected with Flag‐STARD3 (A), Flag‐ORP1L (B), Flag‐STARD11 (C), or HA‐PTPIP51 (D), and labeled using anti‐Flag (A–C; magenta), anti‐HA (D: magenta), and anti‐Lamp1 (A and B; red), GM130 (C; red), or OPA‐1 (D; red), as markers of late endosomes/lysosomes, Golgi, and mitochondria, respectively. The subpanels on the right are higher magnification (3.5×) images of the area outlined in white. The Overlay panel shows merged green and magenta images. Scale bars: 10 μm.
-
EPearson correlation coefficients between MOSPD2 (WT or RD/LD mutant) and STARD3 (WT or FA/YA), ORP1L (WT or FA/YA), STARD11 (WT or D324A), and PTPIP51 (WT or ΔFFAT 1–2) staining are shown. Each dot represents a single cell from three independent experiments (number of cells: MOSPD2–STARD3: 12; MOSPD2–STARD3 FA/YA: 16; MOSPD2 RD/LD–STARD3: 12; MOSPD2–ORP1L: 19; MOSPD2–ORP1L FA/YA: 23; MOSPD2 RD/LD–ORP1L: 17; MOSPD2–STARD11: 21; MOSPD2–STARD11 D324A: 19; MOSPD2 RD/LD–STARD11: 18; MOSPD2–PTPIP51: 15; MOSPD2–PTPIP51 ΔFFAT 1–2: 10; MOSPD2 RD/LD–PTPIP51: 10). Means and error bars (SD) are shown. Kruskal–Wallis with Dunn's multiple comparison test (*P‐values < 0.05; **P < 0.01; ***P < 0.001).
Of note, MOSPD2 and VAP‐A have been identified as partners in a high‐throughput interaction screening 34. It is unclear how both proteins could interact, however, to rule out the possibility that VAP proteins were involved in the recruitment of MOSPD2 in contact sites, we looked at MOSPD2 subcellular localization in VAP‐A‐ and VAP‐B‐silenced HeLa cells (Appendix Fig S2). Compared to control cells, small hairpin RNAs (shRNA) targeting VAP‐A and VAP‐B reduced their levels by ~ 98 and ~ 99%, respectively (Appendix Fig S2B). Consistent with the notion that MOSPD2 is a bona fide partner of FFAT‐containing proteins, in the absence of VAP proteins, MOSPD2 was still enriched around STARD3‐positive endosomes and PTPIP51‐positive mitochondria (Appendix Fig S2C and D).
To further substantiate these observations, we looked at endogenous MOSPD2 protein (Fig 8). First, we verified that the antibody we used was specifically detecting MOSPD2 by immunofluorescence in cells overexpressing GFP‐MOSPD2 (Fig 8A). Then, we silenced MOSPD2 in HeLa cells using two different shRNAs (Fig 8B and C). Compared to non‐silenced cells (HeLa and HeLa/shCtrl), MOSPD2 level was reduced by ~ 96 and ~ 97% with the α or β shRNA, respectively (Fig 8B). Endogenous MOSPD2 labeled in HeLa and HeLa/shCtrl cells displayed a reticular localization reminiscent of the ER (Fig 8C). Accordingly, endogenous MOSPD2 co‐localized with an ER marker tagged with GFP (GFP‐ER; Fig 8D). In marked contrast, MOSPD2 labeling in silenced cells resulted in the absence of signal over background (Fig 8C). Subsequently, we labeled endogenous MOSPD2 in cells expressing STARD3NL or the defective mutant STARD3NL ΔFFAT (Fig 8E and F). In the presence of STARD3NL, MOSPD2 accumulated around STARD3NL‐positive endosomes, while it remained evenly distributed in the ER in STARD3NL ΔFFAT‐expressing cells. Accordingly, STARD3NL and endogenous MOSPD2 signals were highly correlated, while STARD3NL ΔFFAT and endogenous MOSPD2 signals were not (Fig 8G). Likewise, endogenous MOSPD2 was recruited around endosomes, Golgi, and mitochondria in STARD3‐ (Fig EV4A), ORP1L‐ (Fig EV4C), STARD11‐ (Fig EV4E), and PTPIP51‐expressing cells (Fig EV4G). In contrast, in cells expressing FFAT‐deficient STARD3 (Fig EV4B), ORP1L (Fig EV4D), STARD11 (Fig EV4F), or PTPIP51 (Fig EV4H), endogenous MOSPD2 retained an even distribution within the ER. Thus, endogenous MOSPD2 is recruited in ER subregions surrounding organelles harboring its interaction partners.
Figure 8. Endogenous MOSPD2 is recruited to interorganelle contact sites by FFAT‐containing proteins.
-
AGFP‐tagged MOSPD2 (green)‐expressing cells were labeled with an anti‐MOSPD2 antibody (magenta). The superposition of the green and magenta signals indicates that the anti‐MOSPD2 antibody recognized efficiently MOSPD2 by immunofluorescence.
-
BWestern blot analysis of MOSPD2 and VAP proteins in control HeLa cells (WT) and in HeLa cells expressing a control shRNA (shCtrl) and two individual shRNAs targeting MOSPD2 (shMOSPD2‐α or shMOSPD2‐β). Quantification of MOSPD2 protein level is shown below. Means and error bars (SD) are shown. n: Three independent experiments.
-
CEndogenous MOSPD2 (green) was labeled in control HeLa cells (WT), in cells expressing a control shRNA (shCtrl), and in cells expressing two individual shRNAs targeting MOSPD2 (shMOSPD2‐α or shMOSPD2‐β). Scale bar: 10 μm.
-
DEndogenous MOSPD2 (green) staining in HeLa cells expressing the ER marker GFP‐ER (magenta).
-
E, FEndogenous MOSPD2 (green) staining in HeLa cells expressing Flag‐STARD3NL (E) or Flag‐STARD3NL ΔFFAT (F) (anti‐Flag; magenta).
-
GPearson's correlation coefficients between endogenous MOSPD2 and Flag‐STARD3NL (WT or ΔFFAT) staining are shown. Each dot represents a single cell (number of cells: MOSPD2–Flag‐STARD3NL: 27; MOSPD2–Flag‐STARD3NL ΔFFAT: 26; from three independent experiments). Means and error bars (SD) are shown. Mann–Whitney test (two‐tailed P‐value; ****P < 0.0001).
Figure EV4. Endogenous MOSPD2 is recruited to interorganelle contact sites by FFAT‐containing proteins.
-
A–HEndogenous MOSPD2 (green) staining in HeLa cells expressing Flag‐STARD3 (A), Flag‐STARD3 FA/YA (B), GFP‐ORP1L (C), GFP‐ORP1L FA/YA (D), Flag‐STARD11 (E), Flag‐STARD11 D324A (F), HA‐PTPIP51 (G), or HA‐PTPIP51 ΔFFAT (H) (magenta). Endogenous MOSPD2 was recruited around endosomes, Golgi, and mitochondria by STARD3 and ORP1L, STARD11 and PTPIP51, respectively. FFAT‐deficient STARD3, ORP1L, STARD11, and PTPIP51 mutants did not recruit endogenous MOSPD2. Note that in agreement with immunoprecipitation assays (Fig 5F), PTPIP51 ΔFFAT retained a partial ability to recruit MOSPD2. The subpanels on the right are higher magnification (3.5×) images of the area outlined in white. The Overlay panel shows merged green and magenta images. The Coloc panel displays a co‐localization mask on which pixels where the green and the magenta channels co‐localize are shown in white. Right: Linescan analyses with fluorescence intensities of the green and magenta channels along the white arrow shown on the subpanel Overlay. Black rectangles indicate the positions of late endosomes (E), Golgi stacks (G), and mitochondria (M). Scale bars: 10 μm.
To assess whether VAP proteins were recruited in the same contact sites as MOSPD2, we co‐labeled endogenous VAP‐A and MOSPD2 in STARD3NL‐expressing cells. Interestingly, endogenous VAP‐A was recruited together with endogenous MOSPD2 around STARD3NL‐positive endosomes (Fig EV5B). In control cells or in cells expressing the mutant protein STARD3NL ΔFFAT, both VAP‐A and MOSPD2 were evenly distributed in the ER (Fig EV5A and C). Thus, using light microscopy, MOSPD2 and VAP are observed in the same contact sites.
Figure EV5. VAP‐A is recruited to interorganelle contact sites together with MOSPD2.
-
AHeLa cells were labeled with anti‐MOSPD2 (green) and anti‐VAP‐A (red) antibodies.
-
B, CHeLa cells expressing Flag‐STARD3NL (B) or Flag‐STARD3NL ΔFFAT (C) were labeled with anti‐MOSPD2 (green), anti‐VAP‐A (red), and anti‐Flag (magenta) antibodies.
Together, these data show that the localization of MOSPD2 in contact sites involving the ER and several organelles is triggered by the presence and abundance of a protein partner and occurs through an interaction with FFAT motifs.
MOSPD2 modulates interorganelle contacts
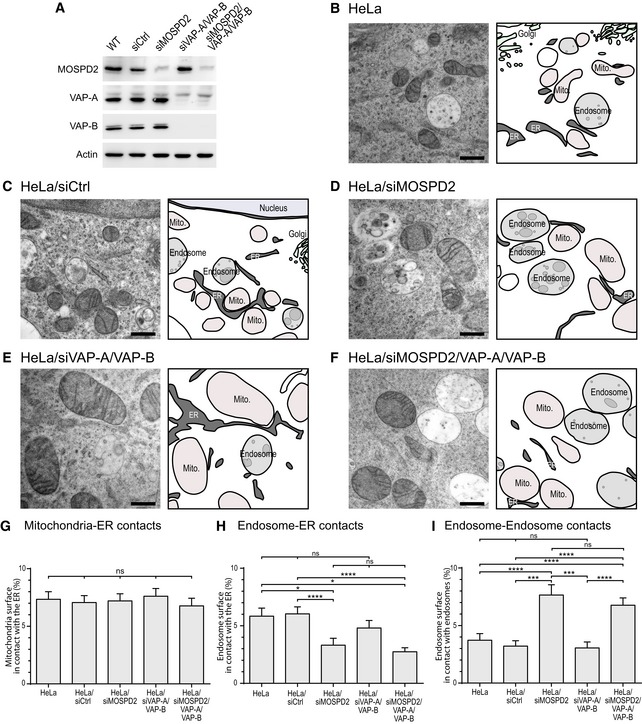
To substantiate the physiological relevance of these results, we investigated the effect of MOSPD2 knockdown on interorganelle contacts. Moreover, to understand the relative contribution of MOSPD2 and VAP proteins in this process, we performed single (MOSPD2), double (VAP‐A and VAP‐B), and triple (MOSPD2, VAP‐A and VAP‐B) knockdowns using siRNA pools (Fig 9A). MOSPD2, VAP‐A, and VAP‐B levels were efficiently reduced, by ~ 90, ~ 99, and 84%, respectively. Cells were processed for transmission electron microscopy (TEM) to visualize contacts between the ER and either mitochondria or endosomes. Contacts were either focal or extended up to almost 1 μm. To evaluate the amount of interorganelle contacts, the percentage of the organelle perimeter in contact with the ER was quantified by stereology on random sections, as in 10 (Fig 9). Compared with control cells, HeLa (Fig 9B), and HeLa transfected with a control siRNA (Fig 9C), contacts between the ER and mitochondria were unchanged (Fig 9G) in HeLa cells silenced for MOSPD2 (Fig 9D), VAP‐A, and VAP‐B (Fig 9E), and MOSPD2, VAP‐A, and VAP‐B (Fig 9F). Though, ER–endosome contacts were affected by MOSPD2 silencing. Indeed, the surface of contact between the ER and endosomes was reduced upon MOSPD2, or MOSPD2/VAP‐A/VAP‐B silencing (Fig 9H). Using this methodology, the silencing of VAP‐A and VAP‐B proteins alone did not result in a significant reduction in contacts. We reasoned that the decrease in ER–endosome contacts might result in changes in other interorganelle contacts involving endosomes, such as endosome–endosome contacts. Indeed, we observed that contacts between endosomes and endosomes were more frequent in MOSPD2‐silenced cells (Fig 9D and F), a phenotype that we quantified (Fig 9I). To substantiate these results, we repeated the experiments using a different silencing method and analyzed the ultrastructure of HeLa cells silenced with an shRNA strategy for MOSPD2. The silencing of MOSPD2 with two different shRNAs, shMOSPD2‐α and shMOSPD2‐β, resulted in a phenotype similar to the one reported above (Appendix Fig S3).
Figure 9. MOSPD2 silencing affects interorganelle contact sites organization.
-
AWestern blot analysis of MOSPD2, VAP‐A, and VAP‐B proteins in control HeLa cells (WT) and in HeLa cells transfected with a control siRNA (siCtrl), and with siRNA targeting MOSPD2 (siMOSPD2), VAP‐A, and VAP‐B (siVAP‐A/VAP‐B), and MOSPD2, VAP‐A, and VAP‐B (siMOSPD2/VAP‐A/VAP‐B).
-
B–FTEM images of control HeLa cells (B: HeLa; C: HeLa/siCtrl) and MOSPD2 (D: siMOSPD2), VAP‐A, and VAP‐B (E: siVAP‐A/VAP‐B), and MOSPD2‐, VAP‐A‐, and VAP‐B (F: siMOSPD2/VAP‐A/VAP‐B)‐silenced HeLa cells. An interpretation scheme representing contacts between organelles is shown on the right; the ER, endosomes, and ILV are in dark, light, and medium gray, respectively. Mitochondria and Golgi are in pink and light green, respectively. Scale bars: 500 μm.
-
G–IQuantification by stereology of ER–mitochondria (G), ER–endosome (H), and endosome–endosome (I) contacts. The percentages of mitochondria perimeter in contact with the ER (G), endosome perimeter in contact with the ER (H), and endosome perimeter in contact with an endosome (I) are shown as means and error bars (SEM). (G) 200 (HeLa), 208 (siCtrl), 199 (siMOSPD2), 202 (siVAP‐A/VAP‐B), 199 (siMOSPD2/VAP‐A/VAP‐B) mitochondria from 8, 10, 8, 12, and 12 cells, respectively, were analyzed. (H, I) 202 (HeLa), 189 (siCtrl), 148 (siMOSPD2), 141 (siVAP‐A/VAP‐B), 221 (siMOSPD2/VAP‐A/VAP‐B) endosomes from 9, 19, 10, 14, and 12 cells, respectively, were analyzed. Kruskal–Wallis with Dunn's multiple comparison test (*P‐values < 0.05; ***P < 0.001; ****P < 0.0001).
Source data are available online for this figure.
These data show that MOSPD2 loss affects interorganelle contacts, more specifically ER–endosome and endosome–endosome contacts.
Discussion
The formation of membrane contact sites is now recognized as an important mode of communication between organelles 5. In this context, the ER has a predominant place: firstly, the ER is a large organelle constituted of a network of sheets and tubules extending throughout the cytoplasm; secondly, the ER network makes extensive contacts with the other organelles of the cell which are essential for intracellular exchanges and proper organelle positioning and maturation 3. The ER‐resident proteins named VAP‐A and VAP‐B are able to tether organelles by interacting with linear motifs, called FFAT, present in over a hundred proteins 8, 9. The ability of VAP proteins to be partners of so many proteins is startling. Intriguingly, when VAP proteins are downregulated, ER–organelle contacts persist 16, 24. Therefore, it was tempting to speculate that other proteins might have a similar tethering activity. By using a proteomic approach, we identified a new protein of the VAP family named MOSPD2 which resides on the ER and acts as a receptor for FFAT‐bearing proteins to mediate the formation of MCSs (Fig 10).
Figure 10. MOSPD2 tethers the ER to organelles bearing FFAT‐containing proteins.
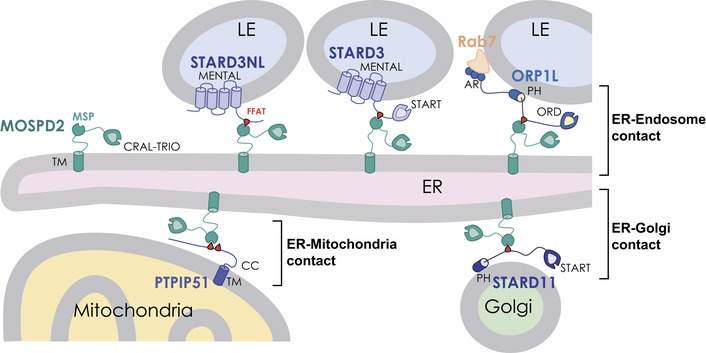
Schematic representation of ER–endosome, ER–mitochondria, and ER–Golgi contacts involving MOSPD2 and a number of its interacting partners: STARD3NL, STARD3, ORP1L, PTPIP51, and STARD11. LE, late endosome; ER, endoplasmic reticulum; TM, transmembrane domain; MSP, Major Sperm Protein domain; FFAT, Two phenylalanines in an acidic tract motif 9, 26; CRAL‐TRIO, cellular retinaldehyde‐binding protein and triple functional domain protein domain 48; MENTAL, metastatic lymph node 64 N‐terminal domain, anchoring STARD3 and STARD3NL to the LE membrane 53, 65; START, steroidogenic acute regulatory protein (StAR)‐related lipid Transfer domain; in STARD11 (CERT), the START domain is mediating ceramide transfer from the ER to the Golgi 70, and in STARD3, the START domain is involved in cholesterol transfer from the ER to LE (STARD3) 23; PH, pleckstrin homology domain; this domain mediates the association of STARD11 with the Golgi membrane by interacting with PI(4)P; in ORP1L, it might also be involved in phosphoinositide binding‐mediated membrane interaction 51, 71; ORD, oxysterol‐binding protein (OSBP)‐related domain 72; AR, ankyrin repeat domain involved in the interaction with Rab7 at the LE membrane 51; CC, coiled‐coil.
The primary sequence of MOSPD2 shows the presence of an MSP domain which classifies this protein in the same family as VAP proteins. Six human proteins possess an MSP domain, namely VAP‐A, VAP‐B, MOSPD1, MOSPD2, MOSPD3, and CFAP65 (cilia‐ and flagella‐associated protein 65) 35. While CFAP65 expression appears restricted to reproductive organs 36, the other five MSP‐containing proteins are broadly expressed 37. Notably, by looking at open gene expression databases 38, we found that they are expressed in HeLa cells, the model cell line we used here to screen for FFAT‐interacting proteins. However, in our screen designed to isolate FFAT‐binding proteins, we specifically identified VAP‐A, VAP‐B, and MOSPD2; neither MOSPD1 nor MOSPD3 were significantly enriched. Since MOSPD1 and MOSPD3 are expressed at similar levels than MOSPD2 in HeLa cells, we can posit that either they do not bind the FFAT motif or they do but with a lower affinity than VAPs and MOSPD2. Along the same line, by mining high‐throughput interactome studies 34, we found that among the MOSPD proteins, only MOSPD2 was interacting with proteins such as protrudin or STARD3NL which were previously reported to contain an FFAT motif 10, 39. Therefore, we can consider that at least three proteins, VAP‐A, VAP‐B, and MOSPD2, can be receptors for FFAT‐containing proteins.
Besides binding FFAT motifs, VAP proteins have been shown to form homo‐ and hetero‐oligomers which are mainly mediated by their coiled‐coil and transmembrane domains 30, 40. Of note, MOSPD2 was reported to interact with VAP‐A by an unknown mechanism 41. In this report, we showed that in MCS built by the endosomal protein STARD3NL, both MOSPD2 and VAP were present. Although light microscopy does not resolve single tethering complexes, we can speculate that the three proteins VAP‐A, VAP‐B, and MOSPD2 may form clusters at the surface of the ER; by exposing their MSP domains in the cytosol, these clusters would be binding platforms for proteins harboring an FFAT motif enabling the formation of contact sites.
Approximately 100 proteins, grouped under the name VAPome (VAP interactome), have been shown to interact with VAPs 8, 34. The majority of these interactions are mediated by the ability of the MSP domain of VAPs to interact with FFAT motifs. Intriguingly, FFAT motif sequences are quite diverse; besides the consensus FFAT sequence originally defined (EFFDAxE), many related sequences, so‐called FFAT‐like motifs, also bind VAPs 8, 9. Interestingly, we showed that MOSPD2 binds both FFAT and FFAT‐like sequences. MOSPD2 and VAP proteins share similarly folded MSP domains. Moreover, the affinities for consensus FFAT motifs are similar for the MSP domains of VAP proteins and MOSPD2. In this study, by looking at this MOSPome (MOSPD2 interactome) in HeLa cell, we found an overlap with the VAPome. Along the same line, we show here that MOSPD2 is mediating the formation of membrane contact sites with established VAP partners from distinct organelles. How the balance between contact sites mediated by VAPs and MOSPD2 is modulated remains unclear. The abundance of the respective proteins is probably a regulator for the dynamics of ER‐born MCS. For instance, in our study, we showed that VAP‐A is more abundant than VAP‐B (30‐fold) and MOSPD2 (200‐fold). It is then plausible that the concentration of a given tether may regulate the molecular landscape of MCS in a cell type‐ and context‐specific manner. Furthermore, besides tethering complexes involving VAPs and FFAT‐containing proteins, several complexes which do not involve VAPs have been described; for instance, extended synaptotagmins (E‐Syts) which mediate ER–plasma membrane (PM) contacts in a Ca2+ and phosphoinositide‐dependent manner, and ORP5/ORP8 which are anchored in the ER and mediate both ER–PM and ER–mitochondria contact formation 42, 43, 44, 45. Most probably, other complexes are yet to be identified. Membrane contact sites are morphologically defined by electron microscopy techniques as regions where two distinct organelle membranes are separated by a short spacing 1. The spacing between membranes most probably restricts the recruitment of specific tethering complexes in a given contact; indeed, this spacing must be compatible with the size of the protein complex mediating membrane attachment. Still, the great diversity of tether proteins described so far suggests that many different types of bridging complexes are present within a zone of apposition, and therefore that the formation of these structures relies on highly redundant mechanisms. The identification of MOSPD2 as a new FFAT‐binding protein further supports this idea.
Using EM which provides a direct visualization of MCS and allows their quantification, we examined MCS between the ER and mitochondria and endosomes in cells lacking either MOSPD2 or VAPs or both MOSPD2 and VAPs. In our experiments, VAP loss was not associated with a significant decrease of ER–mitochondria or ER–endosome contacts. However, other studies that have looked at specific contacts, such as those occurring during EGF signaling, found that ER/EGFR‐endosome contacts were unaffected by the loss of VAPs, while the ER/non‐EGFR‐endosome contacts were impaired by 50% 24. In addition, in highly specialized cells such as motoneurons, Stoica et al 16 showed a decrease in ER–mitochondria contacts after VAP‐B silencing. These findings and our results probably reveal a cell type‐ and context‐dependent requirement of VAP proteins in MCS formation. Here, we showed that MOSPD2 does not participate to the steady‐state level of ER–mitochondria MCS. In contrast, MOSPD2 contributes to the formation of ER–endosome contacts, and this function appears independent from the presence of VAP protein. Concomitantly with the reduction in ER–endosome MCS, we showed that endosome–endosome contacts were specifically increased in the absence of MOSPD2, revealing a further alteration in endosomes. How MOSPD2 precisely alters endosome dynamics is unclear. Previously, Rowland et al 46 showed that contact sites between endosomes and the ER define the position and timing for endosome fission. Thus, we can speculate that the decrease in ER–endosome contacts upon MOSPD2 depletion impairs endosome positioning and maturation.
The different roles of VAPs and MOSPD2 on ER–endosome contacts reported here support the idea that the function of MCS formed by MOSPD2 is unique. It is important to mention that MOSPD2 distinguishes itself from VAP proteins by the presence of an amino‐terminal CRAL‐TRIO domain. The CRAL‐TRIO domain forms a hydrophobic pocket and has been implicated in lipid transport in several proteins. For instance, the Saccharomyces cerevisiae Sec14p protein counterexchanges phosphatidylinositol (PI) and phosphatidylcholine (PC) between membranes 47, 48, 49. Among the 28 human proteins possessing this domain, some were shown to bind small lipids among which are PC, PI, squalene, tocopherols, and retinaldehyde 50. Thus, MOSPD2 possesses a domain potentially able to transport a lipidic ligand. The presence in the same protein of a MSP domain able to recruit several lipid transfer proteins (LTPs) bearing FFAT motifs, and a domain potentially able to transport lipids is unique. This protein organization suggests that the CRAL‐TRIO serves as a regulatory or a lipid transfer domain. Indeed, the CRAL/TRIO domain might regulate the binding of FFAT‐containing proteins by MOSPD2 in a lipid‐dependent manner and therefore provide binding specificity in a defined lipid context. Alternatively, the complex formed by MOSPD2 and an FFAT‐bearing LTP could provide a mean to counterexchange lipids between membranes, one lipid species being transported by the LTP‐binding domain and the other one by the CRAL‐TRIO domain.
By tethering the ER and other organelles, MOSPD2 functions most probably in intracellular exchanges and communication. Further work is needed to understand the functional specificities of MOSPD2 compared to VAPs and the physiological role of contacts involving MOSPD2.
Materials and Methods
Cloning and constructs
MOSPD2 cDNA was obtained from the Dana‐Farber/Harvard Cancer Center PlasmID Repository (Plasmid ID: HsCD00076319). MOSPD2 R404D/L406D (referred to as RD/LD) and MOSPD2 ΔTM mutants were constructed by site‐directed mutagenesis (RD/LD primers: 5′‐TCTGC CCAAG ACGAT TTTGA CATAA TGGCT GCAGA AATGG AA‐3′ and 5′‐ TGCAG CCATT ATGTC AAAAT CGTCT TGGGC AGAGA CTGTT AA‐3′; ΔTM primers: 5′‐ CAG CGT TGT ATC TGA ATT CCA GCA GCT GCT GCT TTC C‐3′ and 5′‐CAG CTG CTG GAA TTC AGA TAC AAC GCT GAA CTT GGT C). WT, RD/LD, and ΔTM MOSPD2 cDNAs were subcloned into the pEGFP‐C1 and the pmCherry‐C1 vectors, to generate GFP‐ and mCherry‐tagged expressing constructs, respectively. The GFP‐MOSPD2 (WT, RD/LD, and ΔTM mutants) encoding cDNAs were then subcloned in the pQCXIP retroviral vector.
The following constructs were kind gifts: pcDNA3.1 Flag‐STARD11 and pcDNA3.1 Flag‐STARD11 D324A from K. Hanada (National Institute of Infectious Diseases, Tokyo, Japan) 11; pCINeo‐HA‐PTPIP51 from C. Miller (King's College London, UK) 18, 44; ORP1L‐GFP from J. Neefjes (Leiden University Medical Center, Netherlands) 51, 52. pCINeo‐HA‐PTPIP51 ΔFFAT‐like (aa157‐172) was constructed by site‐directed mutagenesis (primers: 5′‐GAC TCC ACT GGC TCC AGC TCT GAA GGG GGT TAC ACA ACA GCC‐3′ and 5′‐GGC TGT TGT GTA ACC CCC TTC AGA GCT GGA GCC AGT GGA GTC‐3′). ORP1L F476A/Y477A mutant (referred to FA/YA) was constructed by site‐directed mutagenesis (primers: 5′‐AGCGA GGACG AGGCC GCTGA TGCGC TGTCA GATTC CGAGT CC‐3′ and 5′‐ATCTG ACAGC GCATC AGCGG CCTCG TCCTC GCTAA GGATG CT‐3′). ORP1L and ORP1L FA/YA were subcloned in fusion with the Flag tag in the pQCXIP vector. Flag‐tagged STARD3, STARD3 FA/YA, STARD3NL, STARD3NL ΔFFAT, and GFP‐ER expressing constructs were previously described 10, 23, 53, 54.
The MSP domain of MOSPD2 [282–490]‐encoding fragments (WT or RD/LD mutant) were amplified by PCR and subcloned into the pET‐15b vector for expression as C‐terminal 6His‐tag proteins in E. coli. The MSP domain and the coiled‐coil of VAP‐A [8–212] expression vectors (WT and KD/MD mutant) were previously described 23. The MSP domain and the coiled‐coil of VAP‐B [1–210] encoding fragments (WT and KD/MD mutant) were amplified by PCR and subcloned into the pET‐15b vector for expression as C‐terminal 6His‐tag proteins in E. coli.
To obtain shRNA expression vectors targeting MOSPD2 (target sequence α: 5′‐ATGGA CTTTG TACGC TTTAT C‐3′ or β: 5′‐CCCAG ATGGT TATTG GAAAT T‐3′), annealed oligonucleotides were cloned into the pLKO.1 vector (blasticidine resistance cassette) 55.
To silence VAP proteins, we used the previously described shRNA expression vectors targeting VAP‐A (target sequence α: 5′‐GCGAAATCCATCGGATAGAAA‐3′ or β: 5′‐CACTTAATGATACCGAAACAA‐3′) or VAP‐B (α: 5′‐GCAGAGAATGATAAACCACAT‐3′ or β: 5′‐CCAGTTCTGTTTGACTATGTA‐3′) 10.
ON‐TARGET plus siRNA pool (Thermo Fisher) transfected with Lipofectamine RNAiMAX reagent (Invitrogen) were used to silence MOSPD2 (158747), VAP‐A (9218), and VAP‐B (9217).
All constructs were verified by DNA sequencing (GATC Biotech).
Sequence and structure analysis
Protein sequences were aligned using ClustalW 56. The structure of the rat VAP‐A MSP domain in complex with an FFAT motif (PDB ID: 1Z9O) 27 and the structure of the human MOSPD2 MSP domain (PDB ID: 1WIC; https://doi.org/10.2210/pdb1wic/pdb; Endo, H., Asakura, K., Nemoto, N., Takasugi, K., Izumie, K., Yoshida, M., Hayashi, F., Yokoyama, S., RIKEN Structural Genomics/Proteomics Initiative; solution structure of the MSP domain of RIKEN cDNA 6030424E15) were aligned using Pymol 57.
Cell culture, transfections, and infections
HeLa cells (American Type Culture Collection CCL‐2) were maintained in DMEM with 5% fetal calf serum (FCS) and 40 μg/ml gentamycin. 293T (ATCC CRL‐3216) cells were maintained in DMEM with 10% fetal calf serum (FCS), penicillin 100 UI/ml, and streptomycin 100 μg/ml.
Cells were transfected using X‐tremeGENE 9 DNA Transfection Reagent (Roche). To generate retroviral particles, pQCXIP vectors were co‐transfected with pCL‐Ampho vector (Imgenex) into 293T retroviral packaging cell line. To generate lentiviral particles, pLKO.1 vectors were co‐transfected with three packaging plasmids pLP1, pLP2, and pLP/VSVG (Invitrogen) into the 293T cell line. Then, viral particles supplemented with 10 μg/ml polybrene and 20 mM HEPES were incubated with HeLa cells.
Retroviral infections were used to generate HeLa/Ctrl, HeLa/GFP‐MOSPD2, and HeLa/GFP‐MOSPD2 RD/LD cell lines. The HeLa/Ctrl cell line was obtained using the empty pQCXIP plasmid.
For lentiviral infection, pLKO.1 vectors were co‐transfected with three packaging plasmids pLP1, pLP2, and pLP/VSVG (Invitrogen) into the 293T cell line. Viral particles supplemented with 10 μg/ml polybrene and 20 mM HEPES were then incubated with HeLa cells.
HeLa selection was performed using 0.5 μg/ml puromycin or 4 μg/ml blasticidine.
Antibody production
The recombinant MSP domain of MOSPD2 and the recombinant START domain of STARD3 23 were used to generate the 1MOS‐4E10 and the 1STAR‐2G5 mouse monoclonal antibodies, respectively, as described before 58.
Immunofluorescence
Immunofluorescence was performed as previously described 53. Primary antibodies were rabbit anti‐MOSPD2 (1:250; A105239, Sigma), rabbit anti‐Flag (1:1,000; F7425, Sigma), rabbit anti‐HA (1:1,000; H6908, Sigma), goat anti‐VAP‐A (1:500; K‐15, Santa Cruz Biotechnology, sc‐48698), goat anti‐Calnexin (1:500; C‐20, Santa Cruz Biotechnology, sc‐6465), mouse anti‐Lamp1 (1:50; H4A3, DSHB), mouse anti‐OPA‐1 (1:1,000; 1A8, Merck), and rabbit anti‐GM130 (1:1,000; 11308‐1‐AP, Proteintech). To stain both endogenous MOSPD2 and VAP‐A proteins, cells were fixed with a glyoxal solution (7.8% glyoxal (Sigma, 128464), 20% ethanol, 0.75% acetic acid, pH 5) for 10 min at room temperature 59. Slides were mounted in ProLong Gold (Invitrogen). Observations were made with a confocal microscope (Leica TCS SP5 inverted, 63×, NA 1.4).
Colocalization analysis
Linescans were drawn using ImageJ software (plot profile function; http://rsbweb.nih.gov/ij/). Co‐localization was visualized using the co‐localization highlighter plugin for ImageJ.
Pearson's correlation coefficient was determined using the Coloc2 plugin in Fiji software. The auto‐thresholding was performed using the Costes method 60.
SDS–PAGE, Western blot, and Coomassie blue staining
SDS–PAGE and Western blot analysis were performed as previously described 54 using the following antibodies: rabbit anti‐GFP (1:5,000; GFP‐2A3, Merck), rabbit anti‐FLAG (1:1,000; F7425, Sigma), rabbit anti‐HA (1:1,000; H6908, Sigma), rabbit anti MOSPD2 (1:1,000; A105239, Sigma), mouse anti‐MOSPD2 (1:2; 1MOS‐4E10), goat anti‐VAP‐A (1:1,000; K‐15, Santa Cruz Biotechnology, sc‐48698), mouse anti‐VAP‐A (1:1,000; 4C12, Santa Cruz Biotechnology, sc‐293278), rabbit anti‐VAP‐B (kind gift from Dr. L. Dupuis 61), rabbit anti‐STARD3 (1:1,000; pAbMLN64‐Ct‐605; 58), rabbit anti‐STARD3NL (1:1,000; pAbMENTHO‐Ct‐1545; 53), rabbit anti‐ORP1 (1:1,000; abcam; ab131165), and mouse anti‐actin (1:5,000; ACT‐2D7, Euromedex).
Coomassie blue staining was performed with PageBlue Protein Staining Solution (Thermo Fisher Scientific).
Protein expression and purification
Recombinant proteins were expressed in E. coli BL21 DE3 strain at 20°C for 16 h upon induction with 1 mM IPTG (at an optical density (OD) equal to 0.5 at λ = 600 nm). Purification was performed in lysis buffer [50 mM sodium phosphate pH 8.0, 300 mM NaCl, 10 mM imidazole, 1× Complete protease inhibitor cocktail (Roche)]. Cells were treated during 30 min with lysozyme (L6876, Sigma) at 4°C and then sonicated for 15 min on ice. The lysate was centrifuged twice at 11,000 g for 30 min at 4°C. The supernatant was mixed with NTA‐Ni2+ agarose beads (HIS‐Select® Nickel Affinity Gel, P6611, Sigma). After 1 wash with lysis buffer, proteins were eluted with elution buffer [20 mM sodium phosphate, 250 mM imidazole, pH 7.4]. Proteins were further purified by gel filtration (HiLoad 16/60 Superdex 75; GE Healthcare Life Sciences) in GF Buffer (20 mM Tris–HCl pH 7.5, 150 mM NaCl). Proteins were concentrated with an Amicon Ultra‐15 10 kDa centrifugal filter unit (Merck). Protein concentration was determined by ultraviolet absorption.
Pull‐down assays
Peptide pull‐down
The affinity resin was prepared by incubating 1.2 nmol of peptide (synthesized in house) with 200 μl of streptavidin beads (PureProteome Streptavidin magnetic beads, Merck) in a total volume of 10 ml pull‐down buffer 1 (PDB1) [50 mM Tris–HCl pH 7.4, 75 mM NaCl, 1 mM EDTA, 1% Triton X‐100, Complete protease inhibitor cocktail (Roche)] under constant agitation (1 h, room temperature). The beads were then washed twice with 10 ml of PDB1.
1.8 × 10⁸ HeLa cells were pelleted by centrifugation, washed with 20 ml of TBS (50 mM Tris–HCl pH 7.4, 150 mM NaCl), and lysed with 10 ml of cold PDB1. After a 20‐min incubation on ice, the protein extract was separated from cell debris by centrifugation (10 min; 9,500 g; 4°C). The protein extract was mixed with peptide‐coupled streptavidin beads and incubated for 2.5 h at 4°C under constant agitation. The beads were then washed three times with PDB1, and proteins were eluted with Laemmli buffer.
MOSPD2 pull‐down
The affinity resin was prepared by incubating 100 mg of recombinant protein with 50 μl of nickel beads (PureProteome Nickel magnetic beads, Merck) in 1 ml pull‐down buffer 2 (PDB2) [50 mM Tris–HCl pH 7.4, 50 mM NaCl, 1 mM EDTA, 1% Triton X‐100, 5 mM imidazole, Complete protease inhibitor cocktail] under constant agitation (1 h, 4°C). The beads were then washed three times with 1 ml of PDB1.
3 × 10⁸ HeLa cells were washed with 5 ml of TBS and lysed with 1 ml of PDB2. After a 10‐min incubation on ice, the protein extract was purified from cell debris by centrifugation (10 min; 9,500 g; 4°C). The protein extract was mixed with protein‐coupled nickel beads and incubated for 2.5 h at 4°C under constant agitation. The beads were then washed three times with PDB2, and proteins were eluted with Laemmli buffer.
GFP‐Trap and immunoprecipitation
GFP‐Trap beads (GFP‐Trap_MA, ChromoTek) were washed three times with 1 ml of cold pull‐down buffer 3 (PDB3) [50 mM Tris–HCl pH 7.4, 50 mM NaCl, 1 mM EDTA, 1% Triton X‐100, Complete protease inhibitor cocktail].
GFP‐MOSPD2 or GFP‐MOSPD2 RD/LD stably expressing cells were transfected with plasmids expressing WT or FFAT motif mutant STARD3, STARD3NL, STARD11, ORP1L, or PTPIP51. Two days after transfection, adherent cells were washed two times with cold PBS and lysed in PDB3. The protein extract (500 μg of proteins) was incubated with 20 μl of beads in a total volume of 1 ml under constant agitation (1 h, 4°C). The beads were washed three times with 1 ml of PDB3, and proteins were eluted at room temperature with Laemmli buffer.
Immunoprecipitations were performed as previously described 54 using Anti‐Flag‐M2 affinity gel (A2220, Sigma) or mouse anti‐STARD3 (1STAR‐2G5).
Mass spectrometry analysis
Eluted proteins were precipitated with trichloroacetic acid and digested with Lys‐C (Wako) and trypsin (Promega). The peptides were then analyzed using an Ultimate 3000 nano‐RSLC (Thermo Scientific) coupled in line with an Orbitrap ELITE (Thermo Scientific).
Surface plasmon resonance
Surface plasmon resonance data were collected on a Biacore T200 instrument (GE Healthcare, Uppsala, Sweden) at 25°C with autosampler rack base cooled at 15°C as described previously 62. Briefly, a CM5 sensor surface was first conditioned and extensively washed before attaching streptavidin followed by immobilization of biotinylated peptides. In order to minimize SPR artifact effects, the levels of immobilized peptides (50 RU) were kept low by injecting a highly diluted peptide solution (1 to 10 ng/ml) at a high flow rate (90 μl/min). The running buffer for kinetic measurements was 50 mM Tris, 75 mM NaCl, pH 7.0 (filtered through a 0.22 μm membrane), supplemented with 0.005% (v/v) surfactant P20. Binding experiments were performed for three biotinylated peptides. An empty control surface was systematically included on every chip to serve as a control for non‐specific binding of the analyte to the matrix and for monitoring changes in solution refractive index. Analytes were simultaneously injected over the four flow cells at 8–10 different monomer concentrations ranging between 0 and 20 μM. At least two concentrations have been reproduced in non‐consecutive cycles. Injection and post‐injection times were 120 and 180 s, respectively. The flow rate was 50 μl/min. Data were processed using the BiaEvaluation 3.2 software (GE Healthcare, Uppsala, Sweden) using “double referencing” 63 in which sensorgrams were corrected for buffer effects and bulk refractive index changes.
The steady‐state binding signal (R eq) was derived by averaging the signals in a five second window at equilibrium. Steady‐state analysis was performed by fitting the average signal R eq as a function of total analyte concentration, assuming a simple 1:1 interaction binding isotherm model. The quality of the fit was assessed by two criteria: (i) the match of the fitted maximum capacity of the surface (R max) with the expected maximum capacity (R theo) inferred from the biotinylated peptide level and (ii) the χ2 parameter which is a statistical measure of how closely the model fits the experimental data. The root square of this parameter should always be below 10% of the globally fitted R max values (BiaEvaluation software user manual, 2005). Data repeatability was investigated by triplicating at least two concentrations over the analyte series. Comparison of equilibrium data obtained for the same analyte displayed a repeatability of around 5%.
Dynamic light scattering measurements of liposomes aggregation
Liposome preparation
DOPC (1,2‐dioleoyl‐sn‐glycero‐3‐phosphocholine), DOGS‐NTA‐Ni2+ (1,2‐dioleoyl‐sn‐glycero‐3‐[(N‐(5‐amino‐1‐carboxypentyl)iminodiacetic acid)succinyl]), and 18:1/18:1 MPB‐PE (1,2‐dioleoyl‐sn‐glycero‐3‐phosphoethanolamine‐N‐[4‐(p‐maleimidophenyl)butyramide]) were purchased from Avanti Polar Lipids. Lipids, stored in stock solutions in CHCl3 or methanol, were mixed at the desired molar ratio. The solvent was removed in a rotary evaporator under vacuum. The mix of DOGS‐NTA‐Ni2+ and MPB‐PE lipid film were pre‐warmed to 33°C for 5 min prior to drying. The films were hydrated in Tris/NaCl (50 mM/120 mM) buffer to obtain a suspension of multilamellar liposomes. The suspensions were extruded through polycarbonate filters of 0.2 μm pore size using a mini‐extruder (Avanti Polar Lipids). Liposomes were stored at 4°C and used within 2 days.
Dynamic light scattering measurements of liposomes aggregation
The experiments were performed at 25°C in a DynaPro apparatus (Protein Solutions). The sample initially contained LA liposomes (50 μM total lipids) in Tris/NaCl (50 mM/120 mM) buffer freshly degassed and a conventional FFAT motif (sequence of OSBP FFAT: WCSGKGDMSDEDDENEFFDAPEIITMPENLGH; 380 nM final concentration) mixed in a thermomixer at 850 rpm/5 min/25°C. Then, 18 μl was put in a small quartz cell (volume 20 μl) and a first set of about 12 autocorrelation curves was acquired to measure the size distribution of the initial liposome suspension. After, LB liposomes (50 μM) and MSP MOSPD2 WT (760 nM) or MSP MOSPD2 (RD/LD; 760 nM) were successively added. The kinetics of aggregation was followed by acquiring one autocorrelation curve every 10 s. At the end of the experiment, a set of 12 autocorrelation functions was acquired. The data were analyzed using two different algorithms provided by the Dynamics v6.1 software (Protein Solutions). During the aggregation process, the autocorrelation functions were fitted assuming that the size distribution is a simple Gaussian function. This mode, referred as the monomodal or cumulant algorithm, gives a mean radius, R, and the width (or polydispersity). The polydispersity is represented in the kinetics measurements by the shaded area and can reach very large values because of the simultaneous presence of free liposomes and of liposomes aggregates of various sizes. Before and after the aggregation process, the autocorrelation functions were fitted using a more refined algorithm, referred as a regularization algorithm. This algorithm is able to resolve several populations of different size, such as free liposomes and liposomes aggregates.
Electron microscopy
Electron microscopy was performed as previously described 10, 23. Cells grown on carbon‐coated sapphire disks were cryoprotected with DMEM containing 10% FCS and frozen at high pressure (HPM 10 Abra Fluid AG). Samples were then freeze‐substituted and embedded in lowicryl HM20. Thin sections were collected on formvar‐/carbon‐coated nickel slot grids and stained with uranyl acetate and lead citrate. Imaging was performed with a transmission electron microscope (Philips CM12) coupled to an Orius 1000 CCD camera (Gatan). Quantification by stereology was performed as previously described 10, 23.
Statistical analyses
Statistical analyses were performed using the Kruskal–Wallis or the Mann–Whitney non‐parametric tests (Prism, GraphPad). For the Kruskal–Wallis test, all conditions were compared with the Dunn's multiple comparison test.
P‐values < 0.05, < 0.01, < 0.001, and < 0.0001 are identified with 1, 2, 3, and 4 asterisks, respectively. ns: P ≥ 0.05.
Data availability
The mass spectrometry proteomics data have been deposited to the ProteomeXchange Consortium via the PRIDE 64 partner repository with the dataset identifier PXD009575.
Author contributions
FA and CT designed the project; TDM, CW, and FA performed most of the cell biology and biochemical experiments; YN performed and analyzed the SPR experiments; SI and GD designed, performed, and analyzed the liposome aggregation experiments; FG made the PTPIP51 constructs; DS, TDM, LPW, and FA performed and analyzed the electron microscopy experiments; CM assisted in designing and interpreting experiments; and FA, TDM, and CT wrote the manuscript. All authors commented on the manuscript.
Conflict of interest
The authors declare that they have no conflict of interest.
Supporting information
Appendix
Expanded View Figures PDF
Source Data for Expanded View and Appendix
Review Process File
Source Data for Figure 1E
Source Data for Figure 5
Source Data for Figure 8B
Source Data for Figure 9A
Acknowledgements
We thank Alastair McEwen for his critical reading of the manuscript. We thank the members of the Molecular and Cellular Biology of Breast Cancer (IGBMC) team and Toshihide Kobayashi for helpful advice and discussions. We thank the IGBMC peptide synthesis facility (Pascal Eberling), the Structural biology & genomics platform (Catherine Birck and Florence Granger for the gel filtration analysis, and Pierre Poussin‐Courmontagne for the SEC‐MALS analysis), the Proteomics platform (Frank Ruffenach, Virginie Chavant, Adeline Page and Luc Negroni), the cell culture facility (Betty Heller), the imaging center (EM: Coralie Spiegelhalter, and light microscopy), the polyclonal antibody facility (Gilles Duval), the monoclonal antibody facility (Mustapha Oulad‐Abdelghani), the Genomeast platform (Doulaye Dembélé) for their excellent technical assistance. We are grateful to the EM Core Facility, European Molecular Biology Laboratory (EMBL), Heidelberg, Germany, especially to Yannick Schwab, Androniki Kolovou, and Paolo Ronchi for their help with EM. We wish to thank Luc Dupuis (INSERM U118, Strasbourg, FR) for providing the anti‐VAP‐B antibody, Jacques Neefjes (Leiden University Medical Center, NL) the ORP1L cDNA, Kentaro Hanada (National Institute of Infectious Diseases, Tokyo, JP) the STARD11/CERT constructs, Romain Galmes (Institut de Biologie Intégrative de la Cellule, Paris, FR), and Christopher C. Miller (King's College London, UK) the PTPIP51 constructs.
T.D.M. received an allocation from the Ministère de l'Enseignement Supérieur et de la Recherche (France; http://www.enseignementsup-recherche.gouv.fr/). This work was supported by grants from the Ligue Contre le Cancer (Conférence de Coordination Interrégionale du Grand Est; https://www.ligue-cancer.net), the Institut National Du Cancer INCA (INCA_9269; http://www.e-cancer.fr). We also acknowledge funds from the Institut National de Santé et de Recherche Médicale (http://www.inserm.fr/), the Centre National de la Recherche Scientifique (http://www.cnrs.fr/), the Université de Strasbourg (http://www.unistra.fr), the French Infrastructure for Integrated Structural Biology (FRISBI) ANR‐10‐INBS‐05, and the Grant ANR‐10‐LABX‐0030‐INRT, a French State fund managed by the Agence Nationale de la Recherche under the frame program Investissements d'Avenir ANR‐10‐IDEX‐0002‐02.
EMBO Reports (2018) 19: e45453
Contributor Information
Catherine Tomasetto, Email: catherine-laure.tomasetto@igbmc.fr.
Fabien Alpy, Email: fabien.alpy@igbmc.fr.
References
- 1. Gatta AT, Levine TP (2017) Piecing together the patchwork of contact sites. Trends Cell Biol 27: 214–229 [DOI] [PubMed] [Google Scholar]
- 2. Holthuis JCM, Levine TP (2005) Lipid traffic: floppy drives and a superhighway. Nat Rev Mol Cell Biol 6: 209–220 [DOI] [PubMed] [Google Scholar]
- 3. Phillips MJ, Voeltz GK (2016) Structure and function of ER membrane contact sites with other organelles. Nat Rev Mol Cell Biol 17: 69–82 [DOI] [PMC free article] [PubMed] [Google Scholar]
- 4. Eisenberg‐Bord M, Shai N, Schuldiner M, Bohnert M (2016) A tether is a tether is a tether: tethering at membrane contact sites. Dev Cell 39: 395–409 [DOI] [PubMed] [Google Scholar]
- 5. Helle SCJ, Kanfer G, Kolar K, Lang A, Michel AH, Kornmann B (2013) Organization and function of membrane contact sites. Biochim Biophys Acta 1833: 2526–2541 [DOI] [PubMed] [Google Scholar]
- 6. Raiborg C, Wenzel EM, Stenmark H (2015) ER–endosome contact sites: molecular compositions and functions. EMBO J 34: 1848–1858 [DOI] [PMC free article] [PubMed] [Google Scholar]
- 7. Lev S, Ben Halevy D, Peretti D, Dahan N (2008) The VAP protein family: from cellular functions to motor neuron disease. Trends Cell Biol 18: 282–290 [DOI] [PubMed] [Google Scholar]
- 8. Murphy SE, Levine TP (2016) VAP, a versatile access point for the endoplasmic reticulum: review and analysis of FFAT‐like motifs in the VAPome. Biochim Biophys Acta 1861: 952–961 [DOI] [PubMed] [Google Scholar]
- 9. Loewen CJR, Roy A, Levine TP (2003) A conserved ER targeting motif in three families of lipid binding proteins and in Opi1p binds VAP. EMBO J 22: 2025–2035 [DOI] [PMC free article] [PubMed] [Google Scholar]
- 10. Alpy F, Rousseau A, Schwab Y, Legueux F, Stoll I, Wendling C, Spiegelhalter C, Kessler P, Mathelin C, Rio M‐C et al (2013) STARD3 or STARD3NL and VAP form a novel molecular tether between late endosomes and the ER. J Cell Sci 126: 5500–5512 [DOI] [PubMed] [Google Scholar]
- 11. Kawano M, Kumagai K, Nishijima M, Hanada K (2006) Efficient trafficking of ceramide from the endoplasmic reticulum to the Golgi apparatus requires a VAMP‐associated protein‐interacting FFAT motif of CERT. J Biol Chem 281: 30279–30288 [DOI] [PubMed] [Google Scholar]
- 12. Mesmin B, Bigay J, Moser von Filseck J, Lacas‐Gervais S, Drin G, Antonny B (2013) A four‐step cycle driven by PI(4)P hydrolysis directs sterol/PI(4)P exchange by the ER‐Golgi tether OSBP. Cell 155: 830–843 [DOI] [PubMed] [Google Scholar]
- 13. Perry RJ, Ridgway ND (2006) Oxysterol‐binding protein and vesicle‐associated membrane protein–associated protein are required for sterol‐dependent activation of the ceramide transport protein. Mol Biol Cell 17: 2604–2616 [DOI] [PMC free article] [PubMed] [Google Scholar]
- 14. Rocha N, Kuijl C, van der Kant R, Janssen L, Houben D, Janssen H, Zwart W, Neefjes J (2009) Cholesterol sensor ORP1L contacts the ER protein VAP to control Rab7–RILP–p150Glued and late endosome positioning. J Cell Biol 185: 1209–1225 [DOI] [PMC free article] [PubMed] [Google Scholar]
- 15. Stefan CJ, Manford AG, Baird D, Yamada‐Hanff J, Mao Y, Emr SD (2011) Osh proteins regulate phosphoinositide metabolism at ER‐plasma membrane contact sites. Cell 144: 389–401 [DOI] [PubMed] [Google Scholar]
- 16. Stoica R, Vos KJD, Paillusson S, Mueller S, Sancho RM, Lau K‐F, Vizcay‐Barrena G, Lin W‐L, Xu Y‐F, Lewis J et al (2014) ER–mitochondria associations are regulated by the VAPB–PTPIP51 interaction and are disrupted by ALS/FTD‐associated TDP‐43. Nat Commun 5: 3996 [DOI] [PMC free article] [PubMed] [Google Scholar]
- 17. Weber‐Boyvat M, Kentala H, Lilja J, Vihervaara T, Hanninen R, Zhou Y, Peränen J, Nyman TA, Ivaska J, Olkkonen VM (2015) OSBP‐related protein 3 (ORP3) coupling with VAMP‐associated protein A regulates R‐Ras activity. Exp Cell Res 331: 278–291 [DOI] [PubMed] [Google Scholar]
- 18. De Vos KJ, Morotz GM, Stoica R, Tudor EL, Lau KF, Ackerley S, Warley A, Shaw CE, Miller CC (2012) VAPB interacts with the mitochondrial protein PTPIP51 to regulate calcium homeostasis. Hum Mol Genet 21: 1299–1311 [DOI] [PMC free article] [PubMed] [Google Scholar]
- 19. Dong R, Saheki Y, Swarup S, Lucast L, Harper JW, De Camilli P (2016) Endosome‐ER contacts control actin nucleation and retromer function through VAP‐dependent regulation of PI4P. Cell 166: 408–423 [DOI] [PMC free article] [PubMed] [Google Scholar]
- 20. Eden ER, White IJ, Tsapara A, Futter CE (2010) Membrane contacts between endosomes and ER provide sites for PTP1B–epidermal growth factor receptor interaction. Nat Cell Biol 12: 267–272 [DOI] [PubMed] [Google Scholar]
- 21. Gomez‐Suaga P, Paillusson S, Stoica R, Noble W, Hanger DP, Miller CCJ (2017) The ER‐mitochondria tethering complex VAPB‐PTPIP51 regulates autophagy. Curr Biol 27: 371–385 [DOI] [PMC free article] [PubMed] [Google Scholar]
- 22. Paillusson S, Gomez‐Suaga P, Stoica R, Little D, Gissen P, Devine MJ, Noble W, Hanger DP, Miller CCJ (2017) α‐Synuclein binds to the ER–mitochondria tethering protein VAPB to disrupt Ca2+ homeostasis and mitochondrial ATP production. Acta Neuropathol 134: 129–149 [DOI] [PMC free article] [PubMed] [Google Scholar]
- 23. Wilhelm LP, Wendling C, Védie B, Kobayashi T, Chenard M‐P, Tomasetto C, Drin G, Alpy F (2017) STARD3 mediates endoplasmic reticulum‐to‐endosome cholesterol transport at membrane contact sites. EMBO J 36: 1412–1433 [DOI] [PMC free article] [PubMed] [Google Scholar]
- 24. Eden ER, Sanchez‐Heras E, Tsapara A, Sobota A, Levine TP, Futter CE (2016) Annexin A1 tethers membrane contact sites that mediate ER to endosome cholesterol transport. Dev Cell 37: 473–483 [DOI] [PMC free article] [PubMed] [Google Scholar]
- 25. Costello JL, Castro IG, Hacker C, Schrader TA, Metz J, Zeuschner D, Azadi AS, Godinho LF, Costina V, Findeisen P et al (2017) ACBD5 and VAPB mediate membrane associations between peroxisomes and the ER. J Cell Biol 216: 331–342 [DOI] [PMC free article] [PubMed] [Google Scholar]
- 26. Mikitova V, Levine TP (2012) Analysis of the key elements of FFAT‐like motifs identifies new proteins that potentially bind VAP on the ER, including two AKAPs and FAPP2. PLoS One 7: e30455 [DOI] [PMC free article] [PubMed] [Google Scholar]
- 27. Kaiser SE, Brickner JH, Reilein AR, Fenn TD, Walter P, Brunger AT (2005) Structural basis of FFAT motif‐mediated ER targeting. Structure 13: 1035–1045 [DOI] [PubMed] [Google Scholar]
- 28. Furuita K, Jee J, Fukada H, Mishima M, Kojima C (2010) Electrostatic interaction between oxysterol‐binding protein and VAMP‐associated protein A revealed by NMR and mutagenesis studies. J Biol Chem 285: 12961–12970 [DOI] [PMC free article] [PubMed] [Google Scholar]
- 29. Hamamoto I, Nishimura Y, Okamoto T, Aizaki H, Liu M, Mori Y, Abe T, Suzuki T, Lai MMC, Miyamura T et al (2005) Human VAP‐B is involved in hepatitis C virus replication through interaction with NS5A and NS5B. J Virol 79: 13473–13482 [DOI] [PMC free article] [PubMed] [Google Scholar]
- 30. Kim S, Leal SS, Halevy DB, Gomes CM, Lev S (2010) Structural requirements for VAP‐B oligomerization and their implication in amyotrophic lateral sclerosis‐associated VAP‐B(P56S) neurotoxicity. J Biol Chem 285: 13839–13849 [DOI] [PMC free article] [PubMed] [Google Scholar]
- 31. McCune BT, Tang W, Lu J, Eaglesham JB, Thorne L, Mayer AE, Condiff E, Nice TJ, Goodfellow I, Krezel AM et al (2017) Noroviruses co‐opt the function of host proteins VAPA and VAPB for replication via a phenylalanine–phenylalanine‐acidic‐tract‐motif mimic in nonstructural viral protein NS1/2. MBio 8: e00668–17 [DOI] [PMC free article] [PubMed] [Google Scholar]
- 32. Stark C, Breitkreutz B‐J, Reguly T, Boucher L, Breitkreutz A, Tyers M (2006) BioGRID: a general repository for interaction datasets. Nucleic Acids Res 34: D535–D539 [DOI] [PMC free article] [PubMed] [Google Scholar]
- 33. Kumagai K, Kawano‐Kawada M, Hanada K (2014) Phosphoregulation of the ceramide transport protein CERT at serine 315 in the interaction with VAMP‐associated protein (VAP) for inter‐organelle trafficking of ceramide in mammalian cells. J Biol Chem 289: 10748–10760 [DOI] [PMC free article] [PubMed] [Google Scholar]
- 34. Huttlin EL, Ting L, Bruckner RJ, Gebreab F, Gygi MP, Szpyt J, Tam S, Zarraga G, Colby G, Baltier K et al (2015) The BioPlex network: a systematic exploration of the human interactome. Cell 162: 425–440 [DOI] [PMC free article] [PubMed] [Google Scholar]
- 35. Han SM, Cottee PA, Miller MA (2010) Sperm and oocyte communication mechanisms controlling C. elegans fertility. Dev Dyn 239: 1265–1281 [DOI] [PMC free article] [PubMed] [Google Scholar]
- 36. Tang S, Wang X, Li W, Yang X, Li Z, Liu W, Li C, Zhu Z, Wang L, Wang J et al (2017) Biallelic mutations in CFAP43 and CFAP44 cause male infertility with multiple morphological abnormalities of the sperm flagella. Am J Hum Genet 100: 854–864 [DOI] [PMC free article] [PubMed] [Google Scholar]
- 37. Uhlén M, Fagerberg L, Hallström BM, Lindskog C, Oksvold P, Mardinoglu A, Sivertsson Å, Kampf C, Sjöstedt E, Asplund A et al (2015) Proteomics. Tissue‐based map of the human proteome. Science 347: 1260419 [DOI] [PubMed] [Google Scholar]
- 38. Barretina J, Caponigro G, Stransky N, Venkatesan K, Margolin AA, Kim S, Wilson CJ, Lehár J, Kryukov GV, Sonkin D et al (2012) The cancer cell line encyclopedia enables predictive modelling of anticancer drug sensitivity. Nature 483: 603–607 [DOI] [PMC free article] [PubMed] [Google Scholar]
- 39. Saita S, Shirane M, Natume T, Iemura S, Nakayama KI (2009) Promotion of neurite extension by protrudin requires its interaction with vesicle‐associated membrane protein‐associated protein. J Biol Chem 284: 13766–13777 [DOI] [PMC free article] [PubMed] [Google Scholar]
- 40. Nishimura Y, Hayashi M, Inada H, Tanaka T (1999) Molecular cloning and characterization of mammalian homologues of vesicle‐associated membrane protein‐associated (VAMP‐associated) proteins. Biochem Biophys Res Commun 254: 21–26 [DOI] [PubMed] [Google Scholar]
- 41. Huttlin EL, Bruckner RJ, Paulo JA, Cannon JR, Ting L, Baltier K, Colby G, Gebreab F, Gygi MP, Parzen H et al (2017) Architecture of the human interactome defines protein communities and disease networks. Nature 545: 505–509 [DOI] [PMC free article] [PubMed] [Google Scholar]
- 42. Chung J, Torta F, Masai K, Lucast L, Czapla H, Tanner LB, Narayanaswamy P, Wenk MR, Nakatsu F, Camilli PD (2015) PI4P/phosphatidylserine countertransport at ORP5‐ and ORP8‐mediated ER–plasma membrane contacts. Science 349: 428–432 [DOI] [PMC free article] [PubMed] [Google Scholar]
- 43. Moser von Filseck J, Čopič A, Delfosse V, Vanni S, Jackson CL, Bourguet W, Drin G (2015) Phosphatidylserine transport by ORP/Osh proteins is driven by phosphatidylinositol 4‐phosphate. Science 349: 432–436 [DOI] [PubMed] [Google Scholar]
- 44. Galmes R, Houcine A, van Vliet AR, Agostinis P, Jackson CL, Giordano F (2016) ORP5/ORP8 localize to endoplasmic reticulum–mitochondria contacts and are involved in mitochondrial function. EMBO Rep 17: 800–810 [DOI] [PMC free article] [PubMed] [Google Scholar]
- 45. Giordano F, Saheki Y, Idevall‐Hagren O, Colombo SF, Pirruccello M, Milosevic I, Gracheva EO, Bagriantsev SN, Borgese N, De Camilli P (2013) PI(4,5)P(2)‐dependent and Ca(2+)‐regulated ER‐PM interactions mediated by the extended synaptotagmins. Cell 153: 1494–1509 [DOI] [PMC free article] [PubMed] [Google Scholar]
- 46. Rowland AA, Chitwood PJ, Phillips MJ, Voeltz GK (2014) ER contact sites define the position and timing of endosome fission. Cell 159: 1027–1041 [DOI] [PMC free article] [PubMed] [Google Scholar]
- 47. Bankaitis VA, Aitken JR, Cleves AE, Dowhan W (1990) An essential role for a phospholipid transfer protein in yeast Golgi function. Nature 347: 561–562 [DOI] [PubMed] [Google Scholar]
- 48. Saito K, Tautz L, Mustelin T (2007) The lipid‐binding SEC14 domain. Biochim Biophys Acta 1771: 719–726 [DOI] [PubMed] [Google Scholar]
- 49. Sha B, Phillips SE, Bankaitis VA, Luo M (1998) Crystal structure of the Saccharomyces cerevisiae phosphatidylinositol‐ transfer protein. Nature 391: 506–510 [DOI] [PubMed] [Google Scholar]
- 50. Chiapparino A, Maeda K, Turei D, Saez‐Rodriguez J, Gavin A‐C (2016) The orchestra of lipid‐transfer proteins at the crossroads between metabolism and signaling. Prog Lipid Res 61: 30–39 26658141 [Google Scholar]
- 51. Johansson M, Lehto M, Tanhuanpää K, Cover TL, Olkkonen VM (2005) The oxysterol‐binding protein homologue ORP1L interacts with Rab7 and alters functional properties of late endocytic compartments. Mol Biol Cell 16: 5480–5492 [DOI] [PMC free article] [PubMed] [Google Scholar]
- 52. Johansson M, Rocha N, Zwart W, Jordens I, Janssen L, Kuijl C, Olkkonen VM, Neefjes J (2007) Activation of endosomal dynein motors by stepwise assembly of Rab7‐RILP‐p150Glued, ORP1L, and the receptor betalll spectrin. J Cell Biol 176: 459–471 [DOI] [PMC free article] [PubMed] [Google Scholar]
- 53. Alpy F, Wendling C, Rio M‐C, Tomasetto C (2002) MENTHO, a MLN64 homologue devoid of the START domain. J Biol Chem 277: 50780–50787 [DOI] [PubMed] [Google Scholar]
- 54. Alpy F, Latchumanan VK, Kedinger V, Janoshazi A, Thiele C, Wendling C, Rio M‐C, Tomasetto C (2005) Functional characterization of the MENTAL domain. J Biol Chem 280: 17945–17952 [DOI] [PubMed] [Google Scholar]
- 55. Moffat J, Grueneberg DA, Yang X, Kim SY, Kloepfer AM, Hinkle G, Piqani B, Eisenhaure TM, Luo B, Grenier JK et al (2006) A lentiviral RNAi library for human and mouse genes applied to an arrayed viral high‐content screen. Cell 124: 1283–1298 [DOI] [PubMed] [Google Scholar]
- 56. Larkin MA, Blackshields G, Brown NP, Chenna R, McGettigan PA, McWilliam H, Valentin F, Wallace IM, Wilm A, Lopez R et al (2007) Clustal W and Clustal X version 2.0. Bioinformatics 23: 2947–2948 [DOI] [PubMed] [Google Scholar]
- 57. Schrödinger (2015) The PyMOL molecular graphics system, Version 1.8.
- 58. Moog‐Lutz C, Tomasetto C, Régnier CH, Wendling C, Lutz Y, Muller D, Chenard MP, Basset P, Rio MC (1997) MLN64 exhibits homology with the steroidogenic acute regulatory protein (STAR) and is over‐expressed in human breast carcinomas. Int J Cancer 71: 183–191 [DOI] [PubMed] [Google Scholar]
- 59. Richter KN, Revelo NH, Seitz KJ, Helm MS, Sarkar D, Saleeb RS, D'Este E, Eberle J, Wagner E, Vogl C et al (2018) Glyoxal as an alternative fixative to formaldehyde in immunostaining and super‐resolution microscopy. EMBO J 37: 139–159 [DOI] [PMC free article] [PubMed] [Google Scholar]
- 60. Costes SV, Daelemans D, Cho EH, Dobbin Z, Pavlakis G, Lockett S (2004) Automatic and quantitative measurement of protein‐protein colocalization in live cells. Biophys J 86: 3993–4003 [DOI] [PMC free article] [PubMed] [Google Scholar]
- 61. Kabashi E, El Oussini H, Bercier V, Gros‐Louis F, Valdmanis PN, McDearmid J, Mejier IA, Dion PA, Dupre N, Hollinger D et al (2013) Investigating the contribution of VAPB/ALS8 loss of function in amyotrophic lateral sclerosis. Hum Mol Genet 22: 2350–2360 [DOI] [PubMed] [Google Scholar]
- 62. Fournane S, Charbonnier S, Chapelle A, Kieffer B, Orfanoudakis G, Travé G, Masson M, Nominé Y (2011) Surface plasmon resonance analysis of the binding of high‐risk mucosal HPV E6 oncoproteins to the PDZ1 domain of the tight junction protein MAGI‐1. J Mol Recognit 24: 511–523 [DOI] [PubMed] [Google Scholar]
- 63. Myszka DG (1999) Improving biosensor analysis. J Mol Recognit 12: 279–284 [DOI] [PubMed] [Google Scholar]
- 64. Vizcaíno JA, Csordas A, del‐Toro N, Dianes JA, Griss J, Lavidas I, Mayer G, Perez‐Riverol Y, Reisinger F, Ternent T et al (2016) 2016 update of the PRIDE database and its related tools. Nucleic Acids Res 44: D447–D456 [DOI] [PMC free article] [PubMed] [Google Scholar]
- 65. Alpy F, Stoeckel M‐E, Dierich A, Escola J‐M, Wendling C, Chenard M‐P, Vanier MT, Gruenberg J, Tomasetto C, Rio M‐C (2001) The steroidogenic acute regulatory protein homolog MLN64, a late endosomal cholesterol‐binding protein. J Biol Chem 276: 4261–4269 [DOI] [PubMed] [Google Scholar]
- 66. Johansson M, Bocher V, Lehto M, Chinetti G, Kuismanen E, Ehnholm C, Staels B, Olkkonen VM (2003) The two variants of oxysterol binding protein‐related protein‐1 display different tissue expression patterns, have different intracellular localization, and are functionally distinct. Mol Biol Cell 14: 903–915 [DOI] [PMC free article] [PubMed] [Google Scholar]
- 67. Lv BF, Yu CF, Chen YY, Lu Y, Guo JH, Song QS, Ma DL, Shi TP, Wang L (2006) Protein tyrosine phosphatase interacting protein 51 (PTPIP51) is a novel mitochondria protein with an N‐terminal mitochondrial targeting sequence and induces apoptosis. Apoptosis 11: 1489–1501 [DOI] [PubMed] [Google Scholar]
- 68. Spang N, Feldmann A, Huesmann H, Bekbulat F, Schmitt V, Hiebel C, Koziollek‐Drechsler I, Clement AM, Moosmann B, Jung J et al (2014) RAB3GAP1 and RAB3GAP2 modulate basal and rapamycin‐induced autophagy. Autophagy 10: 2297 [DOI] [PMC free article] [PubMed] [Google Scholar]
- 69. Xu D, Li Y, Wu L, Li Y, Zhao D, Yu J, Huang T, Ferguson C, Parton RG, Yang H et al (2018) Rab18 promotes lipid droplet (LD) growth by tethering the ER to LDs through SNARE and NRZ interactions. J Cell Biol 217: 975–995 [DOI] [PMC free article] [PubMed] [Google Scholar]
- 70. Hanada K, Kumagai K, Yasuda S, Miura Y, Kawano M, Fukasawa M, Nishijima M (2003) Molecular machinery for non‐vesicular trafficking of ceramide. Nature 426: 803–809 [DOI] [PubMed] [Google Scholar]
- 71. Sugiki T, Takeuchi K, Yamaji T, Takano T, Tokunaga Y, Kumagai K, Hanada K, Takahashi H, Shimada I (2012) Structural basis for the golgi association by the pleckstrin homology domain of the ceramide trafficking protein (CERT). J Biol Chem 287: 33706–33718 [DOI] [PMC free article] [PubMed] [Google Scholar]
- 72. Lehto M, Olkkonen VM (2003) The OSBP‐related proteins: a novel protein family involved in vesicle transport, cellular lipid metabolism, and cell signalling. Biochim Biophys Acta 1631: 1–11 [DOI] [PubMed] [Google Scholar]
- 73. Sonnhammer EL, von Heijne G, Krogh A (1998) A hidden Markov model for predicting transmembrane helices in protein sequences. Proc Int Conf Intell Syst Mol Biol 6: 175–182 [PubMed] [Google Scholar]
Associated Data
This section collects any data citations, data availability statements, or supplementary materials included in this article.
Supplementary Materials
Appendix
Expanded View Figures PDF
Source Data for Expanded View and Appendix
Review Process File
Source Data for Figure 1E
Source Data for Figure 5
Source Data for Figure 8B
Source Data for Figure 9A
Data Availability Statement
The mass spectrometry proteomics data have been deposited to the ProteomeXchange Consortium via the PRIDE 64 partner repository with the dataset identifier PXD009575.