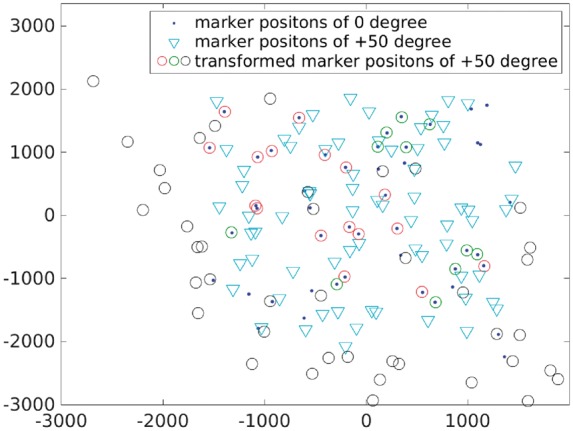
Fig. 3.

Result illustration of the VEEV dataset. Superimposition of fiducial marker positions from the micrographs with and tilt angles (labeled by ‘dot’ and ‘inverted triangle’, respectively), and the affine transformed marker positions from the micrograph with tilt angle (labeled by ‘circle’). Divide-and-conquer algorithm is used to reduce the effect of lens distortion: the fiducial markers labeled by red ‘circle’ and green ‘circle’ are the ones matched correctly with the fixed fiducial markers from ; and the fiducial markers labeled by black ‘circle’ are regarded as outliers
