Abstract
While gene expression data at the mRNA level can be globally and accurately measured, profiling the activity of cell signaling pathways is currently much more difficult. eXpression2Kinases (X2K) computationally predicts involvement of upstream cell signaling pathways, given a signature of differentially expressed genes. X2K first computes enrichment for transcription factors likely to regulate the expression of the differentially expressed genes. The next step of X2K connects these enriched transcription factors through known protein–protein interactions (PPIs) to construct a subnetwork. The final step performs kinase enrichment analysis on the members of the subnetwork. X2K Web is a new implementation of the original eXpression2Kinases algorithm with important enhancements. X2K Web includes many new transcription factor and kinase libraries, and PPI networks. For demonstration, thousands of gene expression signatures induced by kinase inhibitors, applied to six breast cancer cell lines, are provided for fetching directly into X2K Web. The results are displayed as interactive downloadable vector graphic network images and bar graphs. Benchmarking various settings via random permutations enabled the identification of an optimal set of parameters to be used as the default settings in X2K Web. X2K Web is freely available from http://X2K.cloud.
INTRODUCTION
While gene expression changes at the mRNA level are commonly measured, experimentally profiling the activity of cell signaling pathways at the proteome, phospho-proteome and epigenome regulatory layers is much more expensive and less accurate. Many computational approaches have been developed to infer cell signaling pathways from genome-wide gene expression data (1–5). Most methods assume that mRNA levels correlate with protein levels whereby knowledge about curated pathways is projected onto modules of differentially expressed genes. This is problematic because we know that there is weak correlation between mRNA and protein expression. In addition, databases that collate pathway knowledge suffer from literature focus biases. In these databases well-studied proteins are highly over-represented (6). To address some of these challenges we developed eXpression2Kinases (X2K).
X2K is a computational pipeline that takes as input lists of differentially expressed genes. It then performs enrichment analysis to prioritize transcription factors that most likely regulate the observed changes in mRNA expression, and then utilizes known protein–protein interactions (PPIs) to connect the identified transcription factors to form a subnetwork. At last, kinase enrichment analysis (KEA) is performed to prioritize protein kinases known to phosphorylate substrates within the subnetwork of transcription factors and the intermediate proteins that connect them. X2K was previously published as a desktop and command line tool (7). As part of the original X2K publication, a benchmark showed that the X2K pipeline can better identify drug targets when presenting the pipeline with signatures of drug-induced changes in gene expression from the original Connectivity Map database (8).
Since it was published, the X2K pipeline has been utilized by the biomedical research community to form novel hypotheses for many studies that employ transcriptomic and proteomic analyses. For example, X2K identified HIPK2 as a novel drug target for attenuating kidney fibrosis (9), and this finding was extended to identify a role for HIPK2 also in liver fibrosis (10) and keloid formation (11). In another study, Chitforoushzadeh et al. (12) developed a statistical model that predicted an AKT-associated signal downstream of insulin that repressed TNF-induced transcripts. Using X2K, the transcription factor GATA6 was predicted to be a mediator of these TNF-induced insulin-repressed transcripts. Then, it was experimentally validated that the AKT-associated signal was due to a GSK3-catalyzed phosphorylation of GATA6. Similarly, Zhu et al. (13) explored the regulatory pathways in the early stages of retinitis pigmentosa (RP) by applying the X2K analysis to interrogate an RP mouse model. They obtained a set of enriched upstream regulators, that included the transcription factor E2F1. Given the role of E2F1 in p53-mediated apoptosis, they hypothesized that E2F1 was one of the key regulators of photoreceptor-induced apoptosis in the early stages of RP. They verified this hypothesis by performing a western blot that demonstrated that E2F1 was upregulated in the early phase of RP in mouse photoreceptors cells. In another study, Meng et al. (14) used X2K to analyze mRNA gene expression results from two mouse models of human hepatocellular carcinoma (HCC). X2K was used to hypothesize about novel protein kinases that may be involved in hepatocellular carcinogenesis. Using X2K, they identified CAMK2γ as a predicted upstream kinase common to all three analyzed datasets. Their CAMK2γ−/− HCC mouse model demonstrated increased hepatocellular carcinogenesis, which they experimentally linked to CAMK2γ repression of mTORC1 activation. In another study, Kawahara et al. (15) investigated the role of ADAM17-dependent secretory pathways by analyzing the differentially expressed soluble proteins from an ADAM17(−/−) knockout mouse embryonic fibroblast (mEF) cells. With X2K analysis, the most significant enriched transcription factor was PPARγ, which they subsequently showed to have increased transcriptional activity in wild-type cells compared to the ADAM17 knockout. These and other related studies demonstrate that the X2K pipeline already produced hypotheses that were experimentally validated, with applications to improve our understanding of disease mechanisms for a variety of human diseases.
Here, we present X2K Web, an online updated version of the original X2K tool. X2K Web infers cell signaling pathways from transcription factors connected to protein kinases through PPIs. These pathways are predicted to take part in the upstream regulation of the inputted differentially expressed mRNA gene lists. The X2K Web pipeline chains three previously published independent tools: ChIP-x enrichment analysis (ChEA) (16), Genes2Networks (G2N) (17) and KEA (18). Using random permutations, the X2K Web pipeline was optimized to identify favorable parameter settings. The X2K Web application is also delivered with an application programming interface (API), and enlists ∼4600 pre-computed gene expression signatures from six breast cancer cell lines perturbed with ∼105 drugs, mostly kinase inhibitors, from a recent study. The signatures from this study are made ready-to-fetch into the X2K pipeline (19).
MATERIALS AND METHODS
The X2K pipeline parameters
The X2K pipeline is constructed from three components: (i) the transcription factor enrichment analysis (TFEA) component (16); (ii) the PPI network construction component (17); and (iii) the KEA component (18). Each step in the X2K pipeline has a number of modifiable parameters. The TFEA component has a collection of gene set libraries to choose from. In addition, the user can specify the number of transcription factors to pass to the next step. The PPI component provides the ability to select from multiple PPI databases. These PPI databases are combined into one unified PPI network. The user can also determine the minimum and maximum size for the output PPI subnetwork, and whether to include proteins with a certain limited connectivity degree, or in other words, whether to remove the ‘hubs’. In addition, the PPI step allows the removal of PPI edges from high content studies by limiting the number of PubMed IDs (PMID) that contribute more than a certain number of interactions. At last, the KEA step also provides a set of kinase gene set libraries to choose from. In some cases, background knowledge datasets may be used from human, mouse or both.
Server-side implementation
The X2K Web server application is written in Java and runs on Tomcat 8.0 requiring Java 8. Java servlets process the requests from the front end, for example, gene list submissions. Gradle manages the various dependencies. The front and back end components are assembled and compiled together into a JAR file. The service and its dependencies are packaged in a Docker container (20). The container runs on a HP ProLiant cluster managed using the native Docker support in Apache Mesos (21). To increase fault tolerance, scalability and uptime is managed via Mesosphere's Marathon (22). Marathon manages application health checks, balances load, and invokes restarts as well as switching across machines.
User interface implementation
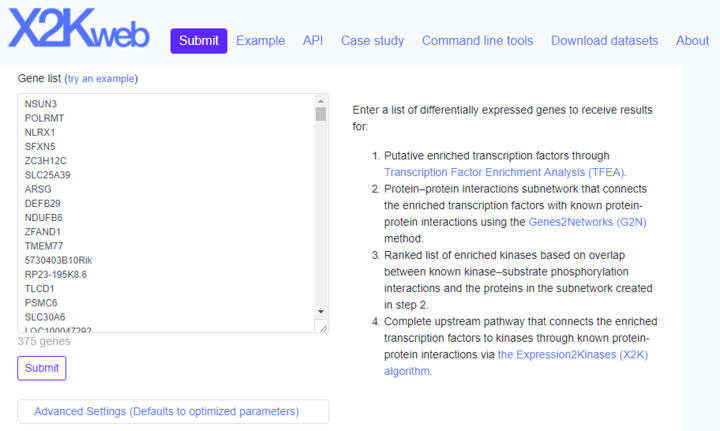
The user interface of X2K Web is implemented with Bootstrap (23) and jQuery (24). Bootstrap implements adaptive layout pages that dynamically adjust to the size of the device. Therefore, X2K Web is a responsive application that works well on both desktop and mobile devices. The landing page of X2K Web is a continuous page separated into seven sections. The top section is a form that provides users with a text box where they can paste a list of genes for analysis by X2K (Figure 1). An example list provides users with the correct format for submitting their own gene lists. The example also provides users with an opportunity to start an analysis even if they do not have their own data to upload.
Figure 1.
Screenshot from the X2K Web input form. Users can submit their own lists of mammalian differentially expressed genes, or click on the example to obtain the X2K Web results page (shown in Figure 2).
The ‘Advanced Settings’ button in the first screen provides access to the various parameters of the X2K pipeline. Users can review and change these parameters in a drop-down expandable menu under the input submission text area. X2K requires parameters such as the minimum number of proteins in inferred subnetworks. The TFEA parameters include specifying the transcription factor databases to use, and the background organism. For both the TFEA and KEA analyses, the Fisher exact test is used to compute enrichment. The PPI expansion settings provide the ability to filter interactions by limiting interactions by number of supporting papers, limiting the selection of background PPI databases, or limiting the maximum path length to connect transcription factors.
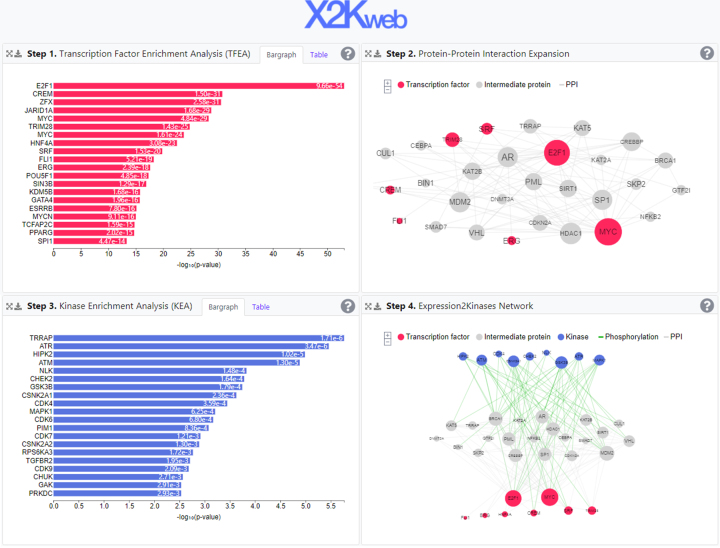
The ‘Example’ section provides users with the ability to directly see the results of the analysis for an example gene list (Figure 2). The example page is divided into four panels: at the top left panel, the TFEA results are displayed as a bar graph or a table. At the top right is a PPI subnetwork that directly connects the input list of the differentially expressed genes; while at the bottom left panel are the KEA results provided also as a bar graph or a table. Lastly, at the bottom right is the complete X2K network with the kinases at the top, the intermediate proteins in the middle, and the transcription factors at the bottom. The KEA results at the bottom left are applied to the list of proteins from the PPI subnetwork. Each panel is expandable to further explore and download the results. Users can download the network images as Support Vector Graphic (SVG) or Portable Network Graphics (PNG) or download the data they display as comma-separated values or JavaScript Object Notation (JSON) files that are compatible with Cytoscape (25).
Figure 2.
Screenshot from the X2K Web results page. The results page is divided into four panels: at the top left panel are the TFEA results displayed as a bar graph. At the top right is the PPI subnetwork that connects the input list of enriched transcription factors (red) through intermediate proteins (gray). At the bottom left panel are the KEA results provided as a bar graph. At last, at the bottom right is the complete X2K Web generated subnetwork with the kinases at the top, the intermediate proteins in the middle, and the transcription factors at the bottom.
Application programming interface
X2K Web provides API access to each component of X2K and the entire pipeline. The API section on the X2K Web interface contains names, value ranges and types of request parameters supported by X2K Web web-services. Example values are provided in a Jupyter Notebook (26), and these match the X2K Web interactive example. Source code for cURL, Python 3 and JavaScript is provided as examples for API usage. The API will be made compatible with Swagger (https://swagger.io/) and SmartAPI (27) specifications.
Large collection of ready-to-fetch signatures
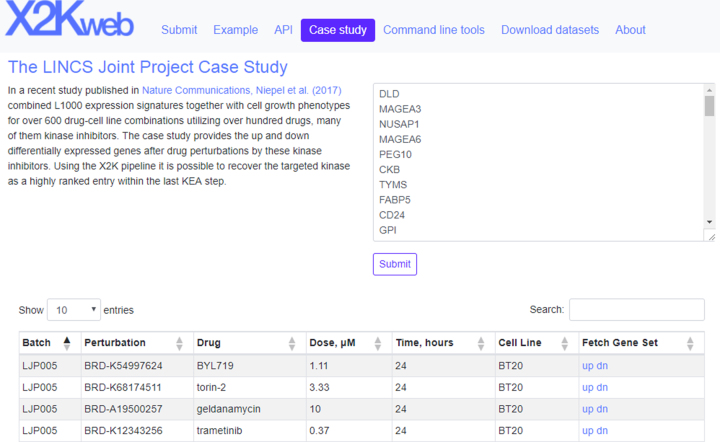
X2K Web provides a table with processed gene expression signatures from a recent study that profiled the response of six breast cancer cell lines to the treatment with 105 small molecules that include many kinase inhibitors and other pre-clinical cancer drugs (19). The interface in this section of X2K Web provides access to the up- and downregulated differentially expressed genes after drug perturbation by these small molecules applied in various concentrations, and where gene expression was measured at different time points (Figure 3). Using this feature, users can manually test X2K Web for its ability to recover the targeted kinases as highly ranked entries from the X2K pipeline results.
Figure 3.
Screenshot from the X2K Web interface that provides users with the ability to fetch L1000 signatures. Users can search for names of small molecules or cell lines.
Command line tools
X2K Web provides download links to standalone versions of X2K, TFEA, PPI expansion and KEA components. These tools are provided as packaged JAR files. The JAR files also contain source code and documentation. Each tool is provided with an example, including parameters and a demonstration about how to run the component in command line mode.
Parameter tuning with random permutations
To identify optimal parameter values that would maximally recover the correct perturbed kinases, we employed a random permutation approach. To achieve this, we encoded the parameters settings of X2K into randomly generated binary strings that map onto modifiable parameters in each step of the X2K Web interface pipeline. Once we created many randomly generated binary strings, we run the X2K pipeline by decoding each binary string into its corresponding parameter combination. Once the results are produced, the script assesses the fitness of the settings in terms of accuracy of predicting the perturbed kinase from the input set of differentially expressed genes from kinase perturbation followed by genome-wide expression experiments. The fitness is defined as the –log of the KEA score computed with the Fisher’s exact test. The process is repeated and the output is saved into a spreadsheet that contains the settings, the perturbed kinase, the fitness score, the size of the subnetwork and the number of enriched kinases the KEA step returned. Our initial run selected 1 out of 8 transcription factor libraries (Table 1), always 5 PPI databases selected from 17 options (Table 2) and 1 out of 8 kinase gene set libraries (Table 3). We also fixed the number of returned transcription factors that are passed on to the next PPI step to 10. To validate and optimize the X2K Web parameters through the random permutation approach, we used kinase perturbation followed by expression extracted from the CREEDS resource (28). The kinase perturbation followed by expression dataset is composed of whole-transcriptome data from 570 kinase knockout, knockdown or overexpression perturbation experiments extracted from cDNA microarray studies within the Gene Expression Omnibus (GEO).
Table 1. Processed resources for transcription-factor/target interactions.
| Database | Type | Interaction [M/H] | TFs [M/H] | Tragets [M/H] | PMID |
|---|---|---|---|---|---|
| ARCHS4 | Co-expression | 518466/472585 | 1734/1724 | 21857/21918 | 29636450 |
| ChEA_2016 | ChIP-seq | 535545/461570 | 194/178 | 34462/35204 | 20709693 |
| CREEDS | LOF-microarray | 6140050/3583008 | 265/174 | 23170/20592 | 27667448 |
| ENCODE_2015 | ChIP-seq | 259695/1218728 | 44/175 | 18170/22008 | 22955616 |
| Enrichr Queries | Co-occurrence | 516300 | 1721 | 12487 | 23586463 |
| huMAP | Mass-spec | 14017 | 419 | 2109 | 28596423 |
| iREF | Mixed | 7239/57042 | 402.0/1372 | 3454/11021 | 18823568 |
| JASPAR-TRANSFAC | PWM | 139520/424314 | 104/222 | 20895/22258 | 14681366 |
| TF-Genes2Fans | Predictions | 22525/22525 | 278 | 6001 | 22748121 |
| LOF-GEO | LOF-microarray | 86951/85829 | 82/43 | 23876/23585 | 27141961 |
LOF: Loss of function; PWM: Position weight matrices; M/H: Mouse/human.
Table 2. Processed resources for protein–protein interactions.
| Database | Type | Interactions | Proteins | PMID |
|---|---|---|---|---|
| BIND | Literature PPI | 25622 | 5528 | 12519993 |
| Biocarta | Literature PPI | 756 | 352 | N/A |
| BioGRID | Mixed | 68759 | 7312 | 27980099 |
| BioPLEX | Mass-spec | 56553 | 8610 | 26186194 |
| DIP | Literature PPI | 3822 | 1946 | 11752321 |
| figeys | Mass-spec | 6452 | 2033 | 17353931 |
| HPRD | Literature PPI | 47496 | 7490 | 18988627 |
| huMAP | Mass-spec | 62214 | 6061 | 28596423 |
| InnateDB | Literature PPI | 4576 | 1523 | 23180781 |
| IntAct | Mixed | 15726 | 4186 | 24234451 |
| iREF | Mixed | 28417 | 5403 | 18823568 |
| KEGG | Literature PPI | 13993 | 1198 | 19880382 |
| MINT | Literature PPI | 75065 | 9415 | 22096227 |
| MiPS | Mass-spec | 606 | 373 | 9399795 |
| PDZbase | Literature PPI | 244 | 159 | 15513994 |
| PPID | Literature PPI | 6998 | 1208 | 14755292 |
| Sets2Networks | Predicted | 3000 | 828 | 22824380 |
| SNAVI | Literature PPI | 2007 | 442 | 19154595 |
| Stelzl | Mass-spec | 6207 | 1702 | 16169070 |
| Vidal | Yeast-2-Hybrid | 6726 | 2541 | 16189514 |
Table 3. Processed resources for kinase–substrate interactions.
| Database | Type | Interactions | Kinases | Substrates | PMID |
|---|---|---|---|---|---|
| ARCHS4 | Co-expression | 9936 | 517 | 3824 | 29636450 |
| BIND | Literature PPI | 2533 | 227 | 1323 | 12519993 |
| Harmonizome | ML Predictions | 10000 | 79 | 3635 | 27374120 |
| HPRD | Literature PPI | 5043 | 262 | 2159 | 18988627 |
| huMAP | Mass-Spec PPI | 1385 | 156 | 955 | 28596423 |
| iPTMnet | Literature K–S | 947 | 131 | 724 | 29145615 |
| iREF | Literature PPI | 26734 | 329 | 8036 | 18823568 |
| KEGG | Literature PPI | 2238 | 131 | 621 | 19880382 |
| MINT | Literature PPI | 1583 | 225 | 1065 | 22096227 |
| NetworkIN | Predictions | 5829 | 190 | 2006 | 17981841 |
| Phospho.ELM | Literature K–S | 1441 | 231 | 891 | 21062810 |
| Phosphopoint | Literature K–S | 1970 | 281 | 1061 | 18689816 |
| PhosphositePlus | Literature K–S | 6434 | 168 | 2680 | 22135298 |
ML: Machine learning; K–S: Kinase–substrate.
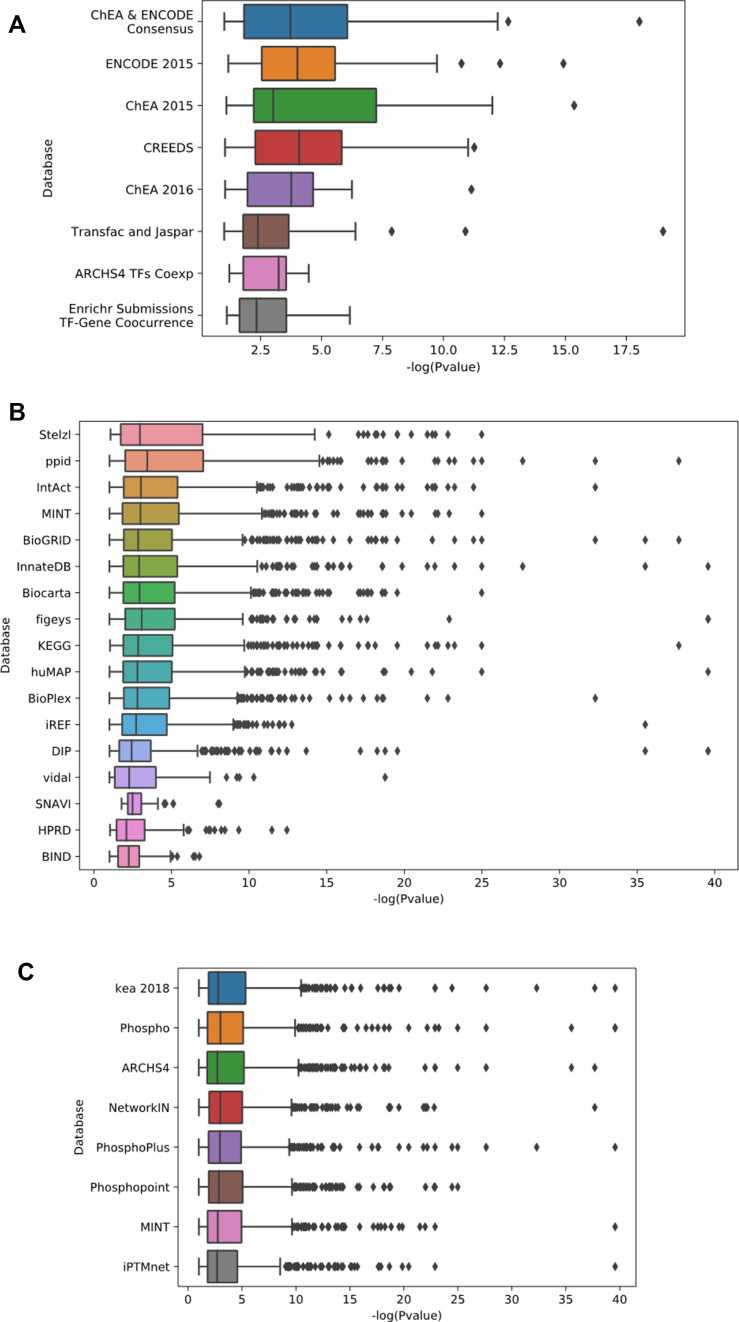
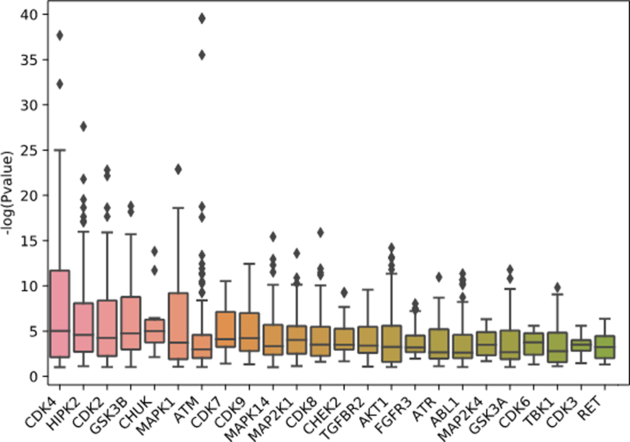
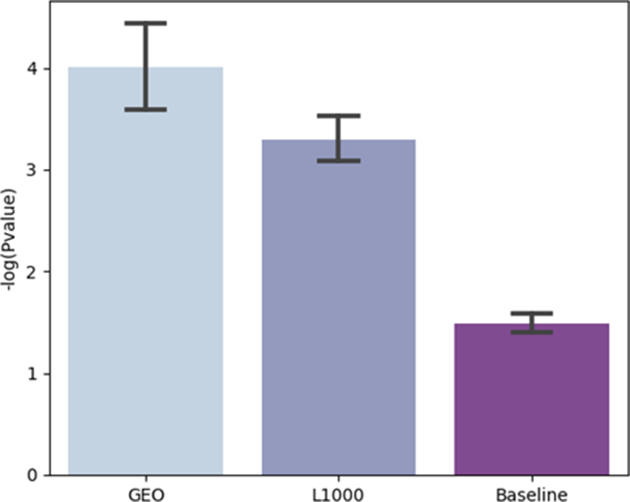
The results from the parameter optimization analysis show better performance for specific transcription-factor target libraries, PPI databases and kinase–substrate libraries (Figure 4). The KEA-2018 and the ENCODE-ChEA consensus libraries performed the best and this may suggest that combining resources can outperform enrichment analysis using a single resource. Some protein kinases are more likely to be recovered by the pipeline than others (Figure 5). This is likely due to their research focus biases that induces increase centrality and connectivity for these kinases. Lastly, we tested the performance of the learned parameters from the parameter tuning process by comparing it to random settings. In addition, we applied the learned settings to an independent dataset, kinase perturbation followed by expression from the LINCS L1000 dataset (Figure 6). We see that the learned settings significantly outperform random selection of parameters (GEO baseline versus GEO learned, GEO baseline versus L1000 learned, GEO learned versus L1000 learned; Tukey’s honest significant difference test and ANOVA; P-values < 0.05). The good performance on the independent L1000 dataset suggests that the learned parameters are generalizable. As more training datasets are collected and curated from diverse resources, the pipeline can be further tuned to improve the performance of X2K Web.
Figure 4.
Box plots to illustrate the contribution of each dataset option to the performance of the X2K pipeline in terms of fitness. The fitness is determined by the negative log of the P-value of the ‘correct’ kinase. (A) Transcription factor libraries; (B) Protein interaction networks; (C) Kinase–substrate libraries.
Figure 5.
Ranking of protein kinases based on their likelihood to be recovered by the pipeline.
Figure 6.
Comparison of the performance between using the learned parameters from the parameter tuning process applied to the signatures extracted from GEO (left), the learned parameters applied to an independent LINCS L1000 kinase perturbation followed by expression dataset (center), or random settings applied to the GEO signatures (right).
RESULTS AND DISCUSSION
X2K Web is a web-based application that implements the original eXpression2Kinases algorithm. The updated application contains many new transcription factors and kinase gene set libraries and PPI networks. These processed resources are provided for download so others can leverage this work for other applications. As a demonstration, thousands of gene expression signatures induced by small molecule kinase inhibitors applied to breast cancer cell lines are provided with the application. The X2K Web results are provided as interactive downloadable vector graphic network images, bar graphs and downloadable tables. Optimizing the X2K parameters by decoding the pipeline into a binary string and performing random permutations, we significantly improved the prediction of upstream regulatory cell signaling subnetworks given sets of differentially expressed genes. The settings learned from the random permutations are applied as the default settings in the web application. Such recommended settings can be divided into two kinds: those that rely on literature curation, and those created from high content data. This is because literature-based knowledge about PPI and kinase–substrate interactions suffer from human research focus biases (6). PPI databases such as hu.MAP (29) or BioPlex (30) do not produce high fitness when compared to databases such as KEGG (31) or BioGRID (32) because they contain fewer interactions for well-studied drug targets. However, selecting these databases can discover novel pathways and targets. The approach of random permutations for parameter optimization can be improved using more sophisticated methods. In the future, we plan to apply Genetic Algorithms (33) to further explore the space of parameter settings to improve the quality of X2K predictions.
In conclusion, X2K Web is a useful tool for experimental biologists to generate hypotheses from their gene expression profiling studies. Since the X2K pipeline has not been extensively experimentally validated, users should be warned that the results from the analysis may be misleading and inconclusive. Hence, we recommend that further evidence is gathered before testing X2K generated hypotheses at the bench. For example, such supporting evidence can be observing that the top ranked protein kinases identified by X2K are also differentially expressed at the mRNA and protein level. Additional supporting evidence can come from the research literature to suggest involvement of the top ranked protein kinases in the biological processes under investigation.
DATA AVAILABILITY
The X2K software and processed data are available from http://x2k.cloud
The source code is available from: https://github.com/MaayanLab/x2k_web
FUNDING
NIH [U54-HL127624, U24-CA224260, OT3-OD025467]. Funding for open access charge: NIH [U54-HL127624].
Conflict of interest statement. None declared.
REFERENCES
- 1. Huang D.W., Sherman B.T., Lempicki R.A.. Bioinformatics enrichment tools: paths toward the comprehensive functional analysis of large gene lists. Nucleic Acids Res. 2008; 37:1–13. [DOI] [PMC free article] [PubMed] [Google Scholar]
- 2. Casado P., Rodriguez-Prados J.-C., Cosulich S.C., Guichard S., Vanhaesebroeck B., Joel S., Cutillas P.R.. Kinase-substrate enrichment analysis provides insights into the heterogeneity of signaling pathway activation in leukemia cells. Sci. Signal. 2013; 6:rs6. [DOI] [PubMed] [Google Scholar]
- 3. Horn H., Schoof E.M., Kim J., Robin X., Miller M.L., Diella F., Palma A., Cesareni G., Jensen L.J., Linding R.. KinomeXplorer: an integrated platform for kinome biology studies. Nat. Methods. 2014; 11:603–604. [DOI] [PubMed] [Google Scholar]
- 4. Alvarez M.J., Giorgi F., Califano A.. Using viper, a package for virtual inference of protein-activity by enriched regulon analysis. Bioconductor. 2014; 1–14. [Google Scholar]
- 5. Krämer A., Green J., Pollard J. Jr, Tugendreich S.. Causal analysis approaches in ingenuity pathway analysis. Bioinformatics. 2013; 30:523–530. [DOI] [PMC free article] [PubMed] [Google Scholar]
- 6. Wang Z., Clark N.R., Ma’ayan A.. Dynamics of the discovery process of protein-protein interactions from low content studies. BMC Syst. Biol. 2015; 9:26. [DOI] [PMC free article] [PubMed] [Google Scholar]
- 7. Chen E.Y., Xu H., Gordonov S., Lim M.P., Perkins M.H., Ma’ayan A.. Expression2Kinases: mRNA profiling linked to multiple upstream regulatory layers. Bioinformatics. 2012; 28:105–111. [DOI] [PMC free article] [PubMed] [Google Scholar]
- 8. Lamb J., Crawford E.D., Peck D., Modell J.W., Blat I.C., Wrobel M.J., Lerner J., Brunet J.-P., Subramanian A., Ross K.N.. The Connectivity Map: using gene-expression signatures to connect small molecules, genes, and disease. Science. 2006; 313:1929–1935. [DOI] [PubMed] [Google Scholar]
- 9. Jin Y., Ratnam K., Chuang P.Y., Fan Y., Zhong Y., Dai Y., Mazloom A.R., Chen E.Y., D’Agati V., Xiong H. et al. A systems approach identifies HIPK2 as a key regulator of kidney fibrosis. Nat. Med. 2012; 18:580–588. [DOI] [PMC free article] [PubMed] [Google Scholar]
- 10. He P., Yu Z.-J., Sun C.-Y., Jiao S.-J., Jiang H.-Q.. Knockdown of HIPK2 attenuates the pro-fibrogenic response of hepatic stellate cells induced by TGF-β1. Biomed. Pharmacother. 2017; 85:575–581. [DOI] [PubMed] [Google Scholar]
- 11. Zhao Y.-X., Zhang G.-Y., Wang A.-Y., Chen Y.-H., Lin D.-M., Li Q.-F.. Role of Homeodomain-Interacting protein kinase 2 in the pathogenesis of tissue fibrosis in Keloid-Derived keratinocytes. Ann. Plast. Surg. 2017; 79:546–551. [DOI] [PubMed] [Google Scholar]
- 12. Chitforoushzadeh Z., Ye Z., Sheng Z., LaRue S., Fry R.C., Lauffenburger D.A., Janes K.A.. TNF-insulin crosstalk at the transcription factor GATA6 is revealed by a model that links signaling and transcriptomic data tensors. Sci. Signal. 2016; 9:ra59. [DOI] [PMC free article] [PubMed] [Google Scholar]
- 13. Zhu Z.-H., Fu Y., Weng C.-H., Zhao C.-J., Yin Z.-Q.. Proteomic profiling of early degenerative retina of RCS rats. Int. J. Ophthalmol. 2017; 10:878–889. [DOI] [PMC free article] [PubMed] [Google Scholar]
- 14. Meng Z., Ma X., Du J., Wang X., He M., Gu Y., Zhang J., Han W., Fang Z., Gan X.. CAMK2γ antagonizes mTORC1 activation during hepatocarcinogenesis. Oncogene. 2016; 36:2446–2456. [DOI] [PMC free article] [PubMed] [Google Scholar]
- 15. Kawahara R., Lima R.N., Domingues R.R., Pauletti B.A., Meirelles G.V., Assis M., Figueira A.C.M., Leme A.F.P.. Deciphering the role of the ADAM17-Dependent secretome in cell signaling. J. Proteome Res. 2014; 13:2080–2093. [DOI] [PubMed] [Google Scholar]
- 16. Lachmann A., Xu H., Krishnan J., Berger S.I., Mazloom A.R., Ma’ayan A.. ChEA: transcription factor regulation inferred from integrating genome-wide ChIP-X experiments. Bioinformatics. 2010; 26:2438–2444. [DOI] [PMC free article] [PubMed] [Google Scholar]
- 17. Berger S.I., Posner J.M., Ma’ayan A.. Genes2Networks: connecting lists of gene symbols using mammalian protein interactions databases. BMC Bioinformatics. 2007; 8:372. [DOI] [PMC free article] [PubMed] [Google Scholar]
- 18. Lachmann A., Ma’ayan A.. KEA: kinase enrichment analysis. Bioinformatics. 2009; 25:684–686. [DOI] [PMC free article] [PubMed] [Google Scholar]
- 19. Niepel M., Hafner M., Duan Q., Wang Z., Paull E.O., Chung M., Lu X., Stuart J.M., Golub T.R., Subramanian A.. Common and cell-type specific responses to anti-cancer drugs revealed by high throughput transcript profiling. Nat. Commun. 2017; 8:1186. [DOI] [PMC free article] [PubMed] [Google Scholar]
- 20. Merkel D. Docker: lightweight linux containers for consistent development and deployment. Linux J. 2014; 2014:2. [Google Scholar]
- 21. Hindman B., Konwinski A., Zaharia M., Ghodsi A., Joseph A.D., Katz R.H., Shenker S., Stoica I.. Mesos: A Platform for Fine-Grained Resource Sharing in the Data Center. NSDI. 2011; 11:22. [Google Scholar]
- 22. Saha P., Govindaraju M., Marru S., Pierce M.. Integrating apache airavata with docker, marathon, and mesos. Concurrency: Practiceand and Experience. 2016; 28:1952–1959. [Google Scholar]
- 23. Spurlock J. Bootstrap: Responsive Web Development. 2013; Sebastopol: O’Reilly Media, Inc. [Google Scholar]
- 24. De Volder K. Van Hentenryck P. A Generic Code Browser with a Declarative Configuration Language. International Symposium on Practical Aspects of Declarative Languages. 2005; 3819:Berlin, Heidelberg: Springer; 88–102. [Google Scholar]
- 25. Shannon P., Markiel A., Ozier O., Baliga N.S., Wang J.T., Ramage D., Amin N., Schwikowski B., Ideker T.. Cytoscape: a software environment for integrated models of biomolecular interaction networks. Genome Res. 2003; 13:2498–2504. [DOI] [PMC free article] [PubMed] [Google Scholar]
- 26. Perez F., Granger B.E.. Project Jupyter: computational narratives as the engine of collaborative data science. Retrieved September. 2015; 11:207. [Google Scholar]
- 27. Dastgheib S., Whetzel T., Zaveri A., Afrasiabe C., Assis P., Availlach P., Jagodnik K., Korodi G., Pilarczyk M., De Pons J.. ISWC2017, the 16e International Semantic Web Conference. 2017; 1931:1–4. [Google Scholar]
- 28. Wang Z., Monteiro C.D., Jagodnik K.M., Fernandez N.F., Gundersen G.W., Rouillard A.D., Jenkins S.L., Feldmann A.S., Hu K.S., McDermott M.G.. Extraction and analysis of signatures from the Gene Expression Omnibus by the crowd. Nat. Commun. 2016; 7:12846. [DOI] [PMC free article] [PubMed] [Google Scholar]
- 29. Drew K., Lee C., Huizar R.L., Tu F., Borgeson B., McWhite C.D., Ma Y., Wallingford J.B., Marcotte E.M.. Integration of over 9,000 mass spectrometry experiments builds a global map of human protein complexes. Mol. Syst. Biol. 2017; 13:932. [DOI] [PMC free article] [PubMed] [Google Scholar]
- 30. Huttlin E.L., Ting L., Bruckner R.J., Gebreab F., Gygi M.P., Szpyt J., Tam S., Zarraga G., Colby G., Baltier K.. The BioPlex network: a systematic exploration of the human interactome. Cell. 2015; 162:425–440. [DOI] [PMC free article] [PubMed] [Google Scholar]
- 31. Kanehisa M., Goto S.. KEGG: kyoto encyclopedia of genes and genomes. Nucleic Acids Res. 2000; 28:27–30. [DOI] [PMC free article] [PubMed] [Google Scholar]
- 32. Stark C., Breitkreutz B.-J., Reguly T., Boucher L., Breitkreutz A., Tyers M.. BioGRID: a general repository for interaction datasets. Nucleic Acids Res. 2006; 34:D535–D539. [DOI] [PMC free article] [PubMed] [Google Scholar]
- 33. Goldberg D.E., Holland J.H.. Genetic algorithms and machine learning. Machi. Learn. 1988; 3:95–99. [Google Scholar]
Associated Data
This section collects any data citations, data availability statements, or supplementary materials included in this article.
Data Availability Statement
The X2K software and processed data are available from http://x2k.cloud
The source code is available from: https://github.com/MaayanLab/x2k_web


