Abstract
CSAR-web is a web-based tool that allows the users to efficiently and accurately scaffold (i.e. order and orient) the contigs of a target draft genome based on a complete or incomplete reference genome from a related organism. It takes as input a target genome in multi-FASTA format and a reference genome in FASTA or multi-FASTA format, depending on whether the reference genome is complete or incomplete, respectively. In addition, it requires the users to choose either ‘NUCmer on nucleotides’ or ‘PROmer on translated amino acids’ for CSAR-web to identify conserved genomic markers (i.e. matched sequence regions) between the target and reference genomes, which are used by the rearrangement-based scaffolding algorithm in CSAR-web to order and orient the contigs of the target genome based on the reference genome. In the output page, CSAR-web displays its scaffolding result in a graphical mode (i.e. scalable dotplot) allowing the users to visually validate the correctness of scaffolded contigs and in a tabular mode allowing the users to view the details of scaffolds. CSAR-web is available online at http://genome.cs.nthu.edu.tw/CSAR-web.
INTRODUCTION
Due to continued advances in DNA sequencing technologies, more and more genomes can be sequenced rapidly at a moderate cost (1). However, assembly of a huge number of reads generated from current DNA sequencing platforms still remains a challenging task (2). Due to sequencing errors and repeat sequences, most assemblies are generally draft genomes, consisting of hundreds or thousands of fragmented sequences called contigs. The availability of complete genomes is important to the analysis and interpretation of sequence data in many biological applications (3). In principle, the more contigs a draft genome has, the more difficult its downstream analysis becomes. To obtain a more complete sequence of a draft genome, its contigs usually are ordered and oriented into larger gap-containing sequences, called scaffolds, so that the gaps between scaffolded contigs can be filled in the subsequent gap-closing process.
In the scaffolding process, an available genomic sequence from a related organism can be used as a reference (or template) to order and orient the contigs in a draft genome. Currently, many such reference-based scaffolding tools are available (4–12). In principle, the methods behind all these scaffolders fall into two main categories: alignment-based algorithms (4–9) and rearrangement-based algorithms (10–12). The alignment-based scaffolding algorithms first align contigs (or contig ends) of a draft genome against a reference sequence and then try to scaffold the contigs according to the positions of their matches in the reference. By considering genomic structures, the rearrangement-based scaffolding algorithms utilize a reference genome to scaffold the contigs of a draft genome in a way such that the orders of conserved genes (or genomic markers) between the scaffolded draft genome and the reference genome are as similar as possible.
In fact, only a few of all the reference-based scaffolders mentioned above allow the used reference genomes to be incomplete (or unfinished), such as Projector 2 (4), OSLay (5), Mauve Aligner (7) and r2cat (8). As mentioned before, most sequenced genomes are just draft (13) and hence complete reference genomes may not be always available for a draft genome to be scaffolded. Recently, we have used an efficient rearrangement-based scaffolding algorithm (14) to develop a new reference-based scaffolder called CSAR (short for ‘Contig Scaffolding tool using Algebraic Rearrangements’) (15) that particularly can utilize an incomplete reference genome to efficiently and more accurately scaffold the contigs of a given target draft genome. We have also used several real datasets to show that CSAR indeed outperforms other similar tools Projector2, OSLay and Mauve Aligner in terms of many evaluation metrics, such as sensitivity, precision, F-score, genome coverage, NGA50 and running time. Note that CSAR still outperforms r2cat in terms of sensitivity, precision, F-score, genome coverage and NGA50 (refer to the Supplementary Material for details). However, CSAR is a stand-alone application that requires the users to install extra software, such as PHP and MUMmer, in advance on their local computers. Actually, this may be inconvenient for those users that are not fully familiar or comfortable with Unix/Linux systems and running programs from the command line. Therefore, we introduce the web server version of CSAR, called CSAR-web, in this study. CSAR-web provides the users with an easy-to-operate interface to run CSAR and outputs its scaffolding result in a graphical mode (i.e. scalable dotplot) allowing the users to visually validate the correctness of scaffolded contigs and in a tabular mode allowing the users to view the details of scaffolds.
MATERIALS AND METHODS
Overview of scaffolding algorithm
The scaffolding program in CSAR-web was implemented based on a rearrangement-based algorithm we previously developed to efficiently solve the scaffolding problem (14). By considering contigs as linear chromosomes and the scaffolding of two contigs as a fusion to join these two contigs into a larger one, we formulated the scaffolding problem as a genome rearrangement problem as follows. Given two sets of contigs, one serving as a target genome to be scaffolded π and the other as a reference genome σ, the scaffolding problem is to join the contigs in both π and σ such that the algebraic rearrangement distance between the resulting π and σ is minimized. The so-called algebraic rearrangement distance, introduced by Feijão and Meidanis (16) based on the adjacency algebraic model, is the minimum weight of rearrangement operations (e.g. reversals, transpositions, block-interchanges, translocations, fusions and fissions) required to transform one genome into another.
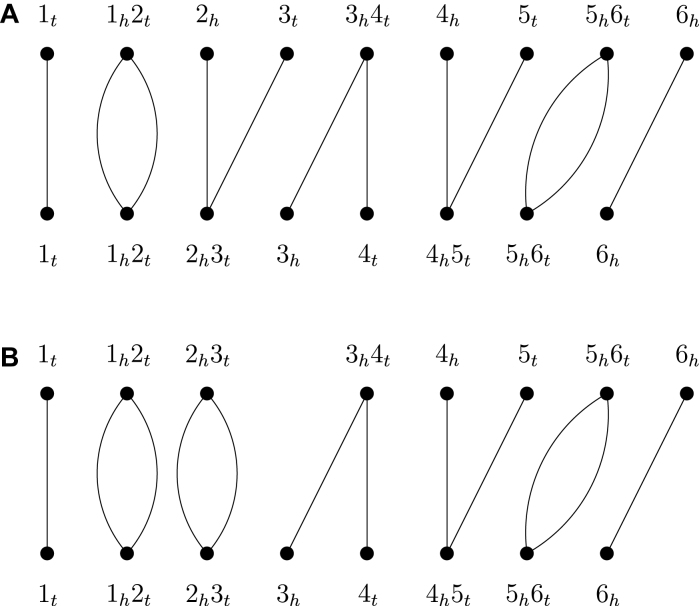
A genomic marker (or gene) is an oriented sequence of DNA that starts with a tail and ends with a head. Since a genomic marker can be present in two orientations (i.e. forward and reverse), it is usually represented by a signed integer, with the sign indicating its orientation, in the studies of genome rearrangements (17). In this way, a chromosome can be represented by a sequence of ordered genomic markers and a genome by a set of chromosomes. For our purpose, we represent a linear chromosome (e.g. contig and scaffold) as a sequence of ordered genomic markers enclosed in brackets. Given a genomic marker x, its tail and head are also called extremities and denoted by xt and xh, respectively. An adjacency is a pair of extremities denoting a connection between two adjacent genomic markers on a contig. A telomere is an extremity not adjacent to any other extremity on a contig. Given two sets of contigs π and σ, their adjacency graph AG(π, σ) is a graph in which the vertices are the adjacencies and telomeres of π and σ and for each vertex u in π and each vertex v in σ, there is an edge between u and v if u and v have an extremity in common. Figure 1A presents an example of the adjacency graph between two given sets of contigs π = {[1, 2], [3, 4], [5, 6]} and σ = {[1, 2, 3], [4, 5, 6]}. Clearly, as shown in Figure 1A, the degree of each vertex is less than or equal to two and hence an adjacency graph is composed exclusively of paths and cycles.
Figure 1.
(A) Adjacency graph between two sets of contigs π = {[1, 2], [3, 4], [5, 6]} and σ = {[1, 2, 3], [4, 5, 6]}, where the top vertices of the graph correspond to the adjacencies and telomeres in π and the bottom vertices correspond to the adjacencies and telomeres in σ. (B) The resulting adjacency graph after two contigs [1, 2] and [3, 4] in π are joined into a scaffold [1, 2, 3, 4].
In this study, we assume that the target and reference genomes π and σ have equal content of genomic markers, that is, all the genomic markers are present in each genome exactly once. As mentioned above, we treat the scaffolding of two contigs in either π or σ as a fusion of these two contigs, which correspondingly leads to two telomere vertices in the adjacency graph AG(π, σ) being joined into an adjacency vertex. Since a telomere vertex must be an end of a path in AG(π, σ), the fusion of two contigs will cause either two paths in AG(π, σ) being joined together into a longer one or a path in AG(π, σ) being circularized into a cycle. In our previous study (14), we have shown that the contig scaffolding problem under the algebraic rearrangement distance is equivalent to that of joining the contigs in both π and σ such that the number of cycles in the adjacency graph between the resulting π and σ is maximized. For example, consider the adjacency graph AG(π, σ) as shown Figure 1A. Let px, y denote a path with two ends x and y in AG(π, σ). To maximize the number of cycles in AG(π, σ), we can use two fusions to close paths  and
and  into two cycles, correspondingly joining the three contigs [1, 2], [3, 4] and [5,6] in π into a scaffold [1,2,3,4,5,6] (see Figure 1B for an example of closing
  and the resulting adjacency graph), and use a fusion to close path
  into a cycle, correspondingly joining the two contigs [1,2,3] and [4,5,6] in σ into a scaffold [1,2,3,4,5,6]. Finally, in the CSAR algorithm we have utilized the techniques of permutation groups in algebra to design a near-linear time algorithm for solving the contig scaffolding problem. For more details about this algorithm, we refer the readers to our paper (14).
Implementation and installation
Identifying conserved genomic markers (i.e. matched sequence regions) between a target genome π and a reference genome σ plays an important role in our scaffolding algorithm as described above. In CSAR-web, we utilized the genome sequence aligners NUCmer and PROmer from MUMmer’s package (18) to perform the identification of conserved genomic markers between π and σ, where NUCmer was performed on nucleotide sequences of π and σ, while PROmer was performed on amino acid sequences of π and σ translated from their nucleotide sequences in all six reading frames. The source code of CSAR-web, including its kernel program and web interface, was written in PHP and its web implementation was installed on a server with 3.4 GHz processor and 32 GB RAM under Linux system.
WEB INTERFACE AND USAGE
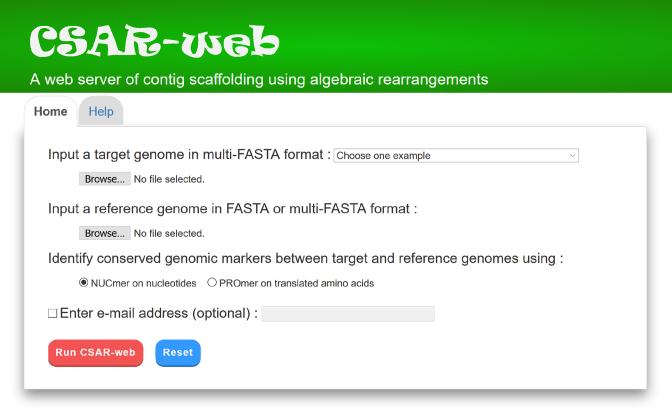
It can be accessed by an easy-to-operate web interface as illustrated in Figure 2. CSAR-web takes as input a target genome in multi-FASTA format and a reference genome in FASTA format (if the reference genome is complete) or in multi-FASTA format (if the reference genome is incomplete). CSAR-web will identify conserved genomic markers between the input target and reference genomes either using NUCmer (default setting) or PROmer, which can be specified by the users. If required, the users can run CSAR-web in a batch way, which is optional, by checking the email checkbox and also entering an email address. The users will then be notified of the scaffolding result via email when the submitted job is finished. According to our experiments (15), CSAR-web can finish its scaffolding job in less than a minute for the size of a prokaryotic genome, but it may require several minutes up to several hours for the size of a mammalian chromosome (e.g. human chromosome 14). It is recommended for the users to use the stand-alone version CSAR to scaffold a mammalian chromosome or genome.
Figure 2.
Web interface of CSAR-web.
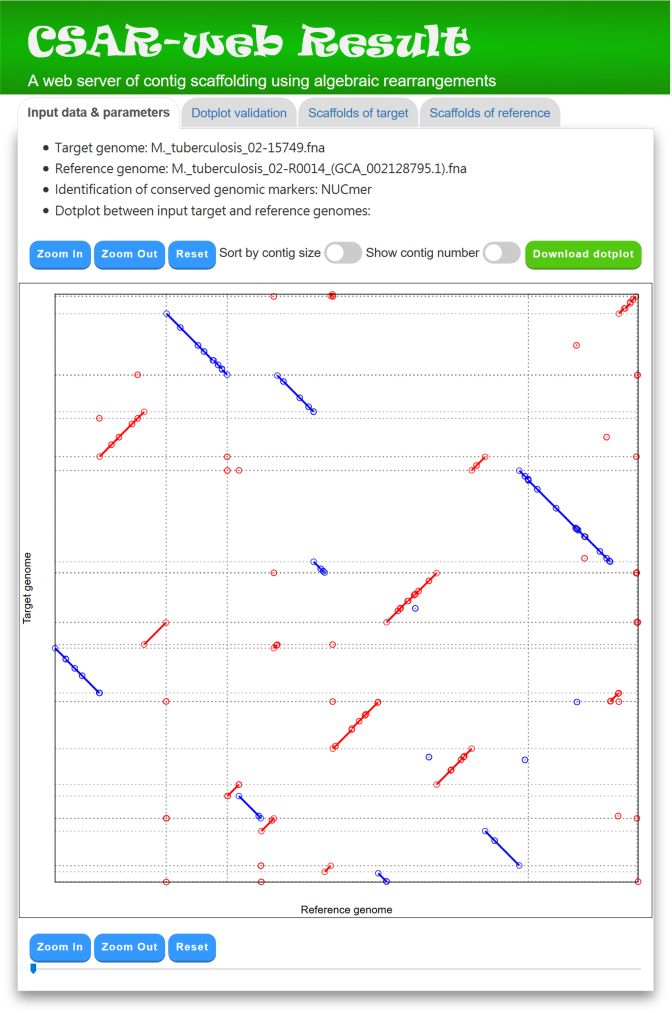
CSAR-web outputs its scaffolding results in the following tab pages: (i) input data and parameters, (ii) dotplot validation, (iii) scaffolds of target and (iv) scaffolds of reference. In the ‘Input data & parameters’ page (see Figure 3 for an example), CSAR-web shows the information of input target and reference genomes, the user-specified method (either NUCmer or PROmer) for identifying their conserved genomic markers, and a dotplot for the visual inspection of identified genomic markers before scaffolding. In the dotplot display, the target and reference genomes are plotted on the y and x axes, respectively, and their contigs or scaffolds are separated by horizontal or vertical dashed lines. In addition, forward and reverse genomic markers are displayed in red and blue lines, respectively, and the beginning and end of each line are represented by two unfilled points. Note that the users have an option to sort the input contigs of the target genome according to their sizes by using a toggle switch. The users can also zoom in or out on a particular region of the dotplot by clicking the ‘Zoom in’ or ‘Zoom out’ button, respectively (or simply by scrolling the mouse wheel over the dotplot). Furthermore, the users can show or hide the numbers of contigs, which are generated randomly in a format that begins with three-letter prefix (CTG) followed by an underscore (_) and at least three digits (e.g. CTG_001), by using a toggle switch.
Figure 3.
A display of ‘Input data & parameters’ tab page. Many genomic markers in this instance are displayed as single unfilled dots because their lengths are relatively short as compared to that of target or reference genome.
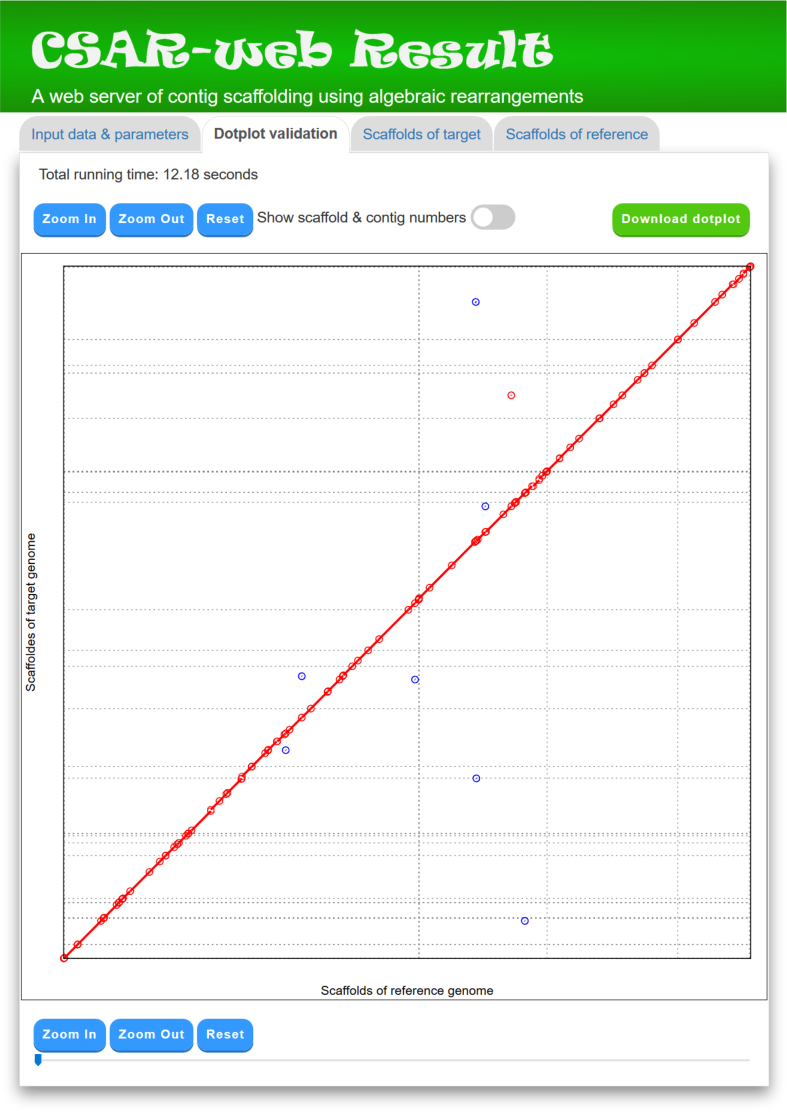
In the ‘Dotplot validation’ page, CSAR-web displays its total running time, as well as its scaffolding result by a dotplot between the scaffolds of target and reference genomes (refer to Figure 4). The scaffolds of the target genome generated by CSAR-web are numbered randomly and the format of their scaffolding numbers begins with three-letter prefix (SCF) followed by an underscore (_) and at least three digits (e.g. SCF_001). In principle, if the contigs of the target genome are perfectly scaffolded according to the reference genome, then the matched sequence regions in the dotplot would go from the bottom left to the top right (as shown in Figure 4) or go from the top left to the bottom right. The dotplot display of the scaffolding result is convenient for the users to visually validate whether the contigs of the target genome are properly scaffolded according to the reference genome. The dotplot is zoomable and the numbers of its contigs and scaffolds can be shown or hidden by using a toggle switch. In addition, the users can download a copy of the dotplot in scalar vector graphics (SVG) format, which can be opened in many Web browsers (e.g. Firefox, Chrome, Safari, Internet Explorer and Edge) and used to create a publication-quality figure, by clicking the ‘Download dotplot’ button.
Figure 4.
A display of ‘Dotplot validation’ tab page. Many single unfilled dots in Figure 3 present at the ends of contigs (i.e. at the contig boundaries) and they disappear in this figure because their contigs are scaffolded well according to the reference genome. The remaining single unfilled dots in this figure actually occur within the contigs, which may be due to the existence of small rearrangements between target and reference genomes or simply errors made in the process of contig assembly.
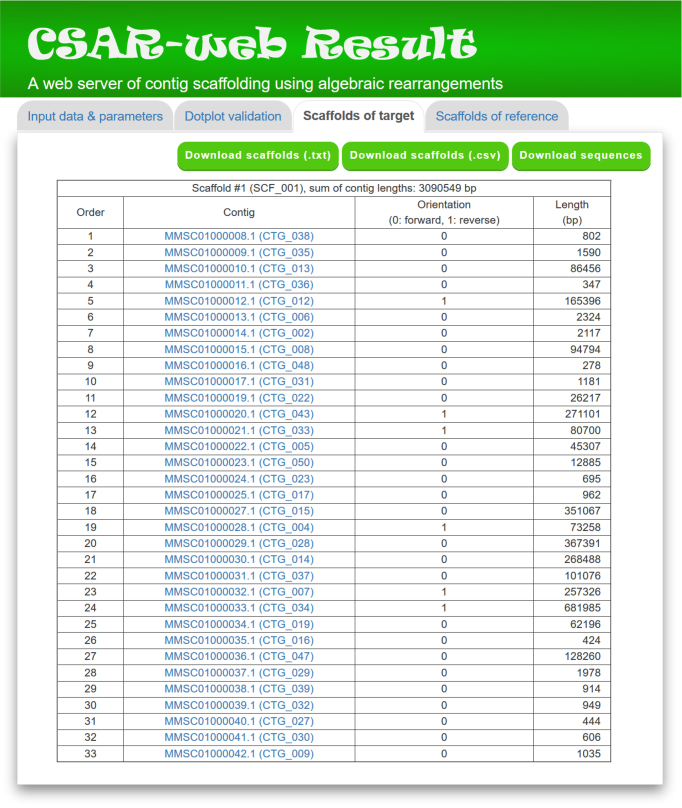
In the ‘Scaffolds of target’ page, CSAR-web presents its scaffolding result of target genome in tabular format (see Figure 5 for an example) for the purpose of allowing the users to view the generated scaffolds in detail. The scaffolds in the table are sorted according to their sizes, which equals to the sum of contig sizes. The contigs of each generated scaffold, along with their orientation (0 standing for forward and 1 for reverse), sequence and length, are listed in a table according to their order in the scaffold. For downstream analyses, the users can download the scaffolds of target genome either in a tab-delimited text format or a comma-delimited CSV format by clicking the ‘Download scaffolds (.txt)’ or ‘Download scaffolds (.csv)’ button, respectively. In addition, the users can download the scaffold sequences in the text format by clicking the ‘Download sequences’ button, where contig sequences in the same scaffold are separated by 100 Ns.
Figure 5.
A partial display of ‘Scaffolds of target’ tab page.
In the ‘Scaffolds of reference’ page, CSAR-web displays the scaffold table for the reference genome. Note that when the input reference genome is a draft genome, its contigs are scaffolded by CSAR-web using the input target genome as reference.
SUMMARY
In this study, we presented a web server of reference-based scaffolder CSAR-web (web server version of CSAR) that allows the users to conveniently scaffold the contigs of a target draft genome based on a reference genome through a user-friendly web interface. In particular, the reference genome submitted to CSAR-web does not need to be complete in its sequence. This property is very useful for the users to scaffold their draft genomes because most available genomes that can be used as references are incomplete. In fact, in our previous study (15), we have utilized several real datasets, including five bacterial genomes and one human chromosome, to demonstrate that CSAR has better performance than other similar tools, such as Projector2, OSLay and Mauve Aligner, in terms of many evaluation metrics, such as sensitivity, precision, F-score, genome coverage, NGA50 and running time. Therefore, CSAR-web can serve as a convenient and useful scaffolding tool allowing the users to efficiently and accurately scaffold their draft genomes according to a complete or incomplete reference genome. In our future work, we will investigate how to modify our scaffolding algorithm to output multiple optimal scaffolding results, and how to utilize multiple reference genomes to further improve the scaffolding quality of CSAR-web.
Supplementary Material
SUPPLEMENTARY DATA
Supplementary Data are available at NAR Online.
FUNDING
Ministry of Science and Technology of Taiwan (in part) [MOST106-2221-E-007-117]. Funding for open access charge: Ministry of Science and Technology of Taiwan [MOST106-2221-E-007-117].
Conflict of interest statement. None declared.
REFERENCES
- 1. Goodwin S., McPherson J.D., McCombie W.R.. Coming of age: ten years of next-generation sequencing technologies. Nat. Rev. Genet. 2016; 17:333–351. [DOI] [PMC free article] [PubMed] [Google Scholar]
- 2. Pop M. Genome assembly reborn: recent computational challenges. Brief. Bioinformatics. 2009; 10:354–366. [DOI] [PMC free article] [PubMed] [Google Scholar]
- 3. Mardis E., McPherson J., Martienssen R., Wilson R.K., McCombie W.R.. What is finished, and why does it matter. Genome Res. 2002; 12:669–671. [DOI] [PubMed] [Google Scholar]
- 4. van Hijum S.A., Zomer A.L., Kuipers O.P., Kok J.. Projector 2: contig mapping for efficient gap-closure of prokaryotic genome sequence assemblies. Nucleic Acids Res. 2005; 33:W560–W566. [DOI] [PMC free article] [PubMed] [Google Scholar]
- 5. Richter D.C., Schuster S.C., Huson D.H.. OSLay: optimal syntenic layout of unfinished assemblies. Bioinformatics. 2007; 23:1573–1579. [DOI] [PubMed] [Google Scholar]
- 6. Assefa S., Keane T.M., Otto T.D., Newbold C., Berriman M.. ABACAS: algorithm-based automatic contiguation of assembled sequences. Bioinformatics. 2009; 25:1968–1969. [DOI] [PMC free article] [PubMed] [Google Scholar]
- 7. Rissman A.I., Mau B., Biehl B.S., Darling A.E., Glasner J.D., Perna N.T.. Reordering contigs of draft genomes using the Mauve Aligner. Bioinformatics. 2009; 25:2071–2073. [DOI] [PMC free article] [PubMed] [Google Scholar]
- 8. Husemann P., Stoye J.. r2cat: synteny plots and comparative assembly. Bioinformatics. 2010; 26:570–571. [DOI] [PMC free article] [PubMed] [Google Scholar]
- 9. Galardini M., Biondi E.G., Bazzicalupo M., Mengoni A.. CONTIGuator: a bacterial genomes finishing tool for structural insights on draft genomes. Source Code Biol. Med. 2011; 6:11. [DOI] [PMC free article] [PubMed] [Google Scholar]
- 10. Munoz A., Zheng C., Zhu Q., Albert V.A., Rounsley S., Sankoff D.. Scaffold filling, contig fusion and comparative gene order inference. BMC Bioinformatics. 2010; 11:304. [DOI] [PMC free article] [PubMed] [Google Scholar]
- 11. Dias Z., Dias U., Setubal J.C.. SIS: a program to generate draft genome sequence scaffolds for prokaryotes. BMC Bioinformatics. 2012; 13:96. [DOI] [PMC free article] [PubMed] [Google Scholar]
- 12. Lu C.L., Chen K.-T., Huang S.-Y., Chiu H.-T.. CAR: contig assembly of prokaryotic draft genomes using rearrangements. BMC Bioinformatics. 2014; 15:381. [DOI] [PMC free article] [PubMed] [Google Scholar]
- 13. Mukherjee S., Stamatis D., Bertsch J., Ovchinnikova G., Verezemska O., Isbandi M., Thomas A.D., Ali R., Sharma K., Kyrpides N.C. et al. Genomes OnLine Database (GOLD) v.6: data updates and feature enhancements. Nucleic Acids Res. 2017; 45:D446–D456. [DOI] [PMC free article] [PubMed] [Google Scholar]
- 14. Lu C.L. An efficient algorithm for the contig ordering problem under algebraic rearrangement distance. J. Comput. Biol. 2015; 22:975–987. [DOI] [PubMed] [Google Scholar]
- 15. Chen K.-T., Liu C.-L., Huang S.-H., Shen H.-T., Shieh Y.-K., Chiu H.-T., Lu C.L.. CSAR: a contig scaffolding tool using algebraic rearrangements. Bioinformatics. 2018; 34:109–111. [DOI] [PubMed] [Google Scholar]
- 16. Feijao P., Meidanis J.. Extending the algebraic formalism for genome rearrangements to include linear chromosomes. IEEE/ACM Trans. Comput. Biol. Bioinformatics. 2013; 10:819–831. [DOI] [PubMed] [Google Scholar]
- 17. Huang Y.-L., Lu C.L.. Sorting by reversals, generalized transpositions, and translocations using permutation groups. J. Comput. Biol. 2010; 17:685–705. [DOI] [PubMed] [Google Scholar]
- 18. Kurtz S., Phillippy A., Delcher A.L., Smoot M., Shumway M., Antonescu C., Salzberg S.L.. Versatile and open software for comparing large genomes. Genome Biol. 2004; 5:R12. [DOI] [PMC free article] [PubMed] [Google Scholar]
Associated Data
This section collects any data citations, data availability statements, or supplementary materials included in this article.


