


Abstract
With the rapid increase of the number of protein structures in the Protein Data Bank, it becomes urgent to develop algorithms for efficient protein structure comparisons. In this article, we present the mTM-align server, which consists of two closely related modules: one for structure database search and the other for multiple structure alignment. The database search is speeded up based on a heuristic algorithm and a hierarchical organization of the structures in the database. The multiple structure alignment is performed using the recently developed algorithm mTM-align. Benchmark tests demonstrate that our algorithms outperform other peering methods for both modules, in terms of speed and accuracy. One of the unique features for the server is the interplay between database search and multiple structure alignment. The server provides service not only for performing fast database search, but also for making accurate multiple structure alignment with the structures found by the search. For the database search, it takes about 2–5 min for a structure of a medium size (∼300 residues). For the multiple structure alignment, it takes a few seconds for ∼10 structures of medium sizes. The server is freely available at: http://yanglab.nankai.edu.cn/mTM-align/.
INTRODUCTION
Comparisons of protein structures are frequently employed in many related studies, such as protein–ligand binding sites recognition (1) and evolutionary conservation analysis (2,3). This is because protein structure is more conserved than sequence during evolution. To date, there are ∼140 000 structures in the Protein Data Bank (PDB) (4) and this number is increasing with the weekly update of ∼200 new structures. When separating the structures into chains and domains, the total numbers of chain and domain structures increase to ∼330 000 and ∼500 000, respectively. Supposing that on average one second is required to compare two structures, it will take > 5 days to search the whole domain database for a query structure. Thus, it becomes very challenging to search such huge structure databases within a reasonable time (e.g. a few minutes). This makes it very urgent to develop algorithms for efficient protein structure comparisons.
There are at least the following three topics in the field of protein structure comparisons. The first is pairwise protein structure alignment that aims to identify the equivalent residues and measure the similarity between two structures. Many tools have been developed and the most commonly used include TM-align (5), Dali (6) and CE (7). The second is multiple protein structure alignment (MSTA) that aims to align multiple structures from the same family to find their conserved regions. A few MSTA algorithms are available, such as mTM-align (8), Matt (9) and POSA (10). The pairwise structure alignment and MSTA methods can be classified into different groups based on the consideration of structure flexibility and sequence order. For example, the flexibility of protein structures is considered in some methods, such as Matt (9) and POSA (10). Some methods are for non-sequential alignment, in which the sequence order information is not considered and thus cross-alignment is allowed. The earlier version of Dali (6) is for non-sequential alignment, which was turned off in the current version. The third is protein structure database search that aims to find the structures which are structurally similar to the query, from a big structure database such as PDB. The major problem in structure database search is the low speed. A fast search can be performed based on sequence alignment tools such as PSI-BLAST (11). However, structures with dissimilar sequences (i.e. remote homologies) will be missed with such search. The most accurate method is to run one-against-all pairwise structure alignment, which is too slow to be practical. Some methods were developed to keep a balance between the speed and the accuracy, including Dali server (2,12,13), SSM (14), PhyreStorm (15) and FATCAT (16). Most search tools are for rigid monomer structures while there is a method TopSearch for complex structure search (17). In FATCAT, flexibility of structure was considered in the database search.
We note that the above topics are closely related. The MSTA can be developed based on the pairwise alignment. For example, MSTA algorithms mTM-align (5) and CE-MC (18) are the extensions of the pairwise alignment algorithms TM-align and CE, respectively. The Dali server utilizes some heuristics to speed up the search, which relies on the pairwise alignment program Dali in both the intermediate and the final steps (2,12,13). In this work, we show that the database search and MSTA can interplay with each other.
Here, we present the mTM-align server for efficient protein structure comparisons. Our algorithms are designed for rigid and sequential structure comparisons of monomer structures. The server consists of two closely related modules: one for database search and the other for MSTA. After the search is done, a MSTA is performed automatically with the top 10 structures, using the second module. The users are also able to select other structures from the returned list to perform MSTA.
MATERIALS AND METHODS
Benchmark dataset
To assess the database search algorithm, we constructed a benchmark dataset (denoted by D500) consisting of 500 randomly selected domains from SCOPe (19), by taking into account the number of structures in each SCOPe fold and the size of structures (50–500 residues). These structures come from 386 different folds in SCOPe, which cover 370 of the 449 folds with >50 structures; and 41 of the 46 folds with >1000 structures. This indicates that the benchmark dataset has a high coverage of the SCOPe folds.
In addition, to make an extreme assessment for the database search with targets that do not have similar sequences in PDB, we selected a total of eight free-modeling targets (denoted by D8) from the CASP12 experiments (http://predictioncenter.org/casp12/). The structures of these targets were privately obtained from the CASP organizer for internal use and they have not been released in PDB. PSI-BLAST search of these targets against the PDB sequences does not return any hits at e-value of 0.001.
Overview of the mTM-align server
Figure 1 shows the overall flowchart of the server, which consists of two modules: one for database search and the other for MSTA. For input of a single structure, the first module is executed to perform a fast database search based on a heuristic algorithm and a hierarchical organization of the structures in the database. For input of more than one structure, the second module is called to perform a MSTA.
Figure 1.

The overall workflow of the mTM-align server.
Preparation of the structure databases
To facilitate the search for both multi-domain structures and single-domain structures, we prepared two databases based on PDB, one for chain structures (denoted by PDBC) and the other for domain structures (denoted by DOM). The DOM database was constructed as follows. For each PDB entry, the domain definition for each chain was taken from SCOPe (19), if it has annotation in the database. Otherwise, the PDP program (20) was used to cut each chain structure into domains. After excluding structures with less than 30 residues, we get ∼330 000 and ∼470 000 structures in PDBC and DOM, respectively. To speed up the database search, both databases are clustered at 50% sequence identity by CD-HIT (21). The biggest structure from each cluster is used as the representative of the cluster. Our experiments show that on average >90% structures in the same cluster share TM-score ≥0.5 with the representative structure (22). The numbers of structures are reduced to ∼30 000 and ∼40 000 for the chain and domain databases, respectively. To make it convenient to describe, the full database is denoted by DB (PDBC or DOM), while the non-redundant one is denoted by NRDB (PDBC50 or DOM50). The relationship between DB and NRDB is illustrated in the Supplementary Figure S1. For each NRDB, all-against-all structure alignments are performed by TM-align to record all pairwise TM-scores, which will be used to accelerate the database search later.
Algorithm for database search
A heuristic algorithm is employed to speed up the database search, with a similar idea to the Dali server (2). The flowchart of the algorithm is shown in the Supplementary Figure S2. The query sequence is compared with the sequences in NRDB by PSI-BLAST (11) to find similar sequences at e-value <0.001. If hits are found, a procedure called ‘walk’ (please note that the name and the idea of walk were from the Dali server papers (2,13)) is used to find more similar structures in NRDB (introduced in the next paragraph). Otherwise, the query structure will be compared with all structures in NRDB by fTM-align, a fast version of TM-align, which works by reducing the number of iterations in TM-align. Our tests show that compared with TM-align, the average TM-score by fTM-align is reduced by <0.1% while the speed is increased by 15 times.
The walk is an iterative method to find new similar structures in NRDB that are missed by PSI-BLAST. It starts from the hit set (denoted by H) from PSI-BLAST and adds one new structure into H in each iteration. First, the TM-score between the query and each hit in H is computed with TM-align. Then, the ‘closest neighbor’ (not in H) of each hit (i.e. the one with the highest pre-calculated TM-score to the hit) is regarded as a new candidate to be added into H. The set of these neighbors are denoted by N. The purpose of the walk is to avoid performing the time-consuming structure alignment between the query and the structures in N. This is realized by estimating the TM-score e(q, Ni) between the query and the ith structure in N as
 |
(1) |
where TM(,) represents the TM-score between two structures. The structure in N with the highest estimated TM-score is selected and added into H. After this, another iteration is performed with the new set H. The iteration stops when both conditions are satisfied: a specified number of hits (200) have been arrived and the estimated TM-scores for all neighbors are <0.7. Assessment on the benchmark set D500 suggests that almost all of the similar structures with TM-score >0.7 can be detected with the walk procedure (please refer to the Supplementary Figure S3). On average, the walk takes 24 and 22 s per structure to search the PDBC50 and the DOM50, respectively. On the contrary, it takes on average 112 and 70 s per structure for full structure comparison with TM-align.
The identified structures from NRDB are expanded to other structures in DB that are in the same cluster of each identified structure. Then the query structure will be aligned to the structures in the expanded results. Structures with TM-score >0.5 will be included into the final list. Since the TM-score is normalized by the length of the query, all structures with short length (less than half of the query length) are excluded at this stage to speed up the calculations.
In addition, it is known that some proteins with highly similar sequences do not necessarily share similar structures. For such proteins, the heuristic algorithm described above may fail to detect similar structures. To solve this problem, another search against the whole database (DB) is performed using PSI-BLAST at e-value of 0.001, which quickly detects all proteins with similar sequences to the query. These proteins are then combined with expanded search results from the NRDB.
Algorithm for multiple protein structure alignment
As shown in Figure 1, the MSTA algorithm consists of three steps. (i) Run TM-align to generate all pairwise structure alignments and TM-scores for the input set of structures. (ii) Generate a structure-based phylogenetic tree based on the pairwise TM-scores. (iii) Build the MSTA progressively based on dynamic programming. The details about the algorithm are available from our recent work (8).
INPUT AND OUTPUT OF THE SERVER
Input
There are two different inputs, one for each module of the server. For the first module of the database search, the input is one structure in PDB or mmCIF format. The structure should contain only one chain. Input of PDB ID or SCOPe ID is also allowed. An option is provided to automatically cut the query structure into domains by the PDB program (20). However, the cut may be inaccurate sometimes and a better way is to manually cut the domains based on visual inspection of the structures. The users can also select between the chain or domain database (PDBC and DOM). The default selection is ‘Auto’, which means the server automatically switches between the chain and the domain databases depending on if the input is a multi-domain or a single-domain structure, as judged by the PDP program. For the second module of the MSTA, the input is a tarball with all structures included into it. It is also required that each structure in the tarball should contain only one chain. Other options are also provided, including PDB IDs, SCOPe IDs and file browsers to upload structure files one by one.
Output
For each submission, a job ID and a URL are assigned. In general, it takes 2–5 min to complete the database search for a structure of a medium size (∼300 residues). For the multiple structure alignment, it takes a few seconds to generate a MSTA for the input with ∼10 structures of medium sizes.
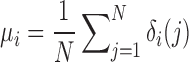
For the database search, the search results will be displayed on the web page of the URL assigned and a notification email will be sent to the user for accessing the results. An example output page is available at: http://yanglab.nankai.edu.cn/mTM-align/example_search/. The major output results include the following three sections. (i) A list of structures that have TM-score > 0.5 to the query structure. (ii) An automated MSTA generated with the query and the top 10 TM-score-ranked structures. The users can select other structures from the list and click on the button ‘Run mTM-align’ to generate other MSTAs. (iii) A visualization of residue-specific percentage of non-gap positions in the alignments, which is computed based on the pairwise alignments between the query and the structures in the result list of (i):
 |
(2) |
where N is the total number of structures in the result list; δi(j) is an indicator function, which equals to 1 if the ith residue in the query is aligned to a residue in the jth structure, and 0 otherwise. The residues are shown in colors going from blue through green to red. For residues with no gap (i.e. μi = 1), the blue color is used. For residues with full gaps (i.e. μi = 0), the red color is used.
An example output page for the MSTA is available at: http://yanglab.nankai.edu.cn/mTM-align/example_mTM-align. The output includes three parts. (i) The alignment of the input set of structures. (ii) The metrics of the alignment. To measure the quality of the alignment, six metrics are calculated: Lcore, ccRMSD, ccTM-score, Lali, RMSD and TM-score. The first three are for the common core region and the last three are for the whole alignment. The detailed definitions about these metrics are available in (8). (iii) The visualization of the alignment by the 3Dmol library (23).
PERFORMANCE OF THE SERVER
The performance of the multiple structure alignment by mTM-align algorithm has been assessed rigorously on four benchmark datasets in our recent work (8). It shows that mTM-align significantly outperforms other methods in terms of both running speed and alignment accuracy. We assess the performance of the database search below.
Selected methods for comparison
The performance of the database search was compared with the Dali server (http://ekhidna2.biocenter.helsinki.fi/dali/) and the SSM server (http://www.ebi.ac.uk/msd-srv/ssm/), which are two popular servers for structure database search. To compare the servers under the same environment, we downloaded the standalone version of the Dali server (from http://ekhidna.biocenter.helsinki.fi/dali_lite/downloads/v3/) and ran it locally with the default options. However, we noted that the database provided for download was obsolete because its size is about half of the updated one (according to the comparison to the statistics at the server's website). To make the comparison as fair as possible, we also submitted the benchmark structures to the Dali server. For SSM, no standalone version is available for download and thus we just compare the returned results of its server submissions. Default options were used when submitting all structures to both servers.
Comparison based on the quality of structure alignment
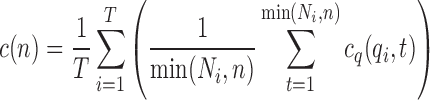
To assess the quality of structure alignment, an independent tool called STOVCA (24) was used. STOVCA is a program for evaluating pairwise structure alignment algorithms. For two structures q and t, STOVCA derives its ‘optimal’ structure alignment according to the superimposed structures from any pairwise structure comparison method. It then gives out a series of scores representing the quality of the alignment. Here the score cq(q,t) is used, which is defined as the alignment length divided by the length of the query. Other scores are defined similarly but with different normalization lengths (e.g. by the smaller, the bigger or the average size of the two structures). The normalization by the query length should be more reasonable for assessing database search results. Nevertheless, assessments based on other scores were also conducted but the conclusion remains the same (data not shown). For the Dali server, superimposed structures were directly downloaded from the server. For the local version of Dali and our method, superimposed structures were generated by the respective pairwise alignment methods. However, we failed to find a way to obtain the superimposed structures for the SSM server, which was thus excluded for comparison with this method.
For each query in the benchmark dataset, the average of the scores for the top n returned structures is first calculated. Then the average over all queries in the whole benchmark dataset is computed, reflecting the performance of each method:
 |
(3) |
where T is the total number of structures in a benchmark dataset, Ni is the total number of structures in the result list for the ith query qi, and t is the tth structure in the result list.
The results on the SCOPe dataset D500 for Dali and mTM-align are summarized in Figure 2A. For mTM-align, there are two versions of results, mTM-align_PDBC and mTM-align_DOM, which represent the search against the chain database and the domain database, respectively. For Dali, the results from the online submission and the local version are denoted by Dali_online and Dali_local, respectively. It shows that for all methods, the score c(n) goes down steadily along with the increase of the top number of the targets considered. This is expected because the structures with a higher rank in the result list are usually more similar to the query than those ranked lower. Dali_local performs the worst among all four methods, probably because the database used is the smallest and the program may be outdated (judged from the timestamp of the program, i.e. 31 January 2010). The score for mTM-align_PDBC is slightly higher than mTM-align_DOM, as the chain structures are longer and have a higher chance to generate longer alignment than with domain structures. It can be seen that mTM-align outperforms Dali for all cutoffs, which indicates that our algorithm is able to detect more highly-similar structures. The results on the CASP12 dataset D8 are shown in Figure 2B, from which similar conclusions can be drawn as well. However, there are some fluctuations in the curves, due to the small size of the dataset.
Figure 2.

The performance comparison of the database search between the mTM-align server, the Dali server and the SSM server. (A), (C) and (D) are for the SCOPe dataset D500 while (B) is for the CASP12 dataset D8.
Comparison based on the fold definition of SCOPe
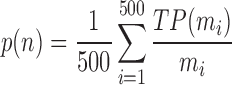
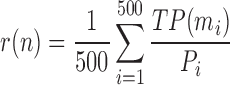
Another way to make the comparison is based on the fold definition in the SCOPe database. A structure in the top n of the result list is defined as a true positive (TP) if its fold definition is the same as the query. A structure will be skipped in case there is no SCOPe annotation for it. The mean precision (Equation 4) and recall (Equation 5) are then used to measure the performance of each method:
 |
(4) |
 |
(5) |
where mi = min(Ni, n) and Ni is the same as Equation (3) and Pi is the total number of structures in the database with the same fold of the ith query.
Figures 2B and C present the precision and coverage, respectively, for all compared methods. It is interesting to see that for mTM-align, the precision and coverage for the search against the domain database are the highest among all compared methods at all cutoffs. This may be because the structures in the benchmark dataset are all single-domain structures and thus are more suitable to search against a domain database. This motivates us to provide both chain and domain databases in the web server, to perform sensitive search for multi-domain and single-domain structures, respectively. It is apparent that SSM has lower precision and coverage than other methods, which is because the algorithm is mainly based on the matching of secondary structure and not accurate enough. When the top number of structures evaluated (i.e. n) is <40, the precisions of Dali and mTM-align_PDBC are very similar (see a zoomed version in the Supplementary Figure S4). When n increases, the differences between mTM-align and Dali become bigger, showing the advantage of our algorithm in the identification of similar structures.
Comparison based on the speed of the search
The speed of the search by mTM-align and Dali is compared in Figure 3. The speed is defined as the average running time (in second) used for each structure in the benchmark dataset. For Dali, the running time is only available for the local version. All programs were executed under a Linux server of two Intel Xeon E5-2620 v3, 2.4 GHz CPUs and 256G memory. A single core is used for each program. SSM was not compared here as no standalone version is available. Figure 3A shows the running time of mTM-align and Dali_local on the SCOPe dataset D500. We can see that for that mTM-align took on average 186s to search the chain database PDBC. On the contrary, Dali_local used 424s, which is 2.3 times of mTM-align's running time. On the CASP12 dataset D8, it took much more time to complete the search against the chain database for both Dali and mTM-align. This is because no hits were detected based on PSI-BLAST search and thus the structure alignment-based search was conducted. Nevertheless, mTM-align is also faster than Dali (1434 s versus 2396 s per structure). We note that the time used for the search against the chain and the domain database by mTM-align is different. For the dataset D500/D8, mTM-align_PDBC is faster/slower than mTM-align_DOM. We decomposed the total running time of mTM-align search into two parts: the heuristic NRDB search and the expansion to DB based on structure alignment. For the D500 dataset, the second part takes ∼90% of total running time for both versions. For the D8 dataset, this reduces to 65% and 40% for mTM-align_PDBC and mTM-align_DOM, respectively, due to the inherent difference between the targets in D500 and D8.
Figure 3.

The running time comparison between mTM-align and Dali on the SCOPe dataset D500 (A) and the CASP12 dataset D8 (B).
CONCLUSIONS
We have developed the mTM-align server for efficient protein structure comparisons. It has two closely related modules, one for fast database search with one input structure, and the other for multiple structure alignment with two or more input structures. Benchmark tests demonstrate that our algorithms outperform other peering methods for both modules, in terms of both speed and accuracy. One of the unique features for the server is the interplay between database search and multiple structure alignment. The server provides service not only for performing fast database search, but also for making efficient and accurate multiple structure alignment with the structures returned by the database search. We anticipate this feature will make the server become a valuable platform for many real-world applications, such as evolution and conservation analysis for protein structure, protein function annotation and protein design.
Supplementary Material
ACKNOWLEDGEMENTS
We would like to thank Dr Jianlin Cheng for sending us the PDP program.
SUPPLEMENTARY DATA
Supplementary Data are available at NAR Online.
FUNDING
National Natural Science Foundation of China (NSFC) [11501407, 11501306]; National Institutes of Health [GM083107, GM116960]; Fok Ying-Tong Education Foundation [161003]; Thousand Youth Talents Plan of China. Funding for open access charge: NSFC [11501306].
Conflict of interest statement. None declared.
REFERENCES
- 1. Yang J., Roy A., Zhang Y.. protein–ligand binding site recognition using complementary binding-specific substructure comparison and sequence profile alignment. Bioinformatics. 2013; 29:2588–2595. [DOI] [PMC free article] [PubMed] [Google Scholar]
- 2. Holm L., Rosenstrom P.. Dali server: conservation mapping in 3D. Nucleic Acids Res. 2010; 38:W545–W549. [DOI] [PMC free article] [PubMed] [Google Scholar]
- 3. Yang J.M., Tung C.H.. Protein structure database search and evolutionary classification. Nucleic Acids Res. 2006; 34:3646–3659. [DOI] [PMC free article] [PubMed] [Google Scholar]
- 4. Rose P.W., Prlic A., Altunkaya A., Bi C., Bradley A.R., Christie C.H., Costanzo L.D., Duarte J.M., Dutta S., Feng Z. et al. . The RCSB protein data bank: integrative view of protein, gene and 3D structural information. Nucleic Acids Res. 2017; 45:D271–D281. [DOI] [PMC free article] [PubMed] [Google Scholar]
- 5. Zhang Y., Skolnick J.. TM-align: a Protein Structure Alignment Algorithm Based on the TM-score. Nucleic Acids Res. 2005; 33:2302–2309. [DOI] [PMC free article] [PubMed] [Google Scholar]
- 6. Holm L., Sander C.. Protein structure comparison by alignment of distance matrices. J. Mol. Biol. 1993; 233:123–138. [DOI] [PubMed] [Google Scholar]
- 7. Shindyalov I.N., Bourne P.E.. Protein structure alignment by incremental combinatorial extension (CE) of the optimal path. Protein Eng. 1998; 11:739–747. [DOI] [PubMed] [Google Scholar]
- 8. Dong R., Peng Z., Zhang Y., Yang J.. mTM-align: an algorithm for fast and accurate multiple protein structure alignment. Bioinformatics. 2018; 34:1719–1725. [DOI] [PMC free article] [PubMed] [Google Scholar]
- 9. Menke M., Berger B., Cowen L.. Matt: local flexibility aids protein multiple structure alignment. PLoS Comput. Biol. 2008; 4:e10. [DOI] [PMC free article] [PubMed] [Google Scholar]
- 10. Li Z., Natarajan P., Ye Y., Hrabe T., Godzik A.. POSA: a user-driven, interactive multiple protein structure alignment server. Nucleic Acids Res. 2014; 42:W240–W245. [DOI] [PMC free article] [PubMed] [Google Scholar]
- 11. Altschul S.F., Madden T.L., Schaffer A.A., Zhang J., Zhang Z., Miller W., Lipman D.J.. Gapped BLAST and PSI-BLAST: a new generation of protein database search programs. Nucleic Acids Res. 1997; 25:3389–3402. [DOI] [PMC free article] [PubMed] [Google Scholar]
- 12. Holm L., Laakso L.M.. Dali server update. Nucleic Acids Res. 2016; 44:W351–W355. [DOI] [PMC free article] [PubMed] [Google Scholar]
- 13. Holm L., Kaariainen S., Rosenstrom P., Schenkel A.. Searching protein structure databases with DaliLite v.3. Bioinformatics. 2008; 24:2780–2781. [DOI] [PMC free article] [PubMed] [Google Scholar]
- 14. Krissinel E., Henrick K.. Secondary-structure matching (SSM), a new tool for fast protein structure alignment in three dimensions. Acta Crystallogr. D, Biol. Crystallogr. 2004; 60:2256–2268. [DOI] [PubMed] [Google Scholar]
- 15. Mezulis S., Sternberg M.J.E., Kelley L.A.. PhyreStorm: a web sServer for fast structural searches against the PDB. J. Mol. Biol. 2016; 428:702–708. [DOI] [PMC free article] [PubMed] [Google Scholar]
- 16. Ye Y., Godzik A.. FATCAT: a web server for flexible structure comparison and structure similarity searching. Nucleic Acids Res. 2004; 32:W582–W585. [DOI] [PMC free article] [PubMed] [Google Scholar]
- 17. Wiederstein M., Gruber M., Frank K., Melo F., Sippl M.J.. Structure-based characterization of multiprotein complexes. Structure. 2014; 22:1063–1070. [DOI] [PMC free article] [PubMed] [Google Scholar]
- 18. Guda C., Lu S., Scheeff E.D., Bourne P.E., Shindyalov I.N.. CE-MC: a multiple protein structure alignment server. Nucleic Acids Res. 2004; 32:W100–W103. [DOI] [PMC free article] [PubMed] [Google Scholar]
- 19. Fox N.K., Brenner S.E., Chandonia J.M.. SCOPe: Structural Classification of Proteins—extended, integrating SCOP and ASTRAL data and classification of new structures. Nucleic Acids Res. 2014; 42:D304–D309. [DOI] [PMC free article] [PubMed] [Google Scholar]
- 20. Alexandrov N., Shindyalov I.. PDP: protein domain parser. Bioinformatics. 2003; 19:429–430. [DOI] [PubMed] [Google Scholar]
- 21. Li W., Godzik A.. Cd-hit: a fast program for clustering and comparing large sets of protein or nucleotide sequences. Bioinformatics. 2006; 22:1658–1659. [DOI] [PubMed] [Google Scholar]
- 22. Zhang Y., Skolnick J.. Scoring function for automated assessment of protein structure template quality. Proteins: Struct. Funct. Bioinformatics. 2004; 57:702–710. [DOI] [PubMed] [Google Scholar]
- 23. Rego N., Koes D.. 3Dmol.js: molecular visualization with WebGL. Bioinformatics. 2015; 31:1322–1324. [DOI] [PMC free article] [PubMed] [Google Scholar]
- 24. Slater A.W., Castellanos J.I., Sippl M.J., Melo F.. Towards the development of standardized methods for comparison, ranking and evaluation of structure alignments. Bioinformatics. 2013; 29:47–53. [DOI] [PubMed] [Google Scholar]
Associated Data
This section collects any data citations, data availability statements, or supplementary materials included in this article.