Abstract
Background
Using regional homogeneity (ReHo) blood oxygen level-dependent functional MR (BOLD-fMRI), we investigated the structural and functional alterations of brain regions among patients with methamphetamine-associated psychosis (MAP).
Material/Methods
This retrospective study included 17 MAP patients, 16 schizophrenia (SCZ) patients, and 18 healthy controls. Informed consent was obtained from all patients before the clinical assessment, the severity of clinical symptoms was evaluated prior to the fMRI scanning, and then images were acquired and preprocessed after each participant received 6-min fRMI scanning. The participants all underwent BOLD-fMRI scanning. Voxel-based morphometry was used to measure gray matter density (GMD). Resting-state fMRI (rs-fMRI) was conducted to analyze functional MR, ReHo, and functional connectivity (FC).
Results
GMD analysis results suggest that MAP patients, SCZ patients, and healthy volunteers show different GMDs within different brain regions. Similarly, the ReHo analysis results suggest that MAP patients, SCZ patients, and healthy volunteers have different GMDs within different brain regions. Negative correlations were found between ReHo- and the PANSS-positive scores within the left orbital interior frontal gyrus (L-orb-IFG) of MAP patients. ReHo- and PANSS-negative scores of R-SFG were negatively correlated among SCZ patients. The abnormal FC of R-MFG showed a negative correlation with the PANSS score among MAP patients.
Conclusions
The abnormalities in brain structure and FC were associated with the development of MAP.
MeSH Keywords: Brain Diseases, Methamphetamine, Psychotic Disorders
Background
Methamphetamine (METH) is a member of amphetamine-type stimulants (ATS) family. According to the World Drug Report by the United Nations, ATS are the second most commonly used illegal drug in 2014, and it is abused as commonly as the opiate drugs in China [1]. According to a report of National Narcotic Control Commission (NNCC) of China, the cumulative number of registered drug users in China increased dramatically, from 0.07 million in 1990 to 2.09 million, by the end of 2012. Due to the epidemic of METH, the incidence rate of methamphetamine-associated psychosis (MAP) has increased dramatically.
It has been proven that ATS can produce psychotic symptoms, such as persecutory delusions, auditory hallucinations, visual hallucinations, delusions of reference, and thought broadcasting [2,3]. The symptom of psychosis was generally present for an average of 5.2 years after METH was first used [4]; therefore, MAP is hard to diagnose at early stages. In addition, 25~50% of long-term METH-dependent subjects suffer from MAP during their lifetime [5]. Since the incidence of psychotic disorders among drug addicts in southwest China reached 77.1% [6], MAP has recently become a clinical concern.
With the development of functional magnetic resonance imaging (fMRI), the structural MR and functional images of the brain became available. FMRI can describe the volumetric changes in patients with psychotic disorders [7,8]. Over the past few years, fMRI has been widely applied to a wide range of diseases, such as renal disease, Parkinson diseases, and neuro-Bechet’s disease. Resting-state fMRI (rs-fMRI) can present the functional connectivity, which provides us with a better understating of the disease pathophysiology. Previous study results indicated that METH abusers often exhibited reduced reaction time adjustments and reduced activation in the prefrontal cortex. Salo et al. found impairment of prefrontal cortical function and disruption of adaptive cognitive control in METH users.
Thus, the present study was performed to investigate the concentration of gray matter and functional alternations of the brain in MAP patients and schizophrenia (SCZ) patients by use of ReHo blood oxygen level-dependent functional MR (BOLD-fMRI) to explore the potential difference between MAP and SCZ patients.
Material and Methods
Participants
We recruited right-handed men ages 18~45 years, and placed them into 3 groups: MAP (n=19), SCZ (n=19), and control (n=18). MAP was diagnosed according to the International Classification of Diseases-10 (ICD-10) research criteria. The inclusion criteria for the MAP group were as follows: (a) they volunteered to detox from METH; (b) they met the criteria of substance-associated psychosis of ICD-10, but their course standard could be more than 1 month; (c) direct laboratory evidence (urine, blood, and hair) proved that they had a history of METH abuse; (d) they achieved the medium or serious level in ≥t items of delusion, hallucinatory behavior, grandiosity, suspiciousness/persecution, and unusual thought content. The exclusion criteria were as follow: (a) subjects had a history of SCZ, mood disorders, neurosis, or mental retardation; (b) they had a history of serious somatic diseases or organic brain diseases, such as stroke or brain injury; (c) they presented a seropositive test for HIV; (d) they were incompatible for MRI; (e) they abused harmful substances other than METH and nicotine; (f) they were delirious; (g) they had a history of epileptic seizure or had a family history of epilepsy; (h) they had used benzodiazepines 1 week prior to fMRI examination; (i) their head translation or rotation was more than 3 mm/3°.
The inclusion and exclusion criteria of SCZ patients were similar to the MAP group, except that they met the criteria for SCZ according to ICD-10. Informed consent from all participants was obtained before the neuroimaging and other clinical assessments. This retrospective study was approved by the local Ethics Committee and the Institutional Review Board, and all participants signed the informed consent before participating in this study.
Data collection and follow-up
Personal information on demographics, history of psychoactive drug use, and history of body/mental disease were collected. In addition, detailed information on METH use and its relationship with onset and disappearance of psychotic symptoms was obtained after interviewing the patients. Moreover, the history of psychiatric disorders and serious somatic diseases were recorded. Participants were followed up for 6 months after their first interview.
Clinical evaluation
The diagnoses of MAP and SCZ were confirmed by 2 senior attending psychiatrists, and the severity of the clinical symptoms was assessed prior to the fMRI scan using the Positive and Negative Syndrome Scale (PANSS) and the Mini International Neuropsychiatric Interview (MINI).
MRI acquisition
The MRI scans were performed on a 3.0T Signa HDxt scanner (GE Healthcare, America) with an 8-channel head coil MRI scanner at the Department of Psychology, Qiqihar Mental Health Center. The anatomical MRIs were administered with T1-weighted sequence for 300 s using the fast spin echo sequence. Parameters for the OAx T1 FLAIR were shown as: repetition time (TR)=2300 ms, echo time (TE)=2.96 ms, field of vision (FOV)=256×256 cm, image matrix=256×256, voxel dimensions=1.0×1.0×1.0 cm, layer thickness=1.0 mm, layer gap=0.0 mm, and 192 layers in total. Then, rs-fMRIs were obtained by 400-second-BOLD-fMRI scanning with echo planar imaging (EPI) sequence, and the scanning orientation was parallel to the anatomical MRI. All participants were required to close their eyes, lie down, rest without thinking, and keep their head still. The parameters were set as follow: TR=2000 ms, TE=30 ms, flip angle (FA)=90°, FOV=220×220 mm, image matrix=64×64, layer thickness=4.0 mm, and 33 layers in total. For each participant, the fMRI scanning lasted for approximately 6 min.
Image preprocessing
All the images were reconstructed and transformed to NIFTI by using the software SPM8 (http://www.fil.ion.ucl.ac.uk/spm/software/spm8/) running on the MATLAB 2011b. Structural image preprocessing and the gray matter density (GMD) were performed using the same software, while the functional image preprocessing, individual ReHo calculation and whole-brain functional connectivity (FC) were analyzed using DPARSF 2.0 software (http://www.nitrc.org/projects/dparsf).
GMD
The structural images were divided into cerebrospinal fluid, gray matter (GM), and white matter using the unified segment. According to non-linear methods, the segmented subareas were spatially normalized to standard brain space, and were smoothed by a 6×6×6 FWHM Gaussian kernel to obtain a GM concentration map. The GMD density was analyzed using Marsbar software.
Individual ReHo
For functional image preprocessing, the first 10 volumes of the EPI sequence were discarded to avoid signal instability. Slice timing was conducted to correct the remaining volumes, and head realign was used to reject abnormal participants who had more than 3 mm of motion or 3.0° of rotation. The realigned sequences were spatially normalized to the MNI (Montreal Neurological Institute) coordinate and voxels were resampled to 3×3×3 mm3. Then, images were band-pass filtered (0.01–0.08 Hz) to reduce low-frequency drift and physiological high-frequency noise, including breath and heart beats. Then, signals were regressed out before ReHo computation, including head parameter in 6 dimensions, white matter, cerebrospinal fluid (CSF), and global brain. Individual ReHo was calculated with the Kendall’s coefficient concordance (KCC) method. ReHo maps were normalized by dividing KCC among each voxel by the averaged ReHo of the entire brain and were smoothed by a 4×4×4 FWHM Gaussian kernel to avoid the spatial noise and the false data caused by spatial normalization.
Seed ROI FCM
According to the analysis of ReHo, group differences in ReHo were found, and points with peak values in sub-regions were defined as seeds. Spheres with a 6-mm radius and with the seeds as the center were designated as the regions of interest (ROIs). Each voxel in an ROI was calculated as the mean value according to the time sequence. Pearson’s correlation analysis was performed to obtain the whole-brain correlation maps, and Fisher Z translation was calculated to receive whole-brain functional connectivity maps (FCM).
Statistical analysis
For GMD, ReHo, and FC analyses, one-way ANOVA was initially conducted in the SPM8 to explore whether there were significant differences among the 3 groups: MAP, SCZ, and controls. Post hoc analysis was performed in SPSS 18.0 to detect the group differences within ROIs between paired subgroups. At last, correlation analysis was administrated for 3 parameters and PANSS score in patient groups. The statistical threshold for one-way ANOVA in GMD analysis was set at P<0.001 and clusters size >40. For ReHo comparison, the corrected data according with a combination criterion of voxel-wise P value less than 0.001 and cluster sized greater than 6 voxels were regarded as statistically significant, which was the same in the FC analysis.
Results
Subjects
We excluded 2 MAP participants and 3 SCZ participants because their head motion/rotation was >3 mm/3°. Finally, there were 17 MAP recruits, 16 SCZ recruits, and 18 healthy volunteers involved in this study. No significant differences were shown among the MAP, SCZ, and control groups regarding age, years of education, sex distribution, alcohol consumption history, smoking history, and positive and negative PANSS scores (P>0.05). However, the total PANSS score in the SCZ group was significantly higher than in the MAP group (P<0.05) (Table 1).
Table 1.
Recorded clinical characteristics and PANSS score for participants.
| Characteristics | MAP patients (n=17) | SCZ patients (n=16) | Heathy controls(n=18) | χ2/F/t value | P value |
|---|---|---|---|---|---|
| Age (years) | 21.0±4.0 | 23.8±4.3 | 23.2±2.3 | 3.015b | 0.058 |
| Education (years) | 11.4±1.4 | 10.8±1.6 | 11.1±1.7 | 0.550b | 0.58 |
| Sex | |||||
| Male | 9 | 7 | 9 | 0.289a | 0.865 |
| Female | 8 | 9 | 9 | ||
| Alcohol | 0.216a | 0.897 | |||
| Yes | 6 | 5 | 7 | ||
| No | 11 | 11 | 11 | ||
| Smoking | 1.316a | 0.518 | |||
| Yes | 3 | 2 | 5 | ||
| No | 14 | 14 | 13 | ||
| PANSS total | 48.76±3.01 | 76.00±6.00 | – | 20.35b | <0.0001 |
| PANSS positive | 14.59±1.54 | 14.19±2.07 | – | 0.299b | 0.638 |
| PANSS negative | 17.0±4.67 | 18.69±3.98 | – | 1.262b | 0.416 |
MAP – methamphetamine-associated psychosis; SCZ – schizophrenia; PANSS – Positive and Negative Syndrome Scale.
χ2 value;
F/t value.
GMD analysis
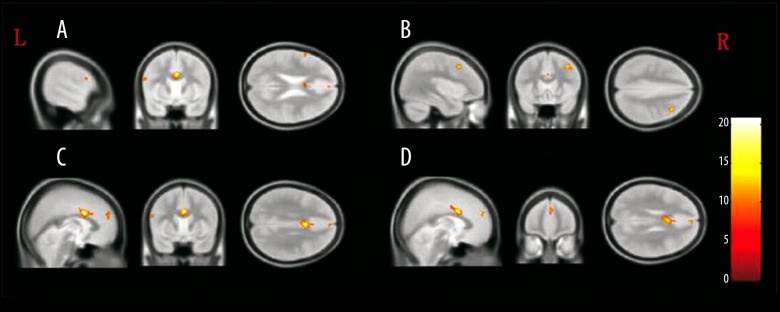
Compared with the control group, higher GMD was observed in the bilateral anterior cingulate (B-AC), bilateral medial superior frontal gyrus (B-MSFG), and left operculum inferior frontal gyrus (L-opr-IFG), whereas lower GMD was observed in right middle frontal gyrus (R-MFG) of the MAP group. In comparison with the control group, the SCZ group presented lower GMD values in L-opr-IFG, B-AC, and R-MFG regions but higher GMD within the B-MSFG region. Compared with the SCZ group, the MAP group showed significantly higher GMD in the L-opr-IFG, B-MSFG, B-AC, and R-MFG regions (Figure 1, Table 2).
Figure 1.
The brain regions that were distinct in gray matter density among MAP, SCZ, and control groups. (A) Left operculum inferior frontal gyrus; (B) right middle frontal gyrus; (C) bilateral anterior cingulate; (D) bilateral medial superior frontal gyrus.
Table 2.
GMD difference analysis among MAP, SCZ and control recruits.
| Brain region | The mean GMD | BA | Voxels | MNI coordinates (x, y, z) | Peak F value | Group mean difference/significance | ||||
|---|---|---|---|---|---|---|---|---|---|---|
| MAP patients | SCZ patients | Control | MAP-control/P | SCZ-control/P | MAP-SCZ/P | |||||
| L-opr-IFG | 0.45 | 0.38 | 0.42 | 45 | 46 | −57, 9, 23 | 10.63 | 0.03/ P=0.036 | −0.04/P=0.014 | 0.07/ P<0.001 |
| B-MSFG | 0.63 | 0.53 | 0.52 | 9 | 67 | 3, 53, 27 | 12.57 | 0.11/ P<0.001 | 0.01/ P=1.000 | 0.10/ P<0.001 |
| B-AC | 0.53 | 0.43 | 0.47 | 24 | 606 | 2, 9, 30 | 20.85 | 0.06/ P=0.032 | −0.04/P=0.197 | 0.10/ P<0.001 |
| R-MFG | 0.71 | 0.53 | 0.72 | 9 | 132 | 38, 18, 44 | 14.85 | −0.01/P=1.000 | −0.19/P<0.001 | 0.18/ P<0.001 |
GMD – gray matter density; MAP – methamphetamine-associated psychosis; SCZ – schizophrenia; BA – bradmann; MNI – Montreal Neurological Institute; B – bilateral; opr-IFG – operculum inferior frontal gyrus; MSFG – medial superior frontal gyrus; AC – anterior cingulate; MFG – middle frontal gyrus.
Individual ReHo analysis
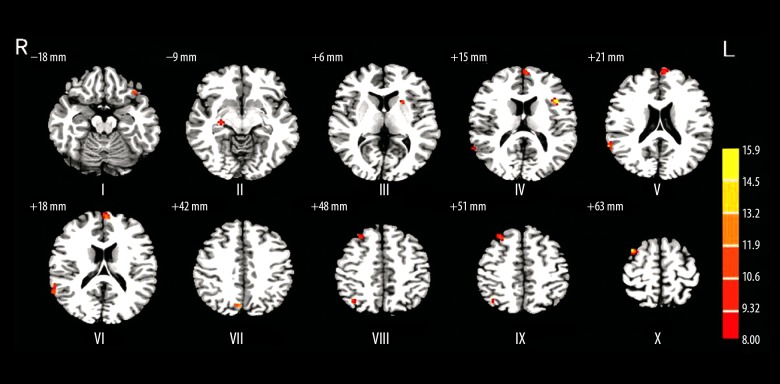
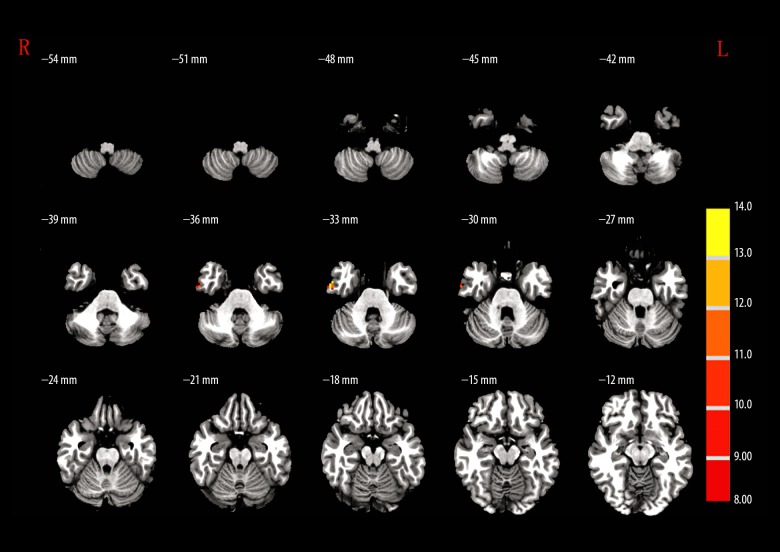
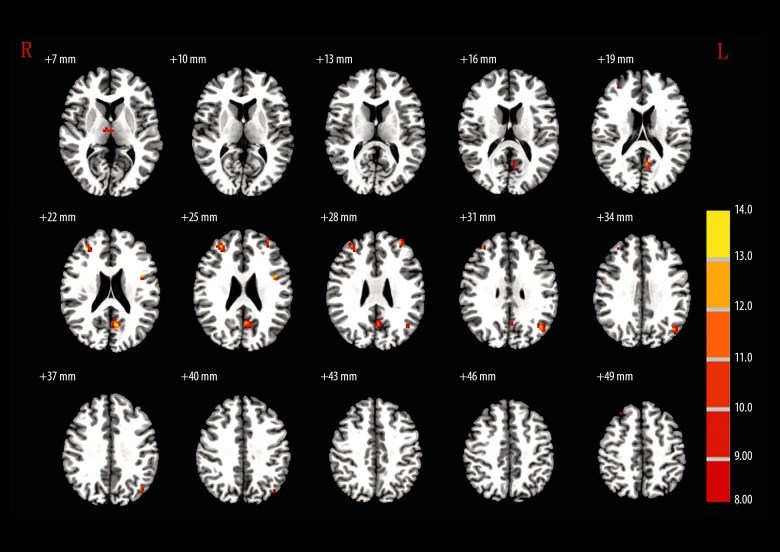
Post hoc analysis revealed that in comparison to healthy volunteers, higher ReHo was detected in the right hippocampus (R-HPC) and left orbital inferior frontal gyrus (L-orb-IFG) regions, whereas significant lower ReHo was observed in left medial superior frontal gyrus (L-MSFG), right angular gyrus (R-ANG), and R-MFG/superior frontal gyrus (SFG) of MAP patients. Similarly, compared with the healthy volunteers, SCZ patients showed higher ReHo in R-HPC, left triangular part (L-TRP)/opr-IFG, and L-LTN regions, but these levels were lower in other tested brain regions. Quite differently, MAP patients demonstrated significantly stronger ReHo in L-orb-IFG, R-STG, L-MSFG, right precuneus (R-PC), and R-SFG regions compared to SCZ patients (Figure 2, Table 3).
Figure 2.
The brain regions that were distinct in ReHo among MAP, SCZ, and control groups. I – left orbital inferior frontal gyrus; II – right hippocampus; III – left lenticular nucleus; IV – left triangular part/opercular part inferior frontal gyrus; V – right superior temporal gyrus; VI – left medial superior frontal gyrus; VII – right precuneus; VIII – right angular gyrus; IX – right middle frontal gyrus/superior frontal gyrus; X – right superior frontal gyrus.
Table 3.
ReHo difference analysis among MAP, SCZ and control recruits.
| Brain region | The mean ReHo | BA | Voxels | MNI coordinates (x, y, z) | Peak F value | Group mean difference/significance | ||||
|---|---|---|---|---|---|---|---|---|---|---|
| MAP patients | SCZ patients | Control | MAP-control/P | SCZ-control/P | MAP-SCZ/P | |||||
| L-orb-IFG | 0.96 | 0.84 | 0.77 | 47 | 8 | −39, 27, −18 | 11.15 | 0.19/ P<0.001 | 0.07/ P=0.240 | 0.12/ P=0.006 |
| R-HPC | 0.84 | 0.88 | 0.67 | 7 | 27, −18, −9 | 11.81 | 0.17/ P=0.002 | 0.21/ P<0.001 | −0.04/ P=0.997 | |
| L-LTN | 0.81 | 1.02 | 0.8 | 14 | −24, 15, 6 | 11.01 | 0.01/ P=1.000 | 0.22/ P<0.001 | −0.21/ P<0.001 | |
| L-TRP/orp-IFG | 0.82 | 1.03 | 0.85 | 13 | 15 | −39, 18, 15 | 15.9 | −0.03/ P=0.916 | 0.18/ P<0.001 | −0.21/ P<0.001 |
| R-STG | 1.3 | 1.02 | 1.32 | 22 | 16 | 66, −51, 21 | 13.59 | −0.02/ P=1.000 | −0.30/ P<0.001 | 0.28/ P<0.001 |
| L-MSFG | 1.27 | 1.08 | 1.44 | 10 | 22 | −3, 63, 18 | 12.69 | −0.17/ P=0.034 | −0.36/ P<0.001 | 0.19/ P=0.018 |
| R-PC | 1.55 | 1.3 | 1.63 | 7 | 9 | 6, −75, 42 | 13.22 | −0.08/ P=0.541 | −0.33/ P<0.001 | 0.25/ P=0.001 |
| R-ANG | 1.44 | 1.37 | 1.69 | 7 | 7 | 39, −63, 48 | 10.66 | −0.25/ P=0.002 | −0.32/ P<0.001 | 0.06/ P=0.945 |
| R-MFG/SFG | 1.14 | 1.05 | 1.39 | 8 | 20 | 30, 30, 51 | 11.94 | −0.25/ P=0.002 | −0.34/ P<0.001 | 0.09/ P=0.595 |
| R-SFG | 1.17 | 0.94 | 1.27 | 6 | 26 | 36, 12, 63 | 15.62 | −0.10/ P=0.148 | −0.33/ P<0.001 | 0.23/ P<0.000 |
ReHo – regional homogeneity; MAP – methamphetamine-associated psychosis; SCZ – schizophrenia; BA – bradmann; MNI – Montreal Neurological Institute; R – right; L – left; orb-IFG – orbital inferior frontal gyrus; HPC – hippocampus; LTN – lenticular nucleus; TRP – triangular part; opr-IFG – operculum inferior frontal gyrus; STG – superior temporal gyrus; MSFG – medial superior frontal gyrus; PC – precuneus; ANG – angular gyrus; MFG – middle frontal gyrus; SFG – superior frontal gyrus.
Functional connectivity (FC) analysis of participants
The peak points of R-HPC, L-MSFG, R-ANG, and R-MFG/SFG were chosen as seeds. The seed regions were specifically shown as: R-HPC (MNI coordinates x=27, y=−18, z=−9), L-MSFG (MNI coordinates x=−3, y=63, z=18), R-ANG (MNI coordinates x=39, y=−63, z=48), and R-MFG/SFG (MNI coordinates x=30, y=30, z=51) (Table 4).
Table 4.
FC analysis among MAP, SCZ and control recruits.
| Brain region | The mean GMD | BA | Voxels | MNI coordinates (x, y, z) | Peak F value | Group mean difference/significance | ||||
|---|---|---|---|---|---|---|---|---|---|---|
| MAP patients | SCZ patients | Control | MAP-control/P | SCZ-control/P | MAP-SCZ/P | |||||
| R-HPC as the seed | 27, −18, −9 | |||||||||
| L-INS | −0.03 | 0.18 | −0.03 | 6 | −33, −18, 6 | 11.29 | 0.00/ P=1.000 | 0.22/ P<0.001 | −0.22/ P<0.001 | |
| L-MSFG as the seed | −3, 63, 18 | |||||||||
| R-MSFG | 0.51 | 0.18 | 0.55 | 9 | 14 | 12, 57, 33 | 13.03 | −0.01/ P=1.000 | −0.37/ P<0.001 | 0.33/ P<0.001 |
| L-SFG/MFG | 0.13 | 0.04 | 0.32 | 8 | 12 | −15, 24,54 | 9.78 | −0.19/ P=0.001 | −0.28/ P<0.001 | 0.09/ P=0.269 |
| L-SFG | 0.35 | 0.17 | 0.56 | 8 | 14 | −21, 36, 54 | 10.05 | −0.21/ P=0.015 | −0.39/ P<0.001 | 0.18/ P=0.060 |
| R-ANG as the seed | 39, −63, 48 | |||||||||
| R-ITG | 0.01 | 0.07 | 0.2 | 20 | 12 | 60, −6, −33 | 7.88 | −0.19/ P<0.001 | −0.13/ P=0.013 | −0.06/ P=0.617 |
| R-MFG/SFG as the seed | 30, 30, 51 | |||||||||
| R-THL | −0.02 | −0.21 | 0.01 | 6 | 6, −15, 6 | 10.88 | −0.03/ P=1.000 | −0.22/ P<0.001 | 0.19/ P<0.001 | |
| L-PC | 0.19 | 0.09 | 0.4 | 31 | 45 | −9, −63, 21 | 14.29 | −0.21/ P=0.004 | −0.31/ P<0.001 | 0.10/ P=0.278 |
| R-MFG | 0.1 | −0.03 | −0.25 | 10 | 29 | 30, 45, 24 | 13.7 | 0.35/ P<0.001 | 0.22/ P=0.003 | 0.18/ P=0.280 |
| L-opr-IFG | 0.03 | −0.07 | −0.24 | 8 | −45, 3, 24 | 13.74 | 0.27/ P<0.001 | 0.17/ P=0.007 | 0.10/ P=0.165 | |
| L-MFG | −0.07 | −0.09 | −0.35 | 10 | 12 | −33, 51, 27 | 12.41 | 0.28/ P<0.001 | 0.26/ P<0.001 | 0.002/ P=1.000 |
| L-ANG | 0.28 | 0.23 | 0.58 | 39 | 34 | −42, −66, 30 | 12.87 | −0.30/ P<0.001 | −0.35/ P<0.001 | 0.05/ P=1.000 |
FC – functional connectivity; MAP – methamphetamine-associated psychosis; SCZ – schizophrenia; BA – bradmann; MNI – Montreal Neurological Institute; R – right; L – left; HPC – hippocampus; INS – insula; MSFG – medial superior frontal gyrus; SFG – superior frontal gyrus; MFG – middle frontal gyrus; ITG – inferior temporal gyrus; THL – thalamus; PC – precuneus; opr-IFG – operculum inferior frontal gyrus; ANG – angular gyrus.
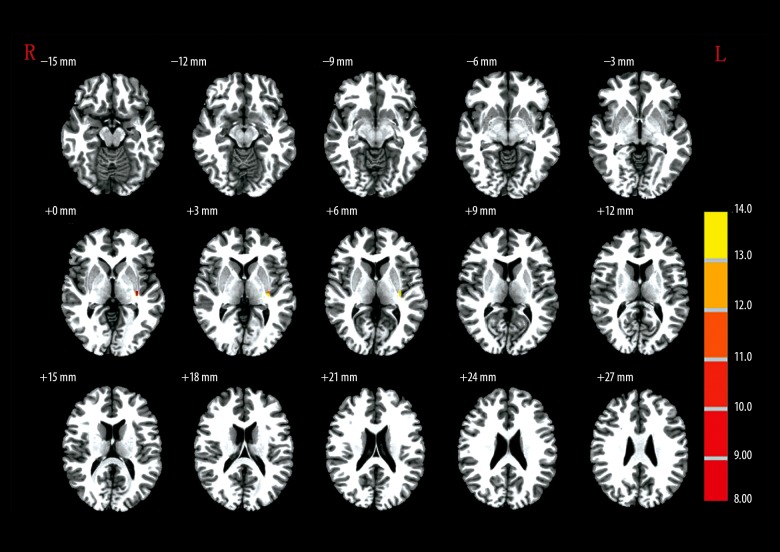
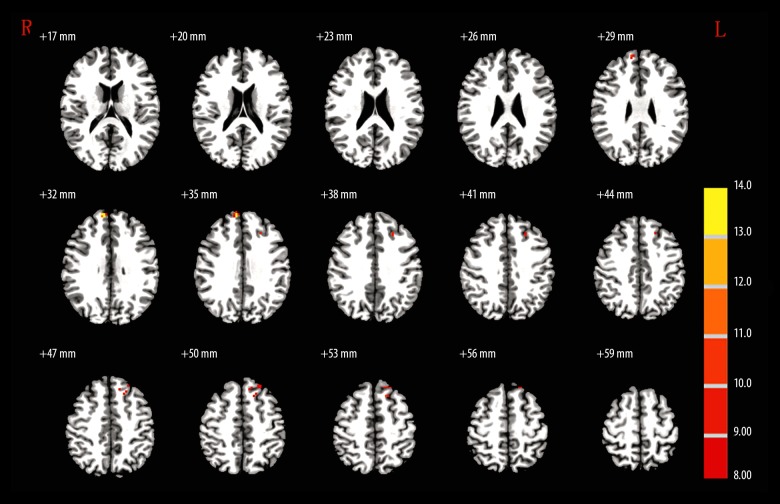
When the R-HPC was set as the seed region, MAP patients showed no significant difference from the controls (Table 4, Figure 3). When the L-MSFG was set as the seed region, L-SFG/MFG and L-SFG were significantly higher GMD in controls compared with the MAP group (Table 4, Figure 4). When R-ANG region was set as the seed, MAP patients showed significantly lower GMD in R-ITG compared with the control group (Table 4, Figure 5). When the R-MFG/SFG was set as the seed region, MAP patients showed significantly lower GMD within L-PC and L-ANG regions but higher GMD within R-MFG, L-opr-IFG, and L-MFG regions than control volunteers (Table 4, Figure 6). High GMD suggests strong FC with the seed region within the brain. In the SCZ group, there were strong FCs between the R-HPC seed region and the left insula (L-INS) (Figure 3, Table 4) between LM-SFG seed and the R-MSFG (Figure 4, Table 4), the L-SFG/MFG and the left superior frontal gyrus (L-SFG), between the R-ANG seed region and the right inferior temporal gyrus (R-ITG) (Figure 5, Table 4), and between the R-MFG/SFG seed region and the right thalamus (R-THL), left precuneus (L-PC), R-MFG, L-opr-IFG, left middle frontal gyrus (L-MFG), and L-ANG regions (Figure 6, Table 4). MAP patients showed significantly weaker FC with R-HPC seed region within the L-INS region than SCZ patients. MAP patients showed significantly stronger FCs with L-MSFG seed region within R-MSFG and L-SFG regions. There was no significantly different FC with R-ANG seed region within the R-ITG region. In addition, when R-MFG/SFG was set as the seed region, MAP patients had significantly stronger FC within the R-THL region than SCZ patients (Figure 6, Table 4).
Figure 3.
The brain regions that were distinct in the functional connectivity of right hippocampus (27, −18, −9) among MAP, SCZ, and control groups.
Figure 4.
The brain regions that were distinct in the functional connectivity of left medial superior frontal gyrus (−3, 63, 18) among MAP, SCZ and control groups.
Figure 5.
The brain regions that were distinct in the functional connectivity of right angular gyrus (39, −63, 48) among MAP, SCZ, and control groups.
Figure 6.
The brain regions that were distinct in the functional connectivity of right middle frontal gyrus/superior frontal gyrus (30, 30, 51) among MAP, SCZ, and control groups.
Correlation between ReHo or FC in abnormal regions and PANSS scores
A statistically significant correlation was found between the PANSS-positive scores and ReHo value in the L-orb-IFG (r=−0.505, P = 0.039) of the MAP patients. The ReHo value in the R-MFG was negatively correlated with the PANSS-negative scores (r=−0.522, P=0.038) of the SCZ patients. In addition, the abnormal FC in the R-MFG also showed a significant negative correlation with the PANSS scores (r=−0.483, P=0.049) in the MAP group (Figure 7).
Figure 7.
Correlation between ReHo values of left orbital inferior gyrus and PANSS-positive symptoms among MAP patients, correlation between ReHo values, and functional connectivity in right middle frontal gyrus and PANSS-negative symptoms among MAP patients.
Discussion
MAP is a type of substance abuse-associated psychosis among METH addicts. Power et al. revealed that the mean duration of premorbid exposure to MAP is 5.3 years after the abuse of METH [9]. In our studied groups, the average duration of premorbid exposure to MAP was 5 years. The top 3 synthetic drug-reduced mental disorders are psychotic disorders, mood disorders, and anxiety disorders, and their prevalences are 77.1%, 28.0%, and 39.7%, respectively [6]. MAP is easily misdiagnosed as SCZ. Only a few functional MR studies have investigated the alternation of brain structure and functional connectivity in MAP patients, and most research has focused on SCZ [10–12]. This study is the first to investigated the GMD differences of MAP individuals and compare the abnormal FCs between MAP and SCZ based on 4 seed ROIs.
We found increased GMD in B-AC, B-MSFG, and L-opr-IFG of the MAP group, while decreased GMD was found in the L-opr-IFG and R-MFG of the SCZ group. Although the symptoms of the 2 diseases are quite similar [13], it is interesting that their GMD exhibited opposite trends in the present study. Our result is contradictory to studies that investigated the role of gray matter volumetric alternations in psychiatric disorders [2,14]. To be specific, many studies reported that gray matter volume is significantly smaller in MAP individuals than in healthy controls [2,15]. The difference may be due to the fact that the altered brain regions are different.
Moreover, increased ReHo was found in L-orb-IFG and R-HPC of the MAP group, and decreased ReHo was found in L-MSFT, R-ANG, and R-MFG/SFG in MAP patients. For the SCZ group, the ReHo value in the R-HPC, L-LTN, and L-TRP/opr-IFG increased, and it decreased in the L-SFG, R-STG, R-PC, R-ANZ, R-MFG/SFG, and R-SFG. There were significant differences between MAP and SCZ groups regarding R-STG, R-PC, R-SFG, L-LTN, and L-TRP/opr-IFG. We also found a negative correlation between the mean ReHo of the R-orb-IFG and the PANSS-positive scores, as well as between the mean ReHo of the R-SFG and the PANSS-negative scores among MAP patients. Certain results agree with a previous study reporting that SCZ patients had decreased ReHo in the STG compared with the control subjects [12]. As the ReHo method is sensitive in detecting the brain alternations of SCZ [16], it was suggested that MAP and SCZ indeed could cause distinct structural and functional changes.
When R-HPC or R-ANZ was selected as the seed ROI, the changed strength of whole-brain FC was similar between SCZ and MAP groups. However, abnormal FC was found in the SCZ group but not in the MAP group, when the L-MSFG or R-MFG/SFG was considered as the seed, indicating that abnormal FC in SCZ was quite specific. Furthermore, the abnormal FC of the R-MFG in MAP was found to be negatively correlated with PANSS scores, which also suggests the specificity of abnormal FC in MAP.
Overall, 3 features of MAP and SCZ were different – the increased GMD, the altered ReHo in the L-orb-IFG, and the negative correlation between the abnormal FC with the R-MFG and the PANSS scores – but this conclusion warrants further exploration with a more rigorous study design. The present study was also limited in that the duration of exposure was unknown in both patient groups, and female METH addicts were excluded. Moreover, the MNI coordinate may be a potential disturbance for this study, because the template was constructed based on a white population, which might not be applicable for the Chinese subjects in the present study. In addition, another limitation of our study is a relatively small number of participants examined. Although the study data are not sufficient to fully substantiate the results, they provide some valuable evidence for the intensive study of neurophysiological mechanism underlying MAP and help lay a foundation for further study.
Conclusions
The present study investigated the GMD changes and rs-fMRI changes of MAP, which provides evidence of the neurophysiological mechanisms underlying MAP.
Footnotes
Conflict of Interest
None.
Source of support: Departmental sources
References
- 1.Sun HQ, Bao YP, Zhou SJ, et al. The new pattern of drug abuse in China. Curr Opin Psychiatry. 2014;27:251–55. doi: 10.1097/YCO.0000000000000073. [DOI] [PubMed] [Google Scholar]
- 2.Aoki Y, Orikabe L, Takayanagi Y, et al. Volume reductions in frontopolar and left perisylvian cortices in methamphetamine induced psychosis. Schizophr Res. 2013;147:355–61. doi: 10.1016/j.schres.2013.04.029. [DOI] [PubMed] [Google Scholar]
- 3.Akiyama K. Longitudinal clinical course following pharmacological treatment of methamphetamine psychosis which persists after long-term abstinence. Ann NY Acad Sci. 2006;1074:125–34. doi: 10.1196/annals.1369.012. [DOI] [PubMed] [Google Scholar]
- 4.Ujike H, Sato M. Clinical features of sensitization to methamphetamine observed in patients with methamphetamine dependence and psychosis. Ann NY Acad Sci. 2004;1025:279–87. doi: 10.1196/annals.1316.035. [DOI] [PubMed] [Google Scholar]
- 5.Ipser JC, Uhlmann A, Taylor P, et al. Distinct intrinsic functional brain network abnormalities in methamphetamine-dependent patients with and without a history of psychosis. Addict Biol. 2016 doi: 10.1111/adb.12478. [Epub ahead of print] [DOI] [PubMed] [Google Scholar]
- 6.Zhang Y, Lu C, Zhang J, et al. Gender differences in abusers of amphetamine-type stimulants and ketamine in southwestern China. Addict Behav. 2013;38:1424–30. doi: 10.1016/j.addbeh.2012.06.024. [DOI] [PubMed] [Google Scholar]
- 7.Berman S, O’Neill J, Fears S, et al. Abuse of amphetamines and structural abnormalities in the brain. Ann NY Acad Sci. 2008;1141:195–220. doi: 10.1196/annals.1441.031. [DOI] [PMC free article] [PubMed] [Google Scholar]
- 8.Qiu Y, Lv X, Su H, et al. Reduced regional homogeneity in bilateral frontostriatal system relates to higher impulsivity behavior in codeine-containing cough syrups dependent individuals. PLoS One. 2013;8:e78738. doi: 10.1371/journal.pone.0078738. [DOI] [PMC free article] [PubMed] [Google Scholar]
- 9.Power BD, Stefanis NC, Dragovic M, et al. Age at initiation of amphetamine use and age at onset of psychosis: The Australian Survey of High Impact Psychosis. Schizophr Res. 2014;152:300–2. doi: 10.1016/j.schres.2013.11.003. [DOI] [PubMed] [Google Scholar]
- 10.Jiang S, Zhou B, Liao Y, et al. [Primary study of resting state functional magnetic resonance imaging in early onset schizophrenia using ReHo]. Zhong Nan Da Xue Xue Bao Yi Xue Ban. 2010;35:947–51. doi: 10.3969/j.issn.1672-7347.2010.09.008. [in Chinese] [DOI] [PubMed] [Google Scholar]
- 11.Garcia-Andrade J, Ramirez V, Lopez A, Vera P. Mediated plastid RNA editing in plant immunity. PLoS Pathog. 2013;9:e1003713. doi: 10.1371/journal.ppat.1003713. [DOI] [PMC free article] [PubMed] [Google Scholar]
- 12.Chen J, Xu Y, Zhang K, et al. Comparative study of regional homogeneity in schizophrenia and major depressive disorder. Am J Med Genet B Neuropsychiatr Genet. 2013;162B:36–43. doi: 10.1002/ajmg.b.32116. [DOI] [PubMed] [Google Scholar]
- 13.Shelly J, Uhlmann A, Sinclair H, et al. First-rank symptoms in methamphetamine psychosis and schizophrenia. Psychopathology. 2016;49:429–35. doi: 10.1159/000452476. [DOI] [PubMed] [Google Scholar]
- 14.Willi TS, Lang DJ, Honer WG, et al. Subcortical grey matter alterations in cocaine dependent individuals with substance-induced psychosis compared to non-psychotic cocaine users. Schizophr Res. 2016;176:158–63. doi: 10.1016/j.schres.2016.08.001. [DOI] [PubMed] [Google Scholar]
- 15.Orikabe L, Yamasue H, Inoue H, et al. Reduced amygdala and hippocampal volumes in patients with methamphetamine psychosis. Schizophr Res. 2011;132:183–89. doi: 10.1016/j.schres.2011.07.006. [DOI] [PubMed] [Google Scholar]
- 16.Yu R, Hsieh MH, Wang HL, et al. Frequency dependent alterations in regional homogeneity of baseline brain activity in schizophrenia. PLoS One. 2013;8:e57516. doi: 10.1371/journal.pone.0057516. [DOI] [PMC free article] [PubMed] [Google Scholar]


