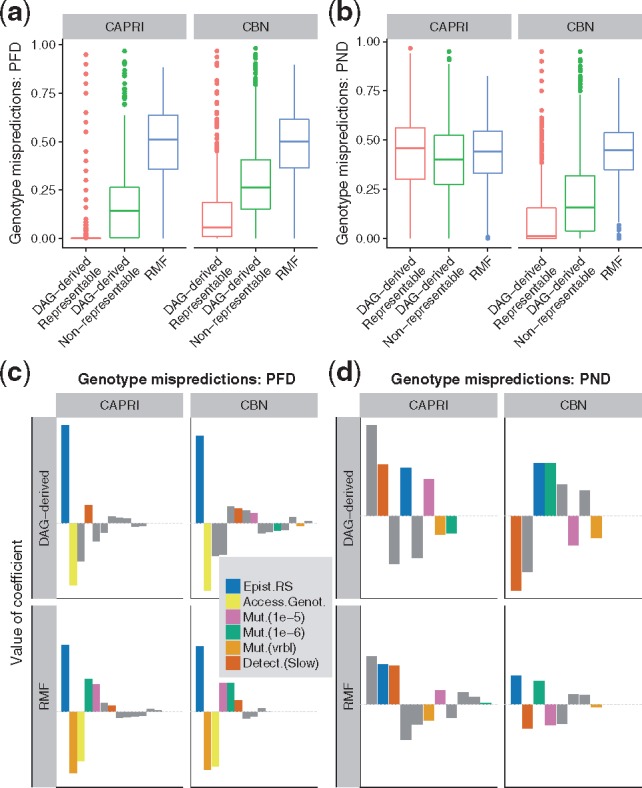
Fig. 2.

Genotype mispredictions: PFD and PND. (a, b) Boxplots of PFD and PND by method and type of fitness landscape. (c, d) Coefficients from linear mixed-effects models, with separate models fitted for each combination of method and type of fitness landscape. Within each panel, coefficients have been ordered from left to right according to decreasing absolute value of coefficient. The dotted horizontal gray line indicates 0 (i.e. no effect). Only coefficients that correspond to a term with a P-value <0.05 in Type II F (ANOVA) tests are shown. Coefficients involving landscape type “DAG-derived” and detection fast are not shown (they are minus the corresponding coefficient shown for the other value of the factor—see Section 2). Coefficients that correspond to main effects color coded as shown in the legend; the rest of the coefficients (“Other”) correspond to interaction terms; “Epist.RS”: fraction of pairs with reciprocal sign epistasis; “Mut.(vrbl)”: variable or gene-specific mutation
