Abstract
Interstellar (IS) dust analogs, based on amorphous hydrogenated carbon (a-C:H) were generated by plasma deposition in RF discharges of CH4 + He mixtures. The a-C:H samples were characterized by means of secondary electron microscopy (SEM), infrared (IR) spectroscopy and UV-visible reflectivity. DFT calculations of structure and IR spectra were also carried out. From the experimental data, atomic compositions were estimated. Both IR and reflectivity measurements led to similar high proportions (≈ 50%) of H atoms, but there was a significant discrepancy in the sp2/sp3 hybridization ratios of C atoms (sp2/sp3 = 1.5 from IR and 0.25 from reflectivity). Energetic processing of the samples with 5 keV electrons led to a decay of IR aliphatic bands and to a growth of aromatic bands, which is consistent with a dehydrogenation and graphitization of the samples. The decay of the CH aliphatic stretching band at 3.4 µm upon electron irradiation is relatively slow. Estimates based on the absorbed energy and on models of cosmic ray (CR) flux indicate that CR bombardment is not enough to justify the observed disappearance of this band in dense IS clouds.
1. Introduction
Interstellar (IS) dust is formed in the envelopes of asymptotic giant branch stars and in supernova explosions [1]. It is largely made of grains of silicates and of carbonaceous materials with variable sizes and compositions [2]. Most information on the nature of IS dust is derived from Infrared (IR) absorption spectra. Early observations of an absorption band at 3.4 µm (≈ 2950 cm-1) [3] and the subsequent comparison of this band with laboratory data suggested that hydrogenated amorphous carbon was a major component of dust in the diffuse interstellar medium (DIM) [4]. In contrast, in dense molecular clouds, the 3.4 µm band is not observed.
Hydrogenated amorphous carbon, usually abbreviated as a-C:H or HAC, refers to a group of carbonaceous solids with different proportions of sp2 and sp3 hybridized carbon atoms (Csp2, Csp3), and different C/H ratios. The properties of a-C:H can vary between those of diamond, graphite and polymeric hydrocarbons, and have deserved the attention of materials’ physicists over the last decades [5–8]. The actual nature of the a-C:H material in the dust grains of the DIM is not known with precision. Two competing models have been advanced. The first of these models assumes a structure formed by small aromatic islands linked by aliphatic chains, with possible olefinic contributions [9–11]. The other model assumes a larger graphitic structure, with small aliphatic contributions [12,13]. The abundant 3.4 μm band is mostly assigned to CH stretching vibrations of CH2 and CH3 aliphatic groups and is related to weaker absorptions at 6.8 and 7.3 μm corresponding to bending motions of the same functional groups which have also been observed in some cases. Given the uncertainty about the structure of the possible carbon carriers, estimates of the amount of elemental carbon contained in interstellar dust range from 5 to 30 % [9].
Analogs of IS carbonaceous grains have been built in the laboratory using various techniques and precursors [14] including laser ablation of graphite, laser pyrolysis of a precursor gas [15], UV irradiation of condensed hydrocarbons [9] or plasma enhanced chemical vapor deposition (PECVD) of gas phase hydrocarbons [16,17]. The latter technique has proven very useful to yield a-C:H samples with IR spectra giving a good match to astronomical observations. Whereas the mechanisms of formation of a-C:H in the laboratory are certainly different from those of dust formation in the interstellar medium, it is expected that solids with a similar structure can be formed in both cases. In space it is generally assumed that dust cores are formed in the ejecta of evolved stars and are then modified as they travel through the interstellar medium and interact with UV photons, cosmic rays and hydrogen atoms, but the detailed mechanisms are not known. Astronomical models assume that these processes give rise to solids with mixed aromatic and aliphatic structures, but as commented on in the previous paragraph there is no unanimity on the aliphatic/aromatic proportion or even in the preferential location (core or mantle) of aliphatic functional groups [12,18] Laboratory work is needed to help clarify these issues. In the laboratory, different sorts of a-C:H films can be formed through PECVD by varying the deposition conditions. In a previous work by our group [19] we discussed the different properties of two types of films deposited with different atom and radical flows and substrate temperatures. Here we have selected the deposition conditions that led to the best IS dust analog.
The formation and destruction of the aliphatic structures responsible for the interstellar 3.4 µm band has been attributed to the interaction of carbonaceous solids with hydrogen atoms, UV photons and cosmic rays (CRs) [2,12]. Laboratory studies have shown that UV photons and highly energetic particles (analogs of CRs) lead to dehydrogenation and graphitization of dust analogs [20–24], whereas interaction with H atoms reconstructs aliphatic structures [25]. In the DIM, the effects of the intense UV field prevail over those of CRs, but in denser regions, shielded from UV radiation, cosmic rays can become relevant. In this respect, experimental works by Mennella et al. [21] and by Godard et al. [22] led to different conclusions. The former group left open the possibility of a significant role of CRs for the destruction of the carriers of the 3.4 µm band, whereas the latter concluded that CRs were not relevant.
In previous studies by our group [19,26] we addressed the issues on the aliphatic/aromatic content of the predominant dust carriers of carbonaceous IS dust and on the effect of CRs on the carriers of the 3.4 µm band in dense clouds. Our results, based on a comparison with theoretical calculations [19] and on electron irradiation experiments [26] favored a predominant dust structure with a significant aliphatic content and corroborated the results of Godard at al. [22] on the irrelevance of CRs for the disappearance of the 3.4 µm band carriers in dense clouds.
In this work, we extend our previous investigation on the characterization and processing of IS dust analogs generated by glow discharges of CH4 containing mixtures. IR spectroscopy, secondary electron microscopy (SEM) and UV-visible reflection measurements are used to analyze the a-C:H deposits produced by PECVD. High energy electron bombardment of the deposited samples is used to simulate the effect of cosmic rays. The changes in the deposits induced by electron processing are studied using the above mentioned techniques, and astrophysical implications are reviewed.
2. Experimental
In an inductively coupled RF discharge, films of a-C:H of variable thickness, ranging from approximately 380 to 1540 nm, were deposited on IR transparent, low resistivity, Si substrates of 2.54 mm diameter and 1 mm thick. The discharge reactor consists of a Pyrex tube (30 cm length, 4 cm diameter) with a 10 turns Cu coil, placed externally around the central part of the tube and fed by a 13.56 MHz RF generator (Hüttinger PFG 300 RF + matchbox PFM 1500A) which was kept at a constant power of 40 W. The reactor was evacuated at one of the ends of the reactor by a rotary vacuum pump with a regulating valve down to background pressures of 5·10-3 mbar. The gas input was supplied at the other end. Mixtures of CH4 (5 sccm) and He (10 sccm) were introduced into the reactor up to a pressure of 0.3 mbar, measured by an absolute capacitance manometer. Typical residence times were ≈ 3 s. These deposition conditions had proven adequate to generate hydrogen-rich a-C:H samples with a significant aliphatic content, whose IR spectra were in good agreement with astronomical observations [19]. Under these conditions, CH4 dissociated in the plasma up to ≈ 90%, as determined by the mass spectra obtained with a differentially pumped quadrupole mass spectrometer (Hiden HAL 201 RGA). The Si substrates were supported on thin glass plates to prevent film deposition on the lower face of the substrates. The light intensity of a He-Ne laser reflected on the center of the samples and detected by a photodiode allowed to follow the periodic interference signal of the growing films and to make an in-situ first rough estimate of their thicknesses, which increased linearly with time. Depending on the final thickness, deposition times varied between 15 and 60 min.
Normal incidence IR transmission spectra of the deposited samples were then recorded ex-situ with a Bruker Vertex-70 FTIR spectrometer. The spectra were co-added from 300 runs at a nominal resolution of 4 cm-1. For the used plasma deposition conditions, the band shape of the IR spectra of the deposits was very repetitive and the integrated absorbance was proportional to the deposition time. IR interference fringes could be used to estimate the width of samples thicker than ≈ 800 nm. An uncertainty of ± 30 nm is estimated in these values. The geometrical width distributions of the films along their surfaces were also determined with an optical microscope used in quasi-normal incidence, coupled to a small visible spectrometer (Ocean QE65000). The oscillations in the visible spectra were employed even for the characterization of the thinner samples, with thickness uncertainties of ± 10 nm. For these estimations, both from the visible and IR measurements, the refractive index was assumed to be n=1.7 (see below). The thickness was found to be homogeneous over the central part of the disk and then decayed smoothly toward the edges (typically, down to ∼ 20-30% of the central thickness).
SEM microscopy was also used for the analysis of the samples. Some of the deposited substrates were fractured in order for SEM cross section images to be taken, including Si substrate and a-C:H film. From these images the film thickness could be measured too with an accuracy of ± 10 nm. The thickness values measured with the SEM images were in good agreement with the estimates from the He-Ne laser, and the visible and IR spectra.
The substrates were weighted with a high-precision microbalance before and after film deposition. From the increase in weight and the thickness profile of the films, a density of 1.1 ± 0.1 g cm-3 was estimated for our a-C:H samples.
Visible and UV reflectivity spectra of films were taken with the reflectance accessory of a CARY 5000 spectrophotometer with an integrating sphere. The samples were illuminated at 8 ° off-normal incidence. Most of the reflected light (>95%) comes from the specular component. The diffuse component has a low signal to noise ratio and is neglected in the analysis. From now on, we will refer to the specular reflectivity as the reflectivity of the sample.
For the study of energetic processing, the a-C:H samples were transferred to a high-vacuum chamber (see [17] for details of the set-up). The samples were placed in an appropriate Cu holder mounted in a rotatable flange. The viewing window of the Cu holder restricted the area for processing and observation to the central part of the sample, an inner circle of 1 cm diameter. During processing, the substrates were made to face alternatively the IR beam from a FTIR spectrometer or the electron beam from an electron gun inside the chamber. The samples were irradiated with a 7.9 × 10¹² electron cm-2 s-1 homogeneous flux of 5 keV electrons at normal incidence. At given time intervals, electron irradiation was interrupted and the sample was rotated to record IR transmission spectra at normal incidence. The chamber pressure during processing was ≈ 1 × 10⁻⁷ mbar. All the experiments were carried out at room temperature.
3. Results and Discussion
3.1. Theoretical simulations
As in previous investigations, we have developed different models to simulate a-C:H samples, working at Density Functional Theory (DFT) level of theory as implemented in the CASTEP code [27,28]. The electronic structure of the proposed analogs is determined within the Born-Oppenheimer approximation and this allows the calculation of a whole set of properties including molecular structure and spectra. As mentioned in the introduction, the published literature considers basically two types of models, with a different proportion of aromatic and aliphatic structures [9,13]. The relative extent of these structures, together with the H content, and its density, are the key parameters to describe the nature of the sample. Theoretical models allow studying many possibilities covering a range of values of these magnitudes.
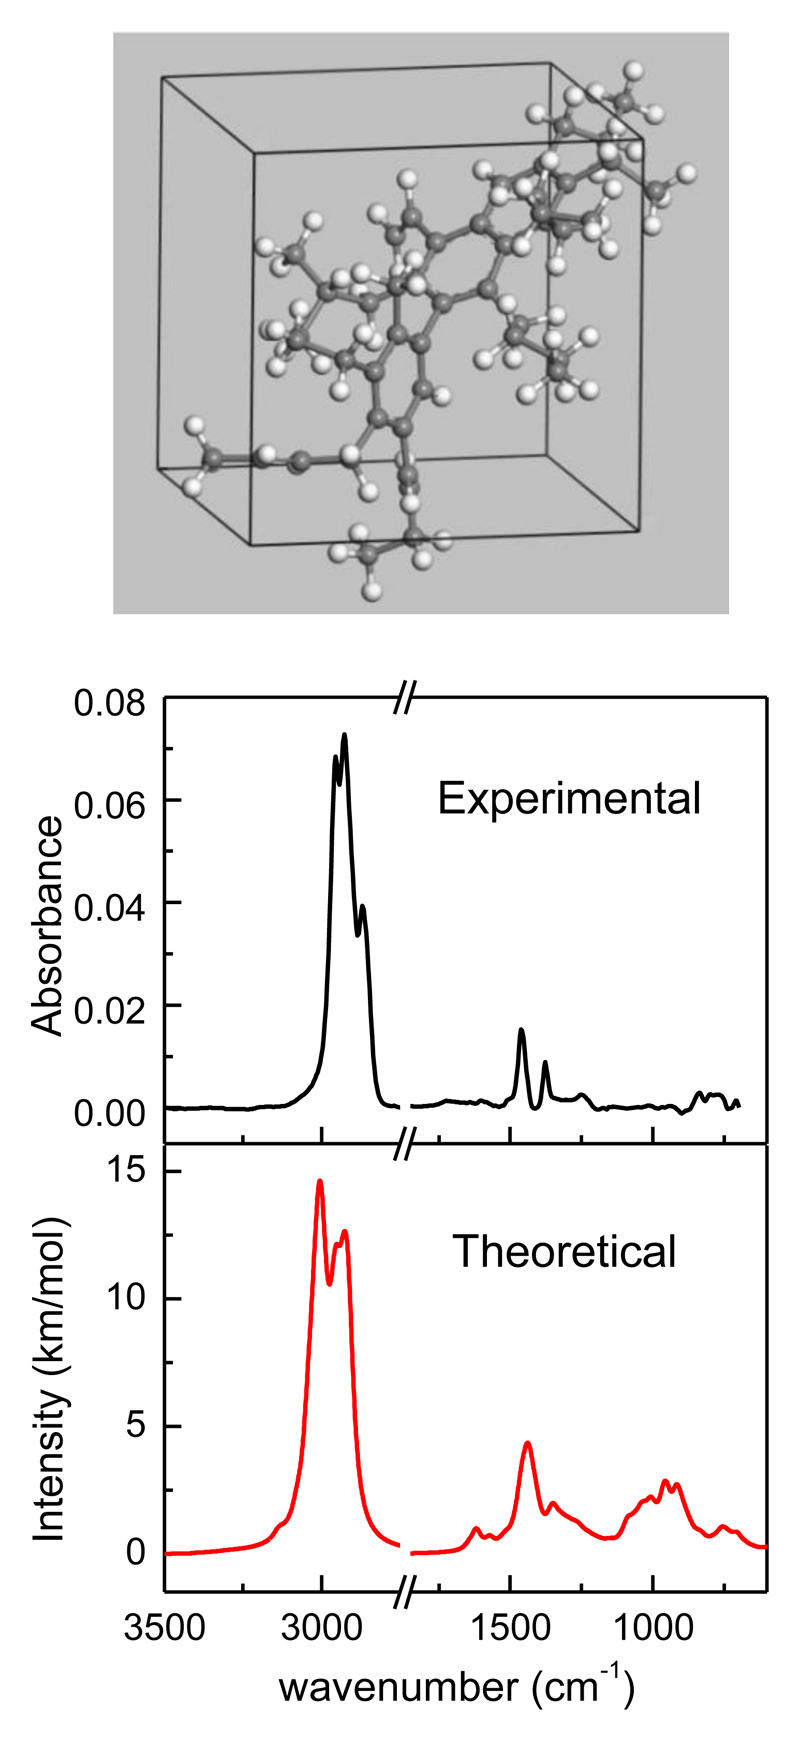
The quality of the models can be tested by comparing the predicted IR spectra with the laboratory observations. The two main spectral regions are that covering the C-H stretching modes, around 2950 cm-1, and those where C-C and C=C stretchings, plus CHn bendings appear, between 1000 and 1600 cm-1. Thus, the comparison between observation and prediction is not always easy, as different models yield predictions that sometimes reproduce better one spectral region and worse the other one. For the a-C:H samples produced in the present work, we have found the best agreement for structures based on that of Dartois et al. [9], consisting in a number of small aromatic rings linked by short aliphatic chains, with relative content of Csp3, Csp2 and H atoms of 0.23, 0.20 and 0.57, respectively. Reasonably good reproducibility of experimental spectra is achieved for structures with densities between 0.7 and 1.0 g cm-3, which are slightly smaller than that estimated for experimental a-C:H samples, 1.1 ± 0.1 g cm-3. The theoretical structure of density 0.7 g cm-3 is also calculated with the highest stability, in terms of the total energy of the system, whereas that energy increases by 0.60 eV for the sample of density 1.0 g cm-3.
We reproduce in figure 1 a schematic representation of the structure that we have developed based on the Dartois et al. model [9], in the upper panel, and a comparison of the corresponding predicted spectrum with one recorded in our laboratory for a typical a-C:H sample, in the lower one.
Figure 1.
Upper panel: approximate a-C:H structure for the predominant component of interstellar dust based on the model suggested by Dartois et al. [9] Lower panel: Comparison of the theoretical IR spectrum for the structure in the upper panel with that of a typical a-C:H sample (thickness ≈570 nm) deposited in the present work.
3.2. Plasma deposition and morphology
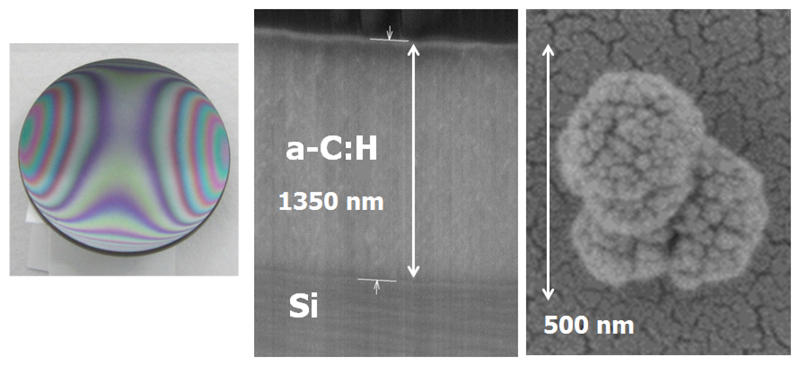
Polymerization leading to a-C:H formation in the laboratory plasmas takes place both at the exposed surfaces and in the gas-phase. In the first case, thin films are formed, and in the latter case, dust particles. Typical deposits are shown in figure 2. The decrease in the film thickness toward the edges of the substrate mentioned above gives rise to the interference fringes visible in the left panel. At the center of the samples, the films are highly homogenous in depth and have flat surfaces, as shown in the middle panel of the figure. This cross-section SEM micrograph, taken from a broken cleaved sample, allows also the measurement of the film thickness. A SEM planar view of an Au covered sample with dust particles is shown in the right panel. They have typically cauliflower shapes with diameters between 100 and 500 nm and are similar to the particles generated in dusty plasmas with hydrocarbon precursors [16]. Under our experimental conditions, the amount of dust particles formed is small and we will not consider them further in this work.
Figure 2.
Left panel: Photograph of an a-C:H sample deposited on a Si substrate. Central panel: SEM image of the cross section of a deposited a-C:H film. Right panel: SEM image (planar view) of dust particles generated in the gas-phase of the plasma and collected on the sample.
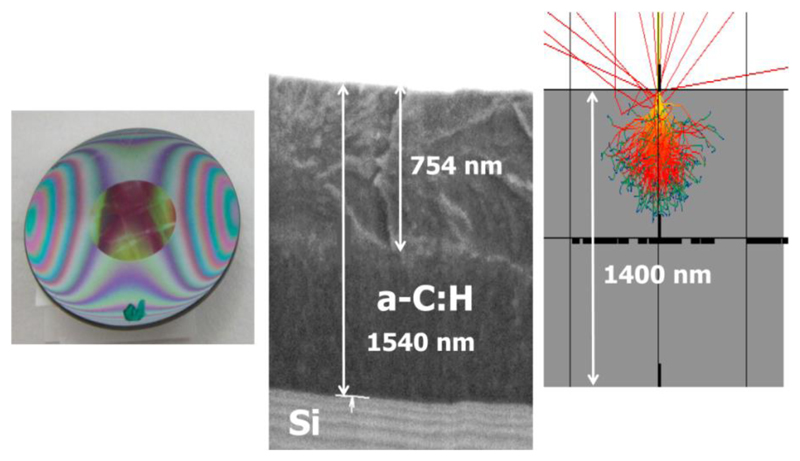
The effects of electron bombardment on the samples are shown in figure 3. In the left panel of the figure, the irradiated area, which is defined by the window of the sample holder, is clearly appreciable. It corresponds to the central and most homogenous part of the film. The cross section SEM view of an irradiated film and a simulation of the tracks of the bombarding electrons are shown in the middle and right panels, respectively. The penetration depth of the 5 keV electrons in the a-C:H samples was simulated using the Monte CArlo SImulations of electroN trajectories in sOlids (CASINO) code [29,30]. For the simulations, we have taken the measured density (1.1 g cm-3) and have assumed an H/C ratio of 1, in analogy with that of Godard et al. [22], who used also RF discharges of methane for the generation of their samples. These values are also consistent with the results of other authors for similar methane plasmas [31]. Samples of a-C:H with higher densities and lower hydrogen proportions can be formed using other deposition procedures [7,8,32]. They have higher densities than that of the present films and offer more resistance to electron penetration. For a density of 1.5 g cm-3 and (H/C) =0.3 the penetration depth estimated with CASINO is roughly 260 nm. The analysis of IR and reflectivity measurement in this work (see below) corroborate the approximate (H/C) = 1 proportion assumed for our films.
Figure 3.
Left panel: Photograph of an a-C:H sample after irradiation of its central part by 5 keV electrons (fluence 4.3 × 10¹⁷ electrons cm-2). Middle panel: SEM image of the cross section of an irradiated film. Right panel: CASINO simulation of the penetration of 5 keV electrons in the a-C:H region.
As shown in the upper part of the central panel, electron bombardment changes the morphology of the irradiated material. The electron penetration depth observed in the SEM image is approximately 750 nm for our experimental conditions. The penetration depth estimated with CASINO is somewhat (≈ 15%) smaller, but still gives a good approximation to the observations.
3.3. IR absorption measurements
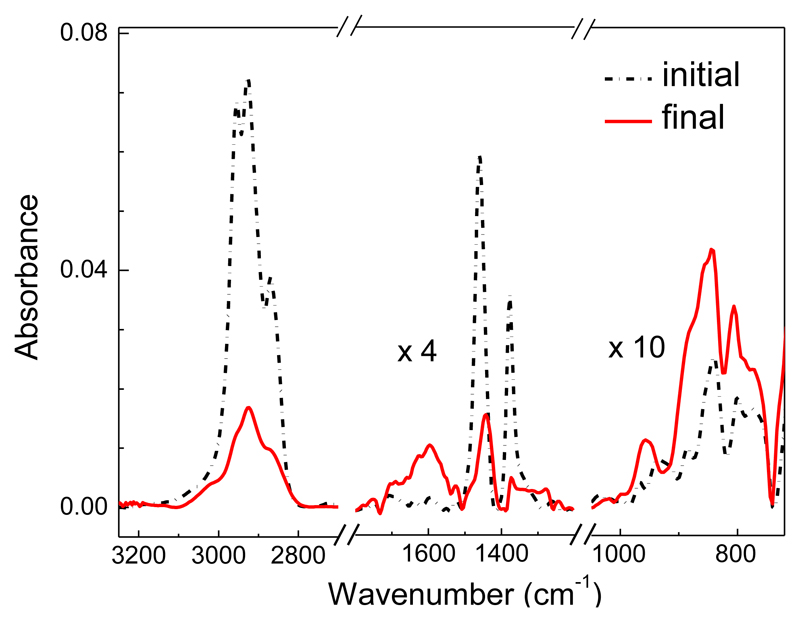
The changes in sample composition associated with the morphological changes just shown can be observed in the evolution of the IR spectra displayed in figure 4. They correspond to an irradiated a-C:H layer with a thickness of 570 nm, well below the electron penetration depth.
Figure 4.
Black dashed curve: IR spectrum of a-C:H before electron irradiation. Red curve: spectrum after electron irradiation (fluence 2 × 10¹⁷ electrons cm-2). The irradiated layer was ≈ 570 nm thick.
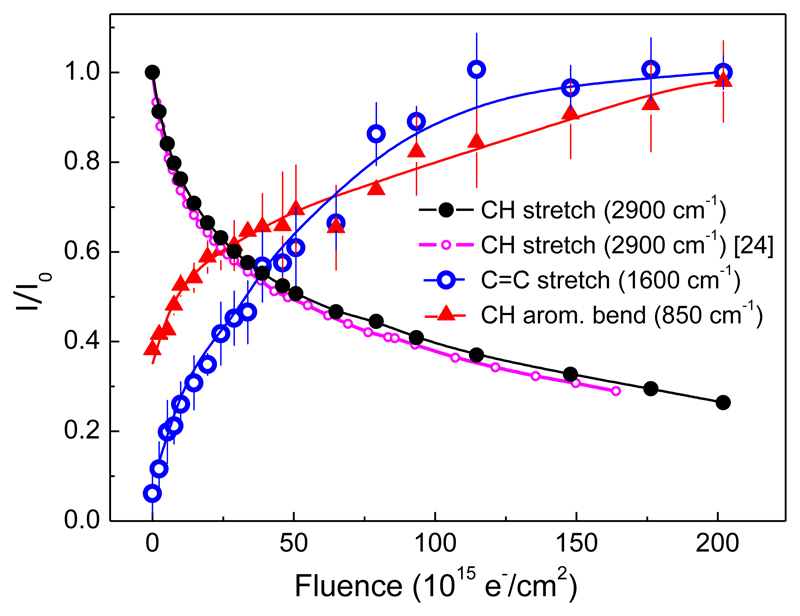
Three spectral regions are shown in this figure: a) the region of the CH stretching vibrations around 2950 cm-1 (i.e., the 3.4 μm band of astronomical observations), b) the region between 1700 and 1300 cm-1, which contains the C=C stretch vibrations of aromatic rings, as well as the bending motions of CH3 and CH2 aliphatic groups, and c) the 1000-700 cm-1 interval with the CH in- and out-of-plane aromatic bendings [33]. In a previous work by our group [26], we investigated the decrease of the aliphatic features and, in particular, of the intense aliphatic CH stretch band at 2950 cm-1 upon electron impact, but the signal to noise ratio was not good enough to draw firm conclusions on the evolution of the aromatic bands. At present, the instrumental noise has been appreciably reduced with respect to that of previous experiments with a more stable and effective dry air purge. With our improved experimental set-up, the neat growth of the aromatic bands at ≈ 1600 cm-1 and in the region between 1000 and 700 cm-1 is made evident. The evolution of the intensity of three characteristic bands with electron bombardment is shown in figure 5.
Figure 5.
Evolution of the integrated intensity of characteristic a-C:H bands upon electron irradiation. Black dots: CH stretching band (3100-2750 cm-1), small pink circles: CH stretching band from reference [26], blue circles, C=C aromatic stretching (1670-1500 cm-1), red triangles: aromatic CH bending vibrations (950-750 cm-1). The integrated intensities are normalized to 1 at the maximum. The lines are just to guide the eye.
The intensity of the CH stretching band shows a monotonic decrease with electron fluence (black closed circles). It is in very good agreement with our previous measurements [26] (small pink circles) which are also included in the figure. As discussed in that work, the decrease in the intensity of the CH stretching band can be successfully accounted for by a dehydrogenation model [34,35] originally developed to explain the hydrogen release observed upon ion irradiation of a-C:H. The model assumes that hydrogen leaves a-C:H in molecular form. When a CH bond is broken, the hydrogen atom diffuses within the solid, where it can recombine with another H atom to produce H2, or be trapped by a reactive site in the bulk material. Once formed, the H2 molecules are stable and diffuse out of the solid. Under continued irradiation, the H atom density drops to a point where recombination stops, when H atoms from broken CH bonds react at a solid active site before finding another H atom. The decrease of the aliphatic CH stretch band with increasing electron fluence is accompanied by a concomitant growth of the aromatic CC and CH bending bands. The increase in the intensity of these bands indicates that the electron bombardment not only destroys aliphatic groups through hydrogen depletion, but also induces the rearrangement of the carbon network into aromatic structures. The growth of the aromatic CH bending band (≈950-750 cm-1) indicates also that some of the H atoms from the break-up of aliphatic CH bonds end up reacting with C atoms of the newly created aromatic units. The creation of aromatic CH bonds is also corroborated by the appearance of a bump at the high wavenumber edge of the 2950 cm-1 band of the processed sample, which is attributable to the aromatic CH stretching vibration located at about 3050 cm-1.
The possibility of extracting structural information on a-C:H samples from IR spectra has been recently considered in the astrophysical community [10,12], where IR spectra constitute the main observational data on interstellar dust. To determine the relative content of Csp3, Csp2 and H atoms in a-C:H samples, the CH stretching band at ≈ 2950 cm-1 can be decomposed into various sub-bands associated with the aliphatic CH2 and CH3 groups and with aromatic CH. In addition, the C=C aromatic band at 1600 cm-1 can be used to estimate the contribution of polyaromatic networks to the global structure. Literature band strengths from known aliphatic and aromatic molecules can then be used for the evaluation of the sample composition. We have applied this band decomposition procedure to the a-C:H IR spectra using the band strengths values given by Chiar et al. [12] (see [19] for details of the method) and have derived the values listed in table 1, which reflect the dehydrogenation and growth of aromatic structures upon electron bombardment observed in the experiment.
Table 1.
Atomic composition of plasma generated a-C:H before and after energetic processing with 5 keV electrons (fluence ≈ 2.1 × 10¹⁷ e/cm2). The compositions were derived from the band analysis of IR spectra (see text and ref. [19]). The values listed correspond to the average of measurements performed on two fully irradiated layers of different thickness (380 and 570 nm, respectively).
| Composition from IR band profile decomposition | ||
|---|---|---|
| a-C:H as deposited by PECVD | a-C:H after electron bombardment | |
| C sp3 | 0.18 | 0.11 |
| C sp2 | 0.27 | 0.45 |
| H | 0.55 | 0.44 |
The composition of the unprocessed a-C.H is in reasonably good agreement with that of our previous work for similar deposition conditions [19] and with the theoretical calculations commented on above (see discussion of figure 1). However, the lack of precise band strengths and some ambiguity in the sub-bands assumed in the band profile decomposition for this type of materials limit the accuracy of the analysis based on IR spectra. In fact, a recent comparison with theoretical calculations by our group [19] suggests that the values derived with this method might be biased toward graphitic structures, due possibly to the fact that the literature values overestimate the band strength of the C=C stretching in a-C:H.
3.4. UV-Visible reflectivity measurements
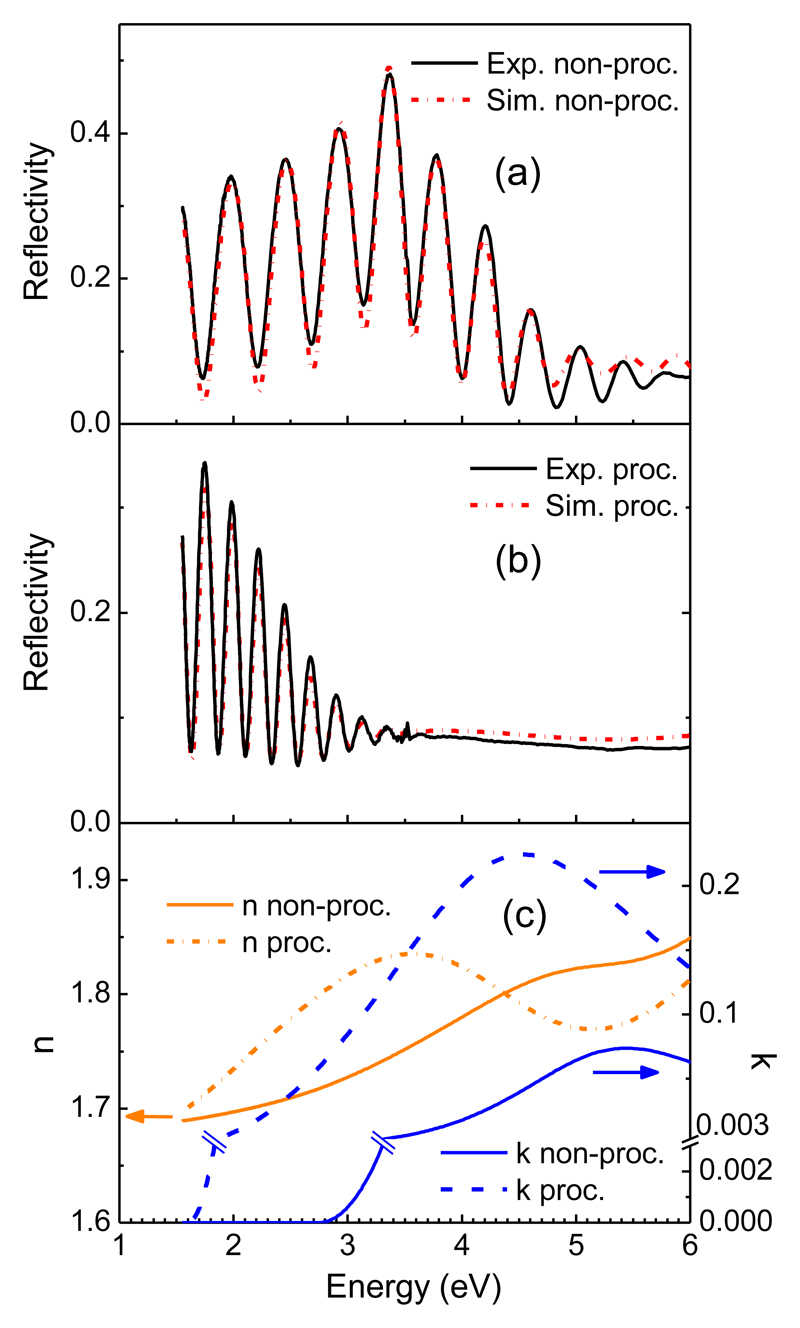
In an attempt to shed more light on this point, we have also estimated the atomic content of our samples using data from UV-visible reflectivity measurements. For these experiments we have used five samples with a-C:H layer thickness values between ≈ 380 and 1540 nm. As an illustration, we display in figure 6a the reflectivity spectrum of a non-irradiated a-C:H layer of 750 nm. The oscillations of the signal are due to interferences and indicate that the film is transparent in the visible region and that its thickness is comparable to the wavelength. The reflectivity spectrum was fitted by an optical multilayer model using WVASE software (WVASE32TM, J. A. Woollam Co. Inc.) to determine the optical indices. In this optical model the Si substrate, which is about 1 mm thick, can be treated as infinite. Therefore, this non-irradiated material can be described with a three-layer structure: air/ non processed a-C:H/Si.
Figure 6.
Reflectivity spectra and optical indices of a-C:H samples. (a) Experimental reflectivity spectrum and model simulation (see text) of (a) a 750 nm thick non-irradiated a-C:H and (b) a 1540 nm thick irradiated a-C:H layer (fluence, 4.3 × 10¹⁷ e cm-2). An image of the processed sample can be found in figure 3. (c) Optical indices derived from the optical model for all the studied samples. The Tauc gap energies are Eg=2.7 eV for unprocessed samples and Eg=1.6 eV for processed samples.
The optical properties of a-C:H are described by the combination of Cauchy and Tauc-Lorentz models. The first of these models describes the optical indices of dielectrics and the second is designed for the modeling of amorphous materials, whose absorption is practically zero below the optical band gap energy (Tauc gap), Eg. Further details about the models can be found in ref [36]. The simulated reflectivity spectrum, (red curve in Fig. 6a) is in very good agreement with the experimental one. The corresponding optical indices are shown in figure 6c as continuous lines. The refractive index, n, follows approximately Cauchy´s dispersion law. It takes values n=1.85 for E=6 eV and n=1.69 for E=1.5 eV. The extinction coefficient, k, reaches a maximum value of 0.074 for E= 5.3 eV, and becomes zero at the optical band gap energy (Eg=2.7 eV). For photon energies below this value, i.e. for photon wavelengths larger than 452 nm, which includes most of the visible, the material is transparent.
The reflectivity spectrum of an irradiated sample of 1540 nm is shown in figure 6b. It corresponds to the sample shown in the middle panel of figure 3. A comparison of figures 6a and 6b shows that the spectrum of the processed sample has a much higher absorption in the visible. In this case, the penetration depth of the electrons is lower than the layer thickness, and thus an interlayer of processed and non-processed material must be considered. To derive the simulated spectrum of figure 6b, a four-layer structure was used in the optical model (air/processed a-C:H/non processed a-C:H/Si). The optical indices of the processed material are described again with the mentioned Cauchy and Tauc-Lorentz models. The absorption (given by the k value) is much higher for the processed sample (k=0.22 at the maximum, 4.5 eV as compared with the k=0.073 value for unprocessed material). The band gap energy of the processed sample, Eg=1.6 eV, corresponds to photons of 775 nm. Most visible photons are thus absorbed by the sample as illustrated by the dark color observed for the irradiated area in figure 3. The optical indices in figure 6c give a good fit to the reflectivity spectra of the five a-C:H samples analyzed (not shown for brevity), both before and after electron processing. A decrease of the Tauc gap upon energetic processing was also observed in the work of Gadallah et al. [37], where a-C:H samples generated by laser ablation of graphite in a hydrogen atmosphere, were irradiated with UV photons.
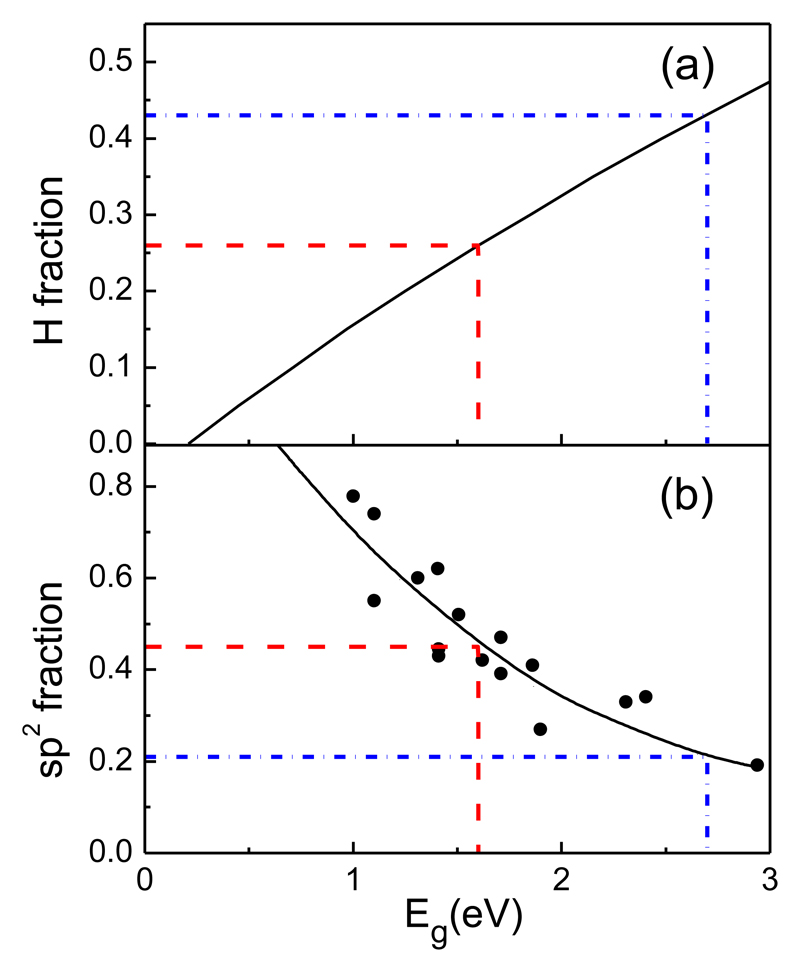
The relationship between the composition, structure and general properties of hydrogenated amorphous carbon has been thoroughly studied by Robertson and co-workers (see for instance [5,8,35] and references therein). From these studies, useful approximate correlations between the Tauc band gap and the contents of hydrogen or the carbon hybridization were derived. In figure 7, we have represented two of these correlations. The black solid line of figure 7a represents the correlation of the Tauc gap as a function of H content reported by Casiraghi et al. [38] from a very large set of measurements on a-C:H solids of very different compositions. Although a single curve is proposed to encompass all the data, it should be noted that the dispersion of data around this curve is large (see figure 7 of ref. [38]). In figure 7b, the points represent the experimental data gathered in ref. [8] for typical a-C:H solids obtained by PECVD, and the line has just been drawn through them. Note that, as expected, the band gap drops with growing sp2 fraction and with decreasing H atom content, as the material becomes more graphitic. We have used these correlations to estimate the approximate atomic compositions of our samples.
Figure 7.
Correlations between the band gap energy (Tauc gap) and the a-C:H atomic composition. The blue dash-dot line corresponds to the unprocessed samples of this work, the red dash line to the processed samples. (a) Black solid line: H fraction, H/(H+Csp3+Csp2), vs band gap energy, adapted from [38]. (b) Closed circles sp2 fraction, Csp2/(Csp2+Csp3) vs band gap energy, adapted from [8]. The black solid line has been drawn through the experimental data.
The results are summarized in Table 2. This analysis based on reflectivity measurements also shows that the atomic proportions change appreciably with electron irradiation. There is significant dehydrogenation and an increase in the proportion of Csp2 and, thus, a growth of aromatic structures in the solid.
Table 2.
Atomic composition of plasma generated a-C:H before and after energetic processing with 5 keV electrons. The compositions were estimated from the band gap values derived from the modelling of reflectivity spectra (see text) and the correlations given by Robertson and co-workers. The values listed correspond to the average of measurements performed on five samples with different thickness (between 380 and 1540 nm, respectively). The irradiation fluences varied between ≈ 2-2.2×10¹⁵ e/cm2 for samples with thickness < 1000 nm and ≈ 4.3-4.65×10¹⁷ e/cm2 for thicker samples.
| Composition from reflectivity measurements | ||
|---|---|---|
| a-C:H as deposited by PECVD | a-C:H after electron bombardment | |
| C sp3 | 0.44 | 0.41 |
| C sp2 | 0.11 | 0.33 |
| H | 0.45 | 0.26 |
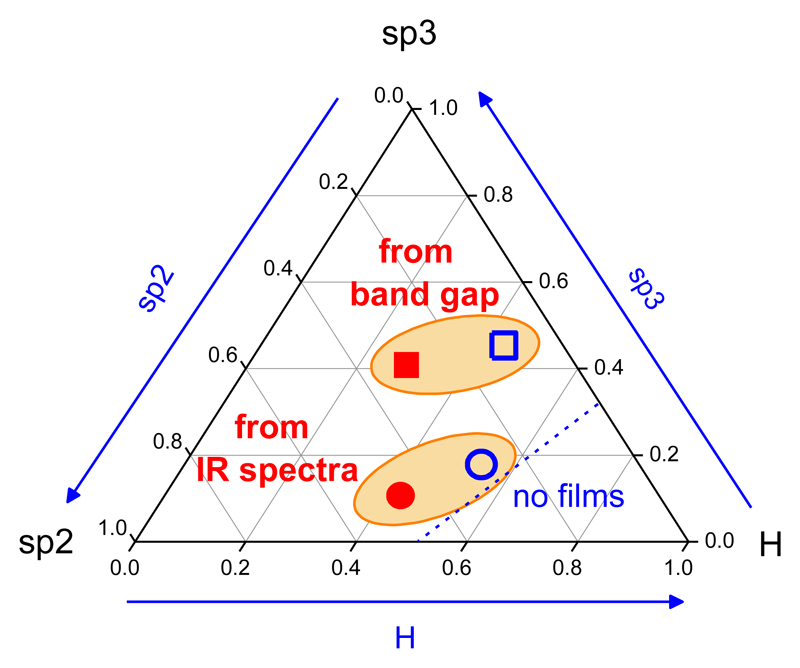
Although both IR and reflectivity measurements reflect qualitatively the same trend toward dehydrogenation and graphitization of the a-C:H solids upon energetic electron processing, the actual atomic compositions derived by the two methods before and after processing are rather different. This is best seen in the ternary diagram represented in figure 9. The two methods lead to hydrogen-rich (“polymer-like” [38]) a-C:H for the unprocessed samples, which tend to a-C:H films with intermediate H content after electron irradiation, but the proportion of sp3 bonding obtained from the reflectivity measurements and band gap correlations is much higher than that from the IR data. In a previous work [19] we concluded from a comparison between theoretical and measured IR spectra that the results of the IR estimates could be biased toward graphitic structures. The present discrepancy between estimates from IR and optical data points also in this direction. Composition estimates from Table 2 are probably more reliable and in better agreement with the range of values reported in the literature [7,8,32] for the type of a-C:H produced in our plasmas. However, one should also be cautious with the estimates from optical measurements because the atomic compositions derived with this method seem too “diamond-like” and are not in good agreement with the theoretical results commented on in the discussion of figure 1 and, besides, the band gap correlations in figure 7 are only approximate. Although the two experimental procedures and the theoretical estimates agree on the high proportion of hydrogen (45-55%) present in the a-C:H samples used as IS carbonaceous dust analogs, more work is needed to clarify the predominant bonding in the carbon network.
Figure 9.
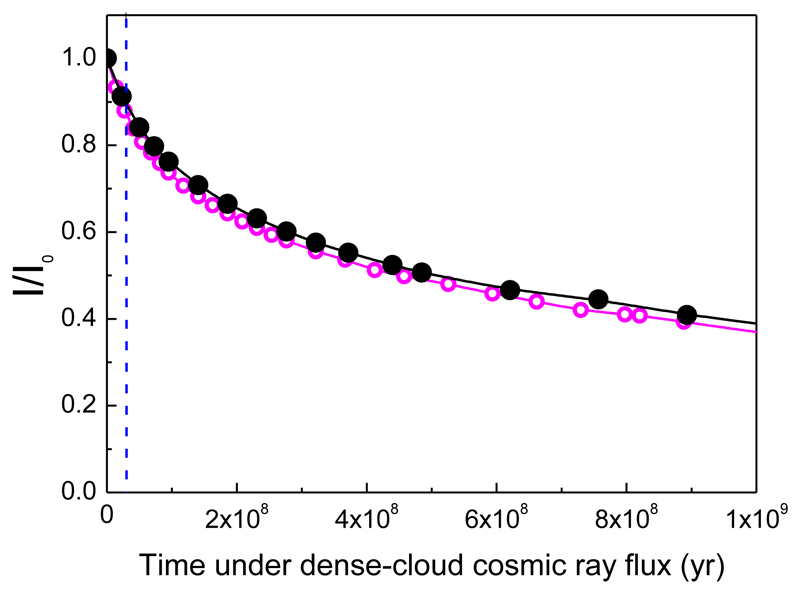
Decay of the CH stretching (3.4 μm) band intensity under the effect of cosmic rays for typical dense cloud conditions (see text). Black circles and line: present results. Pink circles and line: results from ref [26]. Blue dot line: typical lifetime of a dense cloud
4. Astrophysical implications
The energetic processing of a-C:H with high-energy electrons provides a means to estimate the effects of CRs on carbonaceous IS dust. Cosmic rays are mostly made of protons, but to a first approximation the effects of CRs on matter depend rather on the energy dose imparted than on the specific nature of the bombarding particles [39,40]. In a previous study we irradiated a-C:H with 5 keV electrons and concluded, in agreement with Goddard et al. [22] who used multiple ions with different energies, that CRs cannot account for the disappearance of the 3.4 μm band inside dense interstellar clouds. The present experiments corroborate our previous measurements (see figure 5) and therefore confirm the irrelevance of CRs for the destruction of the 3.4 μm band carriers, which are mostly aliphatic CHn groups. In the following, we review this conclusion using a different procedure for the estimation of characteristic times.
The amount of energy per unit time and unit mass deposited by CRs on carbonaceous grains inside dense clouds, RCR, can be expressed as:
| (1) |
Where Φ is the CR flux and S the stopping cross section of the material. We will make the usual assumption that the flux of multiple ions of variable energies in CRs can be approximated by an equivalent flux of 1 MeV protons. Inside dense clouds, this flux is assumed to be Φ = 1 photon cm-2 s-1 [21, 41]. The stopping cross section of our a-C:H dust analogs (ρ = 1 g cm-3, C/H=1) for 1 MeV protons is S (1 MeV) = 262 MeV cm2 g-1, as calculated with the SRIM (Stopping and Range of Ions in Matter) code [42]. This gives: RCR= 262 MeV g-1 s-1 = 8.26 × 10¹⁵ eV g-1 yr-1 for a-C:H gains in dense clouds. We can now use this value to scale the energy absorbed by the laboratory analogs under high-energy electron bombardment. At a given time, the energy per unit mass deposited by the electrons in the laboratory a-C:H layers, ΔE(t), can be expressed as:
| (2) |
Where, F(t) is the electron fluence at time t, and Se the stopping cross section of the a-C:H samples for 5 keV electrons. Calculations using the CASINO program mentioned above yield [26]: Se= 79 MeV cm2 g-1 s-1 for our dust analogs. We can now express the decay of the 3.4 μm band of a-C:H dust, due to CR bombardment inside a dense cloud, as a function of time. The dense-cloud time corresponding to a given fluence is given by:
| (3) |
The result of the fluence to time transformation is represented in Figure 9. With the CR energy dose expected for a dense cloud, the decay of the band to 50% of the initial intensity would take about 5 × 10⁸ years. However, the lifetime of a typical dense cloud, before collapsing to a protostar is estimated to be ≈3 ×10⁷ yr [22]. Over this period of time, the decrease in intensity is of the order of just 10% (see dotted line in figure 9). The present results show once more that CR irradiation cannot justify the observed disappearance of the CH band in dense clouds.
5. Summary and conclusions
Films of a-C:H were produced by PECVD of mixtures of CH4 + He in an inductively coupled RF discharge. The deposition conditions were selected to produce films whose IR spectra were in good agreement with astronomical observations of IS carbonaceous dust, in particular with the characteristic 3.4 μm band attributed mostly to CH stretching vibrations of CH2 and CH3 aliphatic groups.
The films were characterized using SEM, IR spectroscopy and UV-visible reflectivity measurements. DFT calculations of structures and IR spectra were also performed. The results of the analyses showed that the deposited films were homogeneous with flat surfaces and with a high proportion of hydrogen (≈ 50%) in their composition. The Csp2/Csp3 ratio based on IR spectroscopy is 1.5 whereas that from reflectivity measurements is 0.25. The discrepancy is large even considering the approximate nature of the estimates. The reasons for this discrepancy are not clear but probably lie in the assumptions, models and empirical correlations used for the interpretation of the measurements. More work is needed to clarify the carbon bonding structure in laboratory IS dust analogs.
Irradiation of the samples with 5 keV electrons leads to the destruction of aliphatic CHn groups (decay of the 3.4 μm band) and the formation of aromatic structures (growth of bands at 6.2 μm and 11-12 μm). The results are consistent with a dehydrogenation model which assumes that electron bombardment induces CH breaking and that most of the liberated H atoms form H2 molecules that diffuse out of the solid. Part of the H atoms however get trapped again at reactive sites and remain in the network. Some of these H atoms give rise to CH bonds at the edges of the newly formed aromatic structures as evidenced by the growth of a band at 11-12 μm which corresponds to aromatic CH bending vibrations.
The decay of the 3.4 μm band of a-C:H under high-energy electron bombardment is comparatively slow. Estimates based on the absorbed energy and on models of cosmic ray flux indicate that CRs cannot account for the observed disappearance of this band in dense interstellar clouds and corroborate thus the results from previous works [22,26].
Figure 8.
Ternary diagram for a-C:H with estimates of the atomic compositions of the a-C:H samples produced in this work. Open blue symbols, unprocessed deposits. Closed red symbols, processed samples (see Tables 1 and 2)
Aknowledgements
This work was funded by the Spanish MINECO under grants FIS2013-48087-C2-1P and FIS2016-77726-C3-1P. European Union funding under the project ERC-2013-Syg 610256 (NANOCOSMOS) is also acknowledged. The authors would like to thank R. Serna for useful discussions and support with the reflectivity measurements and WVASE program. Our skillful technicians M.A. Moreno, A. González and J. Rodríguez are also gratefully acknowledged.
Footnotes
Accepted Manuscript is “the version of the article accepted for publication including all changes made as a result of the peer review process, and which may also include the addition to the article by IOP Publishing of a header, an article ID, a cover sheet and/or an ‘Accepted Manuscript’ watermark, but excluding any other editing, typesetting or other changes made by IOP Publishing and/or its licensors”
References
- [1].van Dishoeck EF. Faraday Discuss. 2014;168:9–47. doi: 10.1039/c4fd00140k. [DOI] [PubMed] [Google Scholar]
- [2].Jones AP, Fanciullo L, Köhler M, Verstraete L, Guillet V, Bocchio M, Ysard N. Astron Astrophys. 2013;558:A62. [Google Scholar]
- [3].Duley WW, Williams DA. Mont Not R Astr Soc. 1983;205:67. [Google Scholar]
- [4].Jones AP, Duley WW, Williams DA. Q J R Astr Soc. 1990;31:567. [Google Scholar]
- [5].Robertson J. Adv Phys. 1986;33:317. [Google Scholar]
- [6].Angus JC, Jansen F. J Vac Sci Technol A. 1988;6:1778. [Google Scholar]
- [7].Jacob W. Thin solid films. 1998;326:1. [Google Scholar]
- [8].Robertson J. Mat Sci Eng R. 2002;37:129. [Google Scholar]
- [9].Dartois E, Muñoz-Caro GM, Deboffle D, Montagnac G, d´Hendecourt L. Astron Astrophys. 2005;432:895. [Google Scholar]
- [10].Dartois E, Geballe TR, Pino T, Cao AT, Jones A, Deboffle D, Guerrini G, Bréchingac P, d´Hendecourt L. Astron Astrophys. 2007;463:635. [Google Scholar]
- [11].Kwok S, Zhang Y. Astrophys J. 2013;771:5. [Google Scholar]
- [12].Chiar JE, Tielens AGGM, Adamson AJ, Ricca A. Astrophys J. 2013;770:78. [Google Scholar]
- [13].Steglich M, Jäger C, Huisken F, Friedrich M, Plass W, Räder HJ, Müllen K, Henning Th. Astrophys J Suppl Ser. 2013;208:26. [Google Scholar]
- [14].Pendleton YJ, Allamandola LJ. Astrophys J Suppl Ser. 2002;138:75. [Google Scholar]
- [15].Jäger C, Krasnokutsky S, Staicu A, Huisken F, Mutschke H, Henning Th, Poppitz W, Voicu I. Astrophys J Suppl Ser. 2006;166:557. [Google Scholar]
- [16].Kovacevic E, Stefanovic I, Berndt J, Pendleton YJ, Winter J. Astrophys J. 2005;623:242. [Google Scholar]
- [17].Maté B, Tanarro I, Moreno MA, Jiménez-Redondo M, Escribano R, Herrero VJ. Faraday Discuss. 2014;168:267. doi: 10.1039/c3fd00132f. [DOI] [PubMed] [Google Scholar]
- [18].Jones AP, Fanciullo L, Köhler M, Verstraete L, Guillet V, Bocchio M, Ysard N. Astron Astrophys. 2013;556:A62. [Google Scholar]
- [19].Molpeceres G, Timón V, Jiménez-Redondo M, Escribano R, Maté B, Tanarro I, Herrero VJ. Phys Chem Chem Phys. 2017;19:1352–1360. doi: 10.1039/c6cp06043a. [DOI] [PubMed] [Google Scholar]
- [20].Mennella V, Muñoz Caro GM, Ruiterkamp R, et al. Astron Astrophys. 2001;367:355. [Google Scholar]
- [21].Mennella V, Baratta GA, Esposito A, Ferini G, Pendleton YJ. Astrophys J. 2003;87:727. [Google Scholar]
- [22].Godard M, Féraud G, Chabot M, et al. Astron Astrophys. 2011;529:A146. [Google Scholar]
- [23].Gadallah KAK, Mutschke H, Jäger C. Astron Astrophys. 2012;544:A107. [Google Scholar]
- [24].Alata I, Cruz-Diaz GA, Muñoz Caro GM, Dartois E. Astron Astrophys. 2014;569:A119. [Google Scholar]
- [25].Mennella V, Brucato JR, Colangeli L, Palumbo P. Astrophys J. 2002;569:531. [Google Scholar]
- [26].Maté B, Molpeceres G, Jiménez-Redondo M, Tanarro I, Herrero VJ. Astrophys J. 2016;831:51. doi: 10.3847/0004-637X/831/1/51. [DOI] [PMC free article] [PubMed] [Google Scholar]
- [27].Clark SJ, Segall MD, Pickard CJ, Hasnip PJ, Probert MJ, Refson K, Payne MC. Z Krist. 2005;220:567–570. [Google Scholar]
- [28].Refson K, Tulip PR, Clark SJ. Phys Rev B: Condens Matter Mater Phys. 2006;73 155114. [Google Scholar]
- [29].Drouin D, Couture AR, Joly D, et al. Scanning. 2007;29:92. doi: 10.1002/sca.20000. [DOI] [PubMed] [Google Scholar]
- [30].Drouin D. 2011 http://www.gel.usherbrooke.ca/casino.
- [31].Schwarz-Selinger T, Von Keudell A, Jacob W. J Appl Phys. 1999;86:3988. [Google Scholar]
- [32].Robertson J. Surf Coat Tech. 1992;50:185. [Google Scholar]
- [33].Hudggins DM, Allamandola MJ. Astrophys J. 1999;516:141. doi: 10.1086/311989. [DOI] [PubMed] [Google Scholar]
- [34].Adel ME, Amir O, Kalish R, Feldman LC. J Appl Phys. 1989;66:3248. [Google Scholar]
- [35].Marée CHM, Vredenberg AM, Habraken FHPM. Mat Chem Phys. 1996;46:198. [Google Scholar]
- [36].Tompkins H, Eugene AI. Handbook of Elipsometry. Wiliam Andrews, Springer; 2005. [Google Scholar]
- [37].Gadallah KAK, Mutschke H, Jäger C. Astron Astrophys. 2011;528:A56. [Google Scholar]
- [38].Casiraghi C, Ferrari AC, Robertson J. Phys Rev B. 2005;72 085401. [Google Scholar]
- [39].Kaiser RI, Stockton AM, Kim YS, Jensen EC, Mathies ARA. Astrophys J. 2013;756:111. [Google Scholar]
- [40].Mason NJ, Nailr B, Jheeta S, Szimańska E. Faraday Discuss. 2014;168:235. doi: 10.1039/c4fd00004h. [DOI] [PubMed] [Google Scholar]
- [41].Moore MH, Hudson RL, Gerakines PA. Spechtrochim Acta A. 2001;57:843. doi: 10.1016/s1386-1425(00)00448-0. [DOI] [PubMed] [Google Scholar]
- [42].Ziegler FJ, Ziegler MD, Biersack JP. Nucl Instrum & Meth Phys Res B. 2010;268:1818. [Google Scholar]


