

ABSTRACT
In situ hybridization based on the mechanism of the hybridization chain reaction (HCR) has addressed multi-decade challenges that impeded imaging of mRNA expression in diverse organisms, offering a unique combination of multiplexing, quantitation, sensitivity, resolution and versatility. Here, with third-generation in situ HCR, we augment these capabilities using probes and amplifiers that combine to provide automatic background suppression throughout the protocol, ensuring that reagents will not generate amplified background even if they bind non-specifically within the sample. Automatic background suppression dramatically enhances performance and robustness, combining the benefits of a higher signal-to-background ratio with the convenience of using unoptimized probe sets for new targets and organisms. In situ HCR v3.0 enables three multiplexed quantitative analysis modes: (1) qHCR imaging – analog mRNA relative quantitation with subcellular resolution in the anatomical context of whole-mount vertebrate embryos; (2) qHCR flow cytometry – analog mRNA relative quantitation for high-throughput expression profiling of mammalian and bacterial cells; and (3) dHCR imaging – digital mRNA absolute quantitation via single-molecule imaging in thick autofluorescent samples.
KEY WORDS: Automatic background suppression, dHCR imaging, In situ HCR v3.0, Multiplexed quantitative in situ hybridization, qHCR flow cytometry, qHCR imaging
Highlighted Article: In situ hybridization chain reaction (HCR) v3.0 exploits automatic background suppression to enable multiplexed quantitative mRNA imaging and flow cytometry with dramatically enhanced performance and ease of use.
INTRODUCTION
HCR provides isothermal enzyme-free signal amplification in diverse technological settings in vitro, in situ and in vivo (Ikbal et al., 2015; Bi et al., 2017). Each HCR amplifier consists of two species of kinetically trapped DNA hairpins (H1 and H2; Fig. 1A) that co-exist metastably on lab time scales, storing the energy to drive a conditional self-assembly cascade upon exposure to a cognate DNA initiator sequence (I1) (Dirks and Pierce, 2004; Choi et al., 2014). Initiator I1 hybridizes to the input domain of hairpin H1, opening the hairpin to expose its output domain, which in turn hybridizes to the input domain of hairpin H2, exposing its output domain which is identical in sequence to initiator I1, thus providing the basis for a chain reaction of alternating H1 and H2 polymerization steps.
Fig. 1.

In situ HCR v3.0 using split-initiator probes. (A) HCR mechanism. Green stars denote fluorophores. Arrowhead indicates 3′ end of each strand. (B) Standard probes carry full HCR initiator I1 and generate amplified background if they bind non-specifically. Split-initiator probes P1 and P2 each carry half of HCR initiator I1 and do not generate amplified background if they bind non-specifically. (C) Two-stage in situ HCR protocol. Detection stage: probe sets hybridize to mRNA targets, unused probes are washed from the sample. Amplification stage: specifically bound probe pairs trigger self-assembly of a tethered fluorescent amplification polymer and unused hairpins are washed from the sample. Automatic background suppression throughout the protocol: any reagents that bind non-specifically do not lead to generation of amplified background. (D) Multiplexing timeline. The same two-stage protocol is used independent of the number of target mRNAs. HCR amplification is performed overnight for qHCR imaging and qHCR flow cytometry experiments (to maximize the signal-to-background ratio) and for 45-90 min for dHCR imaging experiments (to resolve individual molecules as diffraction-limited dots).
In the context of fluorescence in situ hybridization experiments, where the objective is to image mRNA expression patterns within fixed biological specimens, the role of HCR in situ amplification is to boost the signal above background autofluorescence inherent to the sample. Using in situ HCR v2.0, the initiator I1 is appended to DNA probes complementary to a target mRNA of interest, triggering the self-assembly of fluorophore-labeled H1 and H2 hairpins into tethered fluorescent amplification polymers (Choi et al., 2014, 2016; Shah et al., 2016a; Trivedi et al., 2018). In situ HCR v2.0 enables state-of-the-art mRNA imaging in challenging imaging settings (Choi et al., 2016), including whole-mount vertebrate embryos and thick tissue sections, offering three unique capabilities: straightforward multiplexing with simultaneous one-stage signal amplification for up to five targets (Choi et al., 2014), analog mRNA relative quantitation in an anatomical context (qHCR imaging) (Trivedi et al., 2018), digital mRNA absolute quantitation in an anatomical context (dHCR imaging) (Shah et al., 2016a).
Using in situ HCR v2.0, each target mRNA is detected using multiple probes each carrying a full HCR initiator I1 (Fig. 1B, left). If a probe binds non-specifically within the sample, initiator I1 will nonetheless trigger HCR, generating amplified background that decreases the signal-to-background ratio of the image. As a result, using in situ HCR v2.0, it is crucial to use probe sets that exclude probes that bind non-specifically, sometimes necessitating probe set optimization in which probes are tested individually to remove ‘bad probes’. To enhance robustness and eliminate the potential need for probe set optimization when exploring new targets, in situ HCR v3.0 employs probe and amplifier concepts that combine to achieve automatic background suppression throughout the protocol, ensuring that even if a reagent binds non-specifically within the sample, it will not lead to generation of amplified background.
Automatic background suppression is inherent to HCR hairpins because polymerization is conditional on the presence of the initiator I1; individual H1 or H2 hairpins that bind non-specifically in the sample do not trigger formation of an amplification polymer. Hence, the needed innovation is a probe concept that will generate initiator I1 conditionally upon detection of the target mRNA. In situ HCR v3.0 achieves this goal by replacing each standard probe carrying the full HCR initiator I1 (Fig. 1B, left) with a pair of cooperative split-initiator probes that each carry half of HCR initiator I1 (Fig. 1B, right). Probe pairs that hybridize specifically to their adjacent binding sites on the target mRNA colocalize the two halves of initiator I1, enabling cooperative initiation of HCR signal amplification. Meanwhile, any individual probes that bind non-specifically in the sample do not colocalize the two halves of initiator I1, do not trigger HCR and thus suppress generation of amplified background.
RESULTS
Validation of split-initiator HCR suppression in vitro and in situ
We first tested split-initiator HCR suppression in solution using gel studies to quantify conversion of HCR hairpins into HCR amplification polymers (Fig. 2). There is minimal leakage of hairpins H1 and H2 out of their kinetically trapped states in the absence of HCR initiator I1 (lane 1). This result demonstrates the automatic background suppression that HCR provides during the amplification stage of an in situ hybridization protocol: if a hairpin binds non-specifically in the sample, it does not trigger HCR and hence does not generate amplified background. As a positive control, we then verified that HCR initiator I1 triggers full conversion of HCR hairpins into amplification polymers (lane 2). If initiator I1 is carried by a standard probe, amplification polymers would represent either amplified signal or amplified background, depending on whether or not the probe is bound specifically to the target. It is this conceptual weakness that split-initiator probes seek to eliminate. Using a pair of split-initiator probes (P1 and P2) that each carry half of HCR initiator I1, we expect HCR to be triggered if, and only if, both P1 and P2 bind specifically to their adjacent binding sites on the target. Consistent with this expectation, we observe strong conversion of hairpins H1 and H2 into amplification polymer if P1 and P2 are both introduced with the target (lane 3), but minimal conversion into polymer if either P1 or P2 is introduced alone (lanes 4 and 5), reflecting the HCR suppression capabilities of split-initiator probes. Indeed, if the target is absent, even if P1 and P2 are present in solution together, we observe minimal conversion of hairpins into polymer (lane 6). These results indicate that replacement of a standard probe (v2.0) with a pair of split-initiator probes (v3.0) is expected to modestly decrease amplified signal (lane 2 versus lane 3) but to dramatically decrease amplified background (lane 2 versus lanes 4 and 5). Gel studies of five HCR amplifiers demonstrate typical HCR suppression of ≈60-fold (Figs 2, S3 and S4, lane 3 versus lanes 4 and 5) using split-initiator probes.
Fig. 2.

Test tube validation of split-initiator HCR suppression. (A) Agarose gel electrophoresis. Reaction conditions: hairpins H1 and H2 at 0.5 µM each (lanes 1-7); initiator I1, probes P1 and P2 (each carrying half of initiator I1; Fig. 1B), and/or DNA target at 5 nM each (lanes noted on the gel); 5× SSCT buffer; overnight reaction at room temperature. Hairpins H1 and H2 were labeled with Alexa 647 fluorophore (green channel); a dsDNA 1 kb ladder was pre-stained with SYBR Gold (red channel). (B) Quantification of polymer bands in A. See Figs S3 and S4 for additional data.
We then measured split-initiator HCR suppression in situ by comparing the signal using full probe sets (i.e. both odd and even probes) versus partial probe sets that eliminate one probe from each pair (i.e. only odd probes or only even probes). For five HCR amplifiers, we observe typical HCR suppression of ≈50-fold (Table S9) using split-initiator probes in situ.
In situ validation of automatic background suppression with split-initiator probes in whole-mount chicken embryos
We next compared the performance of standard probes (v2.0) and split-initiator probes (v3.0) in whole-mount chicken embryos (Fig. 3), a representative challenging imaging setting where the sample is thick and autofluorescent. Using standard probes, as the probe set size is increased from 5 to 10 to 20 probes by adding untested probes to a previously validated set of 5 probes (Choi et al., 2016), the background increases dramatically (Fig. 3A, magenta) and the signal-to-background ratio decreases monotonically (Fig. 3B, magenta). Using split-initiator probe pairs that address nearly identical target subsequences, increasing the probe set size causes no measurable change in the background (Fig. 3A, orange) and the signal-to-background ratio increases monotonically (Fig. 3B, orange). Representative images using the largest of these unoptimized probe sets (20 standard probes or 20 split-initiator probe pairs) exhibit high background using standard probes and no visible background using split-initiator probes (Fig. 3C); corresponding pixel intensity histograms for regions of high expression (signal+background) and no or low expression (background) are overlapping using standard probes and non-overlapping using split-initiator probes (Fig. 3D). These data illustrate the significant benefit of automatic background suppression using split-initiator probes: even if there are non-specific probes in the probe set, they do not generate amplified background, so it is straightforward to increase the signal-to-background ratio simply by increasing the probe set size without probe set optimization.
Fig. 3.

In situ validation of automatic background suppression with split-initiator probes in whole-mount chicken embryos. (A) Fluorescent background and (B) signal-to-background ratio as probe set size is increased by adding unoptimized probes: total of 5, 10 or 20 standard probes (v2.0) versus 5, 10 or 20 split-initiator probe pairs (v3.0). Any standard probes that bind non-specifically will generate amplified background, necessitating probe set optimization; split-initiator probes eliminate the potential need for probe set optimization by providing automatic background suppression. (C) Confocal micrographs in the neural crest of fixed whole-mount chicken embryos. Unoptimized probe sets: 20 standard probes (left) or 20 split-initiator probe pairs (right). See Fig. S7 (top) for the optimized standard probe set (Choi et al., 2016) with five probes. (D) Pixel intensity histograms for background and signal plus background (pixels in the depicted regions of C): overlapping distributions using unoptimized standard probes; non-overlapping distributions using unoptimized split-initiator probes. Embryos fixed at stage HH11. Target mRNA is Sox10. See Figs S5-S11 and Tables S10-S14 for additional data.
This improved performance is not simply an increase in selectivity resulting from use of probes with a shorter target-binding site (50 nt for standard probes versus 25 nt for each split-initiator probe within a pair): if the split-initiator probe set with 20 probe pairs is modified so that one probe within each pair carries the full initiator I1 (with its partner carrying no initiator), the background increases by an order of magnitude (Fig. S9 and Table S12) and the signal-to-background ratio decreases by one to two orders of magnitude (Fig. S10 and Table S13).
Multiplexed mRNA imaging in whole-mount chicken embryos with large unoptimized split-initiator probe sets
To test the robustness of automatic background suppression, we performed a four-channel multiplexed experiment using large unoptimized split-initiator probe sets (v3.0) in the neural crest of whole-mount chicken embryos (Fig. 4). Three target mRNAs (EphA4, Sox10, Dmbx1) were each detected with 20 split-initiator probe pairs and one shorter target mRNA (FoxD3) was detected with 12 split-initiator probe pairs. We observed signal-to-background for each channel ranging from ∼27-59 without probe set optimization. This level of performance was achieved for all targets simultaneously in four-channel images using fluorophores that compete with lower autofluorescence (Alexa 647) as well as with higher autofluorescence (Alexa 488).
Fig. 4.

Multiplexed mRNA imaging in whole-mount chicken embryos with large unoptimized probe sets using in situ HCR v3.0. (A) Expression schematics for four target mRNAs in the head and neural crest: FoxD3, EphA4, Sox10 and Dmbx1. (B) Four-channel confocal micrograph. (C) Zoom of depicted region of B. (D) Four individual channels from C with signal-to-background ratio measurements (mean±s.e.m., n=3 embryos). Probe sets: 12-20 split-initiator probe pairs per target. Amplifiers: four orthogonal HCR amplifiers carrying spectrally distinct fluorophores. Embryo fixed at stage HH10. See Fig. S12 and Table S15 for additional data.
By comparison, we previously optimized standard probe sets (v2.0) for three target mRNAs (FoxD3, Msx1, Sox10) in the neural crest of whole-mount chicken embryos (Choi et al., 2016). Starting with 13-16 standard probes (each carrying two HCR initiators), we arrived at optimized probe sets of five to nine probes, achieving signal-to-background ratios of ∼5-8 (Choi et al., 2016). This represents good performance after an initial investment of labor to perform probe set optimization, but even optimized standard probe sets do not perform as well as unoptimized split-initiator probe sets. Split-initiator probes not only dramatically improve ease of use by removing the need for probe set optimization, they also dramatically increase the signal-to-background ratio, offering a win/win proposition over standard probes.
qHCR imaging: analog mRNA relative quantitation with subcellular resolution in an anatomical context
We have previously demonstrated that in situ HCR v2.0 overcomes the longstanding trade-off between RNA quantitation and anatomical context, using optimized standard HCR probe sets to perform analog mRNA relative quantitation (qHCR imaging) with subcellular resolution within whole-mount vertebrate embryos (Trivedi et al., 2018). Precision increases with probe set size (Trivedi et al., 2018), so the prospect of using large unoptimized split-initiator probe sets is highly appealing. To test mRNA relative quantitation with automatic background suppression, we redundantly detected target mRNAs using two split-initiator probe sets each triggering a different spectrally distinct HCR amplifier (Fig. 5AB). If HCR signal scales approximately linearly with the number of target mRNAs per voxel, a two-channel scatter plot of normalized voxel intensities will yield a tight linear distribution with approximately zero intercept. Conversely, observing a tight linear distribution with approximately zero intercept (Fig. 5C), we conclude that the HCR signal scales approximately linearly with the number of target mRNAs per imaging voxel, after first ruling out potential systematic crowding effects that could permit pairwise voxel intensities to slide undetected along the line (Figs S13 and S23). Using 20 unoptimized split-initiator probe pairs (v3.0) per channel, the observed accuracy (linearity with zero intercept) and precision (scatter around the line) are both excellent for subcellular 2.1×2.1×2.7 µm voxels within a whole-mount chicken embryo. Just as quantitative PCR (qPCR) enables analog mRNA relative quantitation in vitro (Gibson et al., 1996; Heid et al., 1996), qHCR imaging enables analog mRNA relative quantitation in situ.
Fig. 5.

qHCR imaging: analog mRNA relative quantitation with subcellular resolution in an anatomical context. (A) Two-channel redundant detection of target mRNA EphA4 in a whole-mount chicken embryo. The target is detected using two probe sets, each initiating an orthogonal spectrally distinct HCR amplifier (Ch1, Alexa 546; Ch2, Alexa 647). (B) Confocal microscopy: 0.2×0.2 µm pixels. Probe sets: 20 split-initiator probe pairs per channel; no probe set optimization. Embryo fixed at stage HH10. (C) High accuracy and precision for mRNA relative quantitation in an anatomical context. Highly correlated normalized signal (Pearson correlation coefficient, r) for subcellular 2.1×2.1×2.7 µm voxels in the selected regions of B. Accuracy: linearity with zero intercept. Precision: scatter around the line. See Figs S18 and S19 and Table S16 for additional data.
qHCR flow cytometry: analog mRNA relative quantitation for high-throughput expression profiling of human and bacterial cells
The accuracy, precision and resolution achieved using qHCR imaging suggest the potential for mRNA analog relative quantitation in high-throughput flow cytometry and cell-sorting studies. In this case, the instrument treats each cell as a voxel, with both signal and background integrated over the volume of the cell. Using qHCR flow cytometry with 10-18 split-initiator probe pairs per channel (v3.0), we observe high signal-to-background (Fig. 6A) and excellent accuracy and precision (Fig. 6B) for both human and bacterial cells. Multiplexed qHCR flow cytometry (Figs S27 and S28) will enable high-throughput expression profiling without the need for engineering reporter lines (e.g. for profiling stem cell heterogeneity or sorting bacterial species in heterogeneous environmental samples).
Fig. 6.

qHCR flow cytometry: analog mRNA relative quantitation for high-throughput analysis of human and bacterial cells. (A) High signal-to-background ratio for transgenic target mRNAs. Data are mean±s.e.m.; n=55,000 HEK cells (top), n=18,000 E. coli cells (bottom). Probe sets: 12 split-initiator probe pairs; no probe set optimization. (B) High accuracy and precision for high-throughput mRNA relative quantitation. Two-channel redundant detection of endogenous target mRNAs. Each target mRNA is detected using two probe sets, each initiating an orthogonal spectrally distinct HCR amplifier (Ch1, Alexa 488; Ch2, Alexa 594). Highly correlated normalized signal (Pearson correlation coefficient, r), n=20,000 HEK cells (top), n=3400 E. coli cells (bottom). Accuracy: linearity with zero intercept. Precision: scatter around the line. Probe sets: 10 split-initiator probe pairs per channel for GAPDH, 18 split-initiator probe pairs per channel for fusA; no probe set optimization. See Figs S20-S28 and Tables S17-S24 for additional data.
dHCR imaging: digital mRNA absolute quantitation in an anatomical context
We have previously shown that in situ HCR v2.0 achieves single-molecule sensitivity and resolution even in thick autofluorescent samples (e.g. 0.5 mm cleared adult mouse brain sections) (Shah et al., 2016a), providing a basis for digital mRNA absolute quantitation (dHCR imaging). For dHCR imaging, we employ large probe sets (to distinguish mRNAs bound by multiple probes from background) and short amplification times (to grow short amplification polymers and resolve individual mRNAs as diffraction-limited dots). Because it is impractical to optimize large probe sets, it is especially appealing to use split-initiator probe sets that offer automatic background suppression and require no optimization.
To validate dHCR imaging using split-initiator probes, we redundantly detected individual mRNA targets using two independent probe sets and HCR amplifiers. We then used dot detection methods from the computer vision community to automatically identify dots in each channel (supplementary information, section S1.4.6). As mRNA false-positive and false-negative rates for each channel go to zero, the colocalization fraction for each channel (fraction of dots in a given channel that are in both channels) will approach one from below. Using large unoptimized split-initiator probe sets (23-25 split-initiator probe pairs per channel), we observe colocalization fractions of ≈0.84 in cultured human cells and whole-mount chicken embryos (Fig. 7). These results improve significantly on the colocalization fractions of ≈0.50 observed in our previous dHCR imaging studies using unoptimized standard probe sets (39 standard probes per channel) in whole-mount zebrafish embryos (Fig. S31) (Shah et al., 2016a). Just as digital PCR (dPCR) enables digital mRNA absolute quantitation in vitro (Vogelstein and Kinzler, 1999; Sanders et al., 2013), dHCR imaging enables digital mRNA absolute quantitation in situ.
Fig. 7.
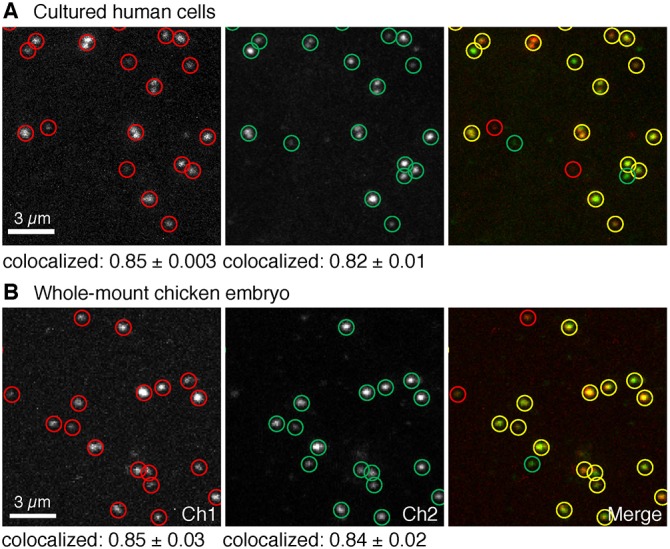
dHCR imaging: digital mRNA absolute quantitation in cultured human cells and whole-mount chicken embryos. (A) Redundant detection of target mRNA BRAF in HEK cells. Probe sets: 23 split-initiator probe pairs per channel; no probe set optimization. Pixel size: 0.06×0.06 µm. (B) Redundant detection of target mRNA Dmbx1 in whole-mount chicken embryos. Probe sets: 25 split-initiator probe pairs per channel; no probe set optimization. Pixel size: 0.1×0.1 µm. Embryos fixed at stage HH8. (A,B) Each target mRNA is detected using two probe sets, each initiating an orthogonal spectrally distinct HCR amplifier (Ch1, Alexa 647; Ch2, Alexa 546 for A; Ch1, Alexa 647; Ch2, Alexa 594 for B). Representative field of view from confocal micrographs. Red circles: dots detected in Ch1. Green circles: dots detected in Ch2. Yellow circles: dots detected in both channels. Colocalization represents the fraction of dots in one channel that are detected in both channels (mean±s.e.m., n=3 slides for A, n=3 embryos for B). See Figs S29-S31 and Tables S25-S27 for additional data.
DISCUSSION
Comparison of alternative probe schemes
To fully appreciate the automatic background suppression properties of split-initiator probes combined with HCR amplifiers, it is helpful to compare alternative concepts. Fig. 8 depicts five related in situ hybridization schemes. In a multistage scheme, we state that a method provides automatic background suppression during a given stage if non-specific binding of a reagent during that stage predominantly does not lead to generation of amplified background during subsequent stages. As the final stage of each scheme, signal amplification is performed using HCR. Because HCR hairpins are kinetically trapped and execute a conditional self-assembly cascade that is triggered by the HCR initiator, hairpins that bind non-specifically within the sample predominantly do not trigger growth of HCR amplification polymers. Hence, HCR provides automatic background suppression during the final stage of all five schemes. The challenge, then, is to devise a probe concept that maintains automatic background suppression during the earlier stages of the protocol.
Fig. 8.
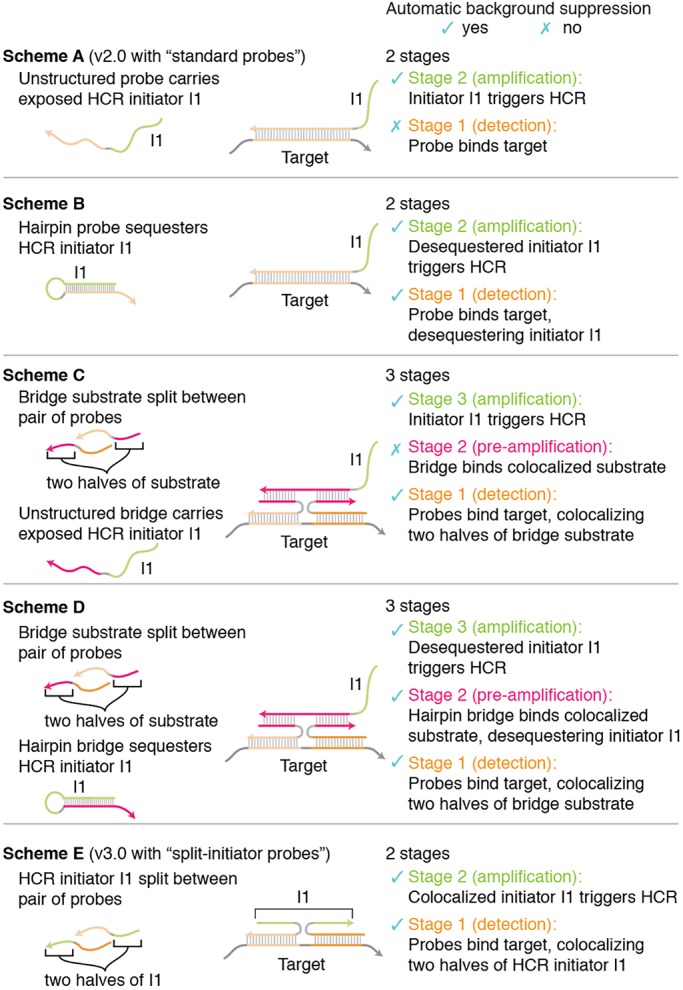
Comparison of probe concepts. Scheme A corresponds to in situ HCR v2.0 with standard probes. Scheme E corresponds to in situ HCR v3.0 with split-initiator probes. Scheme A is vulnerable to non-specific probe binding in stage 1, leading to amplified background in stage 2. Scheme B provides automatic background suppression throughout the protocol at the cost of introducing sequence dependence between the target and the HCR amplifier. Scheme C provides automatic background suppression in stage 1 but is vulnerable to non-specific bridge binding in stage 2, leading to amplified background in stage 3 [a weakness shared by the pre-amplification and amplification stages (stages 2 and 3) of four-stage bDNA methods (Wang et al., 2012)]. Scheme D provides automatic background suppression throughout the protocol at the cost of using a three-stage protocol. Scheme E offers all of the advantages and none of the disadvantages of schemes A-D, providing automatic background suppression throughout the protocol, avoiding sequence dependence between the HCR amplifier and the target mRNA, and employing a two-stage protocol. Arrowhead indicates the 3′ end of each strand.
To provide a starting point for discussion, scheme A depicts the standard probes used for in situ HCR v2.0 (Choi et al., 2014, 2016; Shah et al., 2016a; Trivedi et al., 2018). As previously noted, because each probe carries an exposed HCR initiator I1, this scheme has the drawback that non-specific probe binding in stage 1 will lead to generation of amplified background during stage 2.
Scheme B resolves this issue by using a hairpin probe that sequesters HCR initiator I1, exposing the initiator only upon hybridization to the target. As a result, probes that bind non-specifically during stage 1 predominantly do not generate amplified background during stage 2, ensuring automatic background suppression throughout the protocol. Unfortunately, suppressing background via conformation change of a hairpin probe imposes sequence dependence between the target and the HCR amplifier, which would necessitate use of a custom HCR amplifier for each new target.
To sidestep this sequence-dependence issue, scheme C uses colocalization instead of conformation change as an alternative principle for achieving automatic background suppression. During stage 1, the target is detected using a pair of probes that each carry half of a bridge substrate. Specific hybridization of the probes to the target molecule colocalizes the two halves of the bridge substrate. During stage 2, an unstructured bridge strand that carries exposed HCR initiator I1 is designed to bind stably to the colocalized substrate, but not to either half alone. Thus, non-specific binding of either probe during stage 1 predominantly will not generate amplified background during stage 2. The drawback to scheme C is that non-specific binding of the bridge strand during stage 2 will lead to generation of amplified background during stage 3. In essence, the unstructured bridge strand in scheme C has the same conceptual weakness as the unstructured probe in scheme A.
The principles, strengths and weaknesses underlying stages 1 and 2 of scheme C are similar to those of branched DNA methods (bDNA), which use a four-stage protocol (Wang et al., 2012): stage 1, target detection with a pair of probes each carrying half of a bridge substrate; stage 2, pre-amplification with an unstructured bridge strand that binds to a colocalized bridge substrate and carries multiple exposed amplifier substrates; stage 3, amplification with an unstructured amplifier strand that binds to an exposed amplifier substrate and carries multiple exposed label substrates; stage 4, signal generation with an unstructured label strand that binds to an exposed label substrate. This approach has the conceptual strength that non-specific binding of individual probes during stage 1 will predominantly not lead to generation of amplified background (as only bridge substrates colocalized by the target will mediate amplification), but also the conceptual weakness that non-specific binding of reagents in stages 2 or 3 will lead to generation of amplified background (as unstructured bridge strands carry exposed amplifier substrates and unstructured amplifier strands carry exposed label substrates). Hence, automatic background suppression is achieved in stage 1 based on the principle of colocalization, but then not maintained during stages 2 and 3 as a result of reliance on unstructured strands that carry exposed substrates for downstream reagents.
To achieve automatic background suppression throughout the protocol, scheme D improves on scheme C by replacing the unstructured bridge strand with a hairpin bridge that initially sequesters HCR initiator I1, exposing I1 only upon hybridizing to the colocalized bridge substrate. Automatic background suppression is achieved in stage 1 based on the principle of colocalization and then maintained during stage 2 based on the principle of conformation change. The drawback of scheme D is the increase in number of stages from 2 to 3.
As the final step in the derivation of split-initiator probes, scheme E simplifies scheme D by noting that the conformation-change property of the hairpin bridge is also a property of the HCR hairpins used for amplification. Therefore, with scheme E, we stipulate that the bridge substrate is an HCR initiator sequence, enabling HCR hairpins to bridge between colocalized probes and amplify the signal in a single stage. As a result, scheme E becomes a two-stage protocol.
Scheme E, which provides the basis for in situ HCR v3.0 in the current work, provides all of the benefits and none of the drawbacks of the other four schemes. First, we have the simplicity of a two-stage protocol (stage 1, detection; stage 2, amplification). Second, we have the flexibility of sequence independence between the target and the HCR amplifier, enabling use of a validated library of HCR amplifiers for new targets of interest. Third, we have the robustness of automatic background suppression throughout the protocol: at every stage during the protocol, non-specific binding of reagents will predominantly not lead to generation of amplified background.
Enhanced robustness and signal-to-background
Automatic background suppression using split-initiator probes has important consequences for both robustness and signal-to-background. Using standard probes, increasing the size of the probe set will reliably increase amplified signal but might increase amplified background even more, so use of a large v2.0 probe set can be a double-edged sword; probe set optimization is sometimes required to ensure that increasing probe set size does more good than harm. By contrast, using split-initiator probe sets, the signal-to-background ratio increases reliably with probe set size, so it is advantageous to use large v3.0 probe sets without optimization and achieve a high signal-to-background ratio on the first try. Even compared with optimized v2.0 probe sets, unoptimized v3.0 probe sets lead to a dramatically higher signal-to-background ratio, so performance improves even though we dispense with the extra effort of probe set optimization.
qHCR and dHCR quantitative imaging modes
In situ HCR enables two quantitative imaging modes in thick autofluorescent samples:
(1) qHCR imaging – analog mRNA relative quantitation with subcellular resolution; HCR signal is analog in the form of fluorescence voxel intensities that scale approximately linearly with the number of target molecules per voxel.
(2) dHCR imaging – digital mRNA absolute quantitation; HCR signal is digital in the form of diffraction-limited dots representing individual target molecules.
For qHCR imaging, we recommend using 20 split-initiator probe pairs per target and amplifying overnight. For dHCR imaging, we recommend maximizing the number of probe pairs per target (at least 25 probe pairs is preferred) and amplifying for 45-90 min. Because the qHCR signal per imaging voxel is quantitative, it will naturally decrease to zero as the number of targets per voxel decreases to zero; for sufficiently low expression, the signal will not be observable above autofluorescence. However, the dHCR signal per target molecule does not decrease with expression level. Hence, the qHCR and dHCR quantitative imaging modes are complementary, with qHCR suitable for medium- and high-copy targets (where the quantitative signal dominates autofluorescent background), and dHCR suitable for low-copy targets (where the signal from individual target molecules can be spatially separated). The same probe set can be used for either imaging mode, so imaging can be performed in qHCR mode (longer amplification time, lower magnification) or dHCR imaging mode (shorter amplification time, higher magnification) depending on the expression level observed in situ.
Quantitative read-out and read-in
The quantitative properties of in situ HCR enable gene expression queries in two directions (Trivedi et al., 2018): read-out from anatomical space to expression space to discover co-expression relationships in selected regions of the specimen; conversely, read-in from multidimensional expression space to anatomical space to discover those anatomical locations in which selected gene co-expression relationships occur. Quantitative read-out and read-in analyses provide the strengths of flow cytometry expression analyses, but by preserving anatomical context, they enable bi-directional queries that open a new era for in situ hybridization (Trivedi et al., 2018). In situ HCR v3.0 using large split-initiator probe sets enhances accuracy and precision for read-out/read-in using either qHCR relative quantitation (Trivedi et al., 2018) or dHCR absolute quantitation (Shah et al., 2016b).
In situ HCR resolves longstanding shortcomings of traditional CARD in situ amplification methods
Fluorescent in situ hybridization methods are used across the life sciences to image mRNA expression within fixed cells, tissues and organisms. In challenging imaging settings, including whole-mount vertebrate embryos and thick tissue sections, autofluorescence within the sample necessitates the use of in situ amplification to boost the signal-to-background ratio (Tautz and Pfeifle, 1989; Harland, 1991; Lehmann and Tautz, 1994; Kerstens et al., 1995; Nieto et al., 1996; Wiedorn et al., 1999; Player et al., 2001; Pernthaler et al., 2002; Denkers et al., 2004; Kosman et al., 2004; Larsson et al., 2004, 2010; Thisse et al., 2004; Zhou et al., 2004; Clay and Ramakrishnan, 2005; Barroso-Chinea et al., 2007; Acloque et al., 2008; Piette et al., 2008; Thisse and Thisse, 2008; Weiszmann et al., 2009; Wang et al., 2012). For decades, traditional in situ amplification approaches based on catalytic reporter deposition (CARD) have been the dominant approach for generating high signal-to-background in samples with high autofluorescence (Tautz and Pfeifle, 1989; Harland, 1991; Lehmann and Tautz, 1994; Kerstens et al., 1995; Nieto et al., 1996; Pernthaler et al., 2002; Denkers et al., 2004; Kosman et al., 2004; Thisse et al., 2004; Clay and Ramakrishnan, 2005; Barroso-Chinea et al., 2007; Acloque et al., 2008; Piette et al., 2008; Thisse and Thisse, 2008; Weiszmann et al., 2009) despite three significant drawbacks: multiplexing is cumbersome due to the need to perform signal amplification for one target mRNA at a time (Lehmann and Tautz, 1994; Nieto et al., 1996; Denkers et al., 2004; Kosman et al., 2004; Thisse et al., 2004; Clay and Ramakrishnan, 2005; Barroso-Chinea et al., 2007; Acloque et al., 2008; Piette et al., 2008); staining is qualitative rather than quantitative; and spatial resolution is routinely compromised by diffusion of reporter molecules prior to deposition (Tautz and Pfeifle, 1989; Thisse et al., 2004; Acloque et al., 2008; Piette et al., 2008; Thisse and Thisse, 2008; Weiszmann et al., 2009).
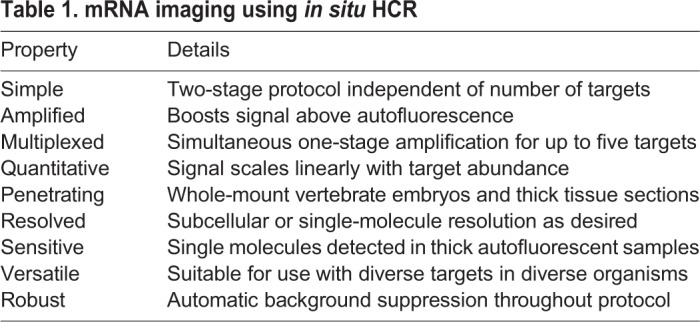
In situ HCR v2.0 overcame these longstanding difficulties, enabling multiplexed, quantitative, high-resolution imaging of mRNA expression with high signal-to-background in diverse organisms, including whole-mount vertebrate embryos (Choi et al., 2014, 2016; Trivedi et al., 2018). Orthogonal HCR amplifiers operate independently within the sample so the experimental timeline for multiplexed experiments is independent of the number of target mRNAs (Choi et al., 2010, 2014). The amplified HCR signal scales approximately linearly with the number of target molecules, enabling accurate and precise mRNA relative quantitation with subcellular resolution in the anatomical context of whole-mount vertebrate embryos (Trivedi et al., 2018). Amplification polymers remain tethered to their initiating probes, enabling imaging of mRNA expression with subcellular or single-molecule resolution as desired (Choi et al., 2014, 2016; Shah et al., 2016a). With split-initiator probes, in situ HCR v3.0 adds the performance and robustness benefits of automatic background suppression, providing biologists with an enhanced state-of-the-art research tool for the study of mRNA expression (Table 1).
Table 1.
mRNA imaging using in situ HCR
MATERIALS AND METHODS
Probe sets, amplifiers and buffers
For each target mRNA, a kit containing a DNA probe set, a DNA HCR amplifier, and hybridization, wash and amplification buffers was purchased from Molecular Technologies (moleculartechnologies.org), a non-profit academic resource within the Beckman Institute at Caltech. For gel studies, see Table S1 for sequence information. For in situ HCR studies, see Table S2 for a summary of sample, probe set and amplifier details, and Section S4 for probe sequences. Sequences for HCR amplifiers B1, B2, B3, B4 and B5 are given in Choi et al. (2014).
Gel electrophoresis
DNA HCR reactions for Fig. 2, Figs S3 and S4 were performed in 5× SSCT (5× SSC with 0.1% Tween 20). All hairpins were labeled with Alexa 647 (green channel). DNA hairpins were snap-cooled separately at 3 µM in hairpin storage buffer (Molecular Technologies). DNA initiators (I1), split-initiator probes (P1, P2), and target (Target) were diluted to 0.03 µM in 5× SSC. Each lane was prepared by mixing 0.8 µl of 5× SSC and 1.2 µl of 5× SSC with 1% Tween 20 and 2 µl of each hairpin. For the lanes with DNA oligos (I1, P1, P2 or Target), 2 µl of each oligo was added. An appropriate amount of 5× SSC was added to each lane to bring the reaction volume to 12 µl. The reactions were incubated at room temperature overnight. The samples were supplemented with 3 µl of 5× gel loading buffer (50% glycerol with Bromophenol Blue and xylene cyanol tracking dyes) and loaded into a native 1% agarose gel, prepared with 1× LB buffer (Faster Better Media). The gel was run at 150 V for 60 min at room temperature and imaged using an FLA-5100 fluorescent scanner (Fujifilm Life Science) with a 635 nm laser and a 665 nm long-pass filter. The 1 kb DNA ladder (red channel) was prestained with SYBR Gold (Invitrogen) and imaged using a 488 nm laser and a 575 nm long-pass filter. Multi Gauge software (Fuji Photo Film) was used to calculate the Alexa 647 intensity profile surrounding the polymer band for each lane (lanes 1-7 in Fig. 2, Figs S3, and S4). Each intensity profile is displayed for ±3 mm of gel migration distance with the peak value centered at 0; the intensity values are normalized so that the highest peak value for each gel is set to 1. Signal for each band was calculated using Multi Gauge with auto-detection of signal and background; the calculated percentages were normalized to the measured value with the full initiator (lane 2). Based on repeated analysis using Multi Gauge, the uncertainty in quantifying the bands in any given gel is estimated to be less than 0.1% of the band signal used for normalization.
In situ hybridization
In situ HCR v2.0 with standard probes was performed using the whole-mount chicken protocols of Choi et al. (2016). In situ HCR v3.0 with split-initiator probes was performed using the protocols detailed in section S2 of the supplementary material. Experiments were performed in Gallus gallus domesticus embryos (fertilized white leghorn chicken eggs from McIntyre Poultry & Fertile Eggs; fixed HH8, HH10 or HH11), human embryonic kidney (HEK) 293T cells (ATCC, # CRL-3216), HEK293 d2eGFP cells (a gift from C. L. Beisel, Caltech, Pasadena, CA, USA), E. coli K12 MG1655 (a gift from A. Z. Rosenthal, Caltech, Pasadena, CA, USA) or E. coli K12 MG1655 pUA66-sdhC expressing gfpmut2 (a gift from A. Z. Rosenthal). For signal amplification in analog qHCR mode (a high signal-to-background ratio with quantitative voxel intensities for imaging with subcellular resolution or high-throughput flow cytometry; e.g. Figs 3-6), amplification was performed overnight to generate long HCR amplification polymers. For signal amplification in digital dHCR mode (single-molecule sensitivity and resolution with individual target molecules resolved as diffraction-limited dots; e.g. Fig. 7), amplification was performed for 45-90 min to generate short HCR amplification polymers. See Table S2 for the amplification time for each experiment.
Confocal microscopy
A Zeiss LSM 710 inverted confocal microscope equipped with an LD C-Apochromat 40×/1.1 W Korr M27 objective was used to image whole-mount chicken embryos in Figs 3 and 5, Figs S5-S11,S14-S19. The same microscope equipped with an LD LCI Plan-Apochromat 25×/0.8 Imm Korr DIC M27 was used to image four-color whole-mount chicken embryos in Fig. 4 and Fig. S12. A Zeiss LSM 800 inverted confocal microscope equipped with a Plan-Apochromat 63×/1.4 Oil DIC M27 objective was used to image whole-mount chicken embryos in Fig. 7 and Fig. S30. The same microscope equipped with an alpha Plan-Apochromat 100×/1.46 Oil DIC (UV) M27 objective was used to image mammalian cells in Fig. 7 and Fig. S29. See Table S3 for a summary of excitation laser sources, beam splitters and tuned emission bandpass filters used for each experiment. All images are displayed without background subtraction. For dHCR imaging studies (e.g. Fig. 7), TetraSpeck Microspheres (0.2 µm, fluorescent blue/green/orange/dark red; Thermo Fisher Scientific, Cat. # T7280) were used as references for channel alignment. Images from two channels were registered using the Channel Alignment feature in ZEN Black software (Zeiss) and registration parameters were recorded for alignment of data imaged in dHCR 2-channel redundant detection experiments using identical imaging settings.
Flow cytometry
Prior to flow cytometry, cells were filtered through a 35 µm or a 40 µm mesh. Flow cytometry studies were performed using a MACSQuant VYB (Miltenyi Biotec). See Table S4 for a summary of excitation laser sources and filters used for each experiment. Flow cytometry data were gated using EasyFlow (Antebi et al., 2017) and plotted using MATLAB (Mathworks). For HEK cells, two gates were applied to data (e.g. Fig. S1): a first gate of forward scatter area (FSC-A) versus side scatter area (SSC-A) to select cells, and a second gate of FSC-A versus forward scatter height (FSC-H) to select single cells. Only cells satisfying both gates were used for the analysis. For E. coli cells, one gate of FSC-A versus SSC-A was applied to select cells (e.g. Fig. S2).
Image analysis
Image analysis was performed as detailed in section S1.4 of the supplementary material, including: definition of raw pixel intensities, measurement of signal, background and signal-to-background ratio, measurement of background components, measurement of split-initiator HCR suppression, calculation of normalized subcellular voxel intensities for qHCR imaging, and dot detection and colocalization for dHCR imaging (a dot detection and colocalization script is available for download at www.moleculartechnologies.org, including a user guide, sample images for testing the script, and sample output files).
Flow cytometry data analysis
Flow cytometry data analysis was performed as detailed in section S1.5 of the supplementary material, including: definition of raw cell intensities, measurement of signal, background and signal-to-background ratio, measurement of background components, measurement of split-initiator HCR suppression, and calculation of normalized single-cell intensities for qHCR flow cytometry.
Supplementary Material
Acknowledgements
We thank C. R. Calvert for assistance with test tube validation of split-initiator probes, C. L. Beisel for the gift of HEK d2eGFP cells, A. Z. Rosenthal for the gift of E. coli K12 MG1655 cells and E. coli K12 MG1655 pUA66-sdhC cells expressing gfpmut2, J. Tan-Cabugao and M. Simons Costa in the M. Bronner Lab for preparation of chicken embryos, C.R. Calvert and G.J. Shin of Molecular Technologies for synthesis of HCR amplifiers, A. Collazo and S. Wilbert of the Caltech Biological Imaging Facility (BIF) for assistance with imaging, R. Diamond and D. Perez of the Caltech Flow Cytometry Facility (FCF) for assistance with flow cytometry, and M. Mann and the D. Baltimore Lab for generously providing access to their flow cytometer for preliminary studies.
Footnotes
Competing interests
The authors declare competing financial interests in the form of patents, pending patent applications and a startup company (Molecular Instruments).
Author contributions
Conceptualization: H.M.T.C., N.A.P.; Methodology: H.M.T.C., M.S., M.E.F., N.A.P.; Software: M.E.F., J.S., A.C.; Validation: H.M.T.C., M.S.; Investigation: H.M.T.C., M.S., A.A., G.A.; Writing - original draft: H.M.T.C., M.S., N.A.P.; Writing - review & editing: H.M.T.C., M.S., M.E.F., A.A., G.A., J.S., A.C., N.P.; Visualization: H.M.T.C., M.S., N.A.P.; Supervision: N.A.P.; Project administration: N.A.P.; Funding acquisition: N.A.P.
Funding
This work was funded by the Beckman Institute at Caltech (Programmable Molecular Technology Center, PMTC; Center for Advanced Methods in Biological Image Analysis, CAMBIA), by Defense Advanced Research Projects Agency (HR0011-17-2-0008), by the Gordon and Betty Moore Foundation (GBMF2809, GBMF3406), by the National Science Foundation Molecular Programming Project (NSF-CCF-1317694), by the National Institutes of Health (National Institute of Biomedical Imaging and Bioengineering R01EB006192 and National Research Service Award T32 GM007616), by the Deutsche Forschungsgemeinschaft (MI1315/4-1), by a Professorial Fellowship at Balliol College, University of Oxford, and by the Eastman Visiting Professorship at the University of Oxford. The findings are those of the authors and should not be interpreted as representing the official views or policies of the US Government. Deposited in PMC for release after 12 months.
Supplementary information
Supplementary information available online at http://dev.biologists.org/lookup/doi/10.1242/dev.165753.supplemental
References
- Acloque H., Wilkinson D. G. and Nieto M. A. (2008). In situ hybridization analysis of chick embryos in whole-mount and tissue sections. In Avian Embryology 2nd edn: Methods in Cell Biology, Vol. 87 (ed. Bronner-Fraser M.), pp. 169-185. San Diego, CA: Elsevier Academic Press. [DOI] [PubMed] [Google Scholar]
- Antebi Y. E., Linton J. M., Klumpe H., Bintu B., Gong M., Su C., McCardell R. and Elowitz M. B. (2017). Combinatorial signal perception in the BMP pathway. Cell 170, 1184-1196.e24. 10.1016/j.cell.2017.08.015 [DOI] [PMC free article] [PubMed] [Google Scholar]
- Barroso-Chinea P., Aymerich M. S., Castle M. M., Pérez-Manso M., Tuñón T., Erro E. and Lanciego J. L. (2007). Detection of two different mRNAs in a single section by dual in situ hybridization: a comparison between colorimetric and fluorescent detection. J. Neurosci. Methods 162, 119-128. 10.1016/j.jneumeth.2006.12.017 [DOI] [PubMed] [Google Scholar]
- Bi S., Yue S. and Zhang S. (2017). Hybridization chain reaction: a versatile molecular tool for biosensing, bioimaging, and biomedicine. Chem. Soc. Rev. 46, 4281-4298. 10.1039/C7CS00055C [DOI] [PubMed] [Google Scholar]
- Choi H. M. T., Chang J. Y., Trinh L. A., Padilla J. E., Fraser S. E. and Pierce N. A. (2010). Programmable in situ amplification for multiplexed imaging of mRNA expression. Nat. Biotechnol. 28, 1208-1212. 10.1038/nbt.1692 [DOI] [PMC free article] [PubMed] [Google Scholar]
- Choi H. M. T., Beck V. A. and Pierce N. A. (2014). Next-generation in situ hybridization chain reaction: higher gain, lower cost, greater durability. ACS Nano 8, 4284-4294. 10.1021/nn405717p [DOI] [PMC free article] [PubMed] [Google Scholar]
- Choi H. M. T., Calvert C. R., Husain N., Huss D., Barsi J. C., Deverman B. E., Hunter R. C., Kato M., Lee S. M., Abelin A. C. T. et al. (2016). Mapping a multiplexed zoo of mRNA expression. Development 143, 3632-3637. 10.1242/dev.140137 [DOI] [PMC free article] [PubMed] [Google Scholar]
- Clay H. and Ramakrishnan L. (2005). Multiplex fluorescent in situ hybridization in zebrafish embryos using tyramide signal amplification. Zebrafish 2, 105-111. 10.1089/zeb.2005.2.105 [DOI] [PubMed] [Google Scholar]
- Denkers N., García-Villalba P., Rodesch C. K., Nielson K. R. and Mauch T. J. (2004). FISHing for chick genes: triple-label whole-mount fluorescence in situ hybridization detects simultaneous and overlapping gene expression in avian embryos. Dev. Dyn. 229, 651-657. 10.1002/dvdy.20005 [DOI] [PubMed] [Google Scholar]
- Dirks R. M. and Pierce N. A. (2004). Triggered amplification by hybridization chain reaction. Proc. Natl. Acad. Sci. USA 101, 15275-15278. 10.1073/pnas.0407024101 [DOI] [PMC free article] [PubMed] [Google Scholar]
- Gibson U. E., Heid C. A. and Williams P. M. (1996). A novel method for real time quantitative RT-PCR. Genome Res. 6, 995-1001. 10.1101/gr.6.10.995 [DOI] [PubMed] [Google Scholar]
- Harland R. M. (1991). In situ hybridization: an improved whole-mount method for Xenopus embryos. Methods Cell Biol. 36, 685-695. 10.1016/S0091-679X(08)60307-6 [DOI] [PubMed] [Google Scholar]
- Heid C. A., Stevens J., Livak K. J. and Williams P. M. (1996). Real time quantitative PCR. Genome Res. 6, 986-994. 10.1101/gr.6.10.986 [DOI] [PubMed] [Google Scholar]
- Ikbal J., Lim G. S. and Gao Z. Q. (2015). The hybridization chain reaction in the development of ultrasensitive nucleic acid assays. Trac-Trend. Anal. Chem. 64, 86-99. 10.1016/j.trac.2014.08.014 [DOI] [Google Scholar]
- Kerstens H. M. J., Poddighe P. J. and Hanselaar A. G. J. M. (1995). A novel in situ hybridization signal amplification method based on the deposition of biotinylated tyramine. J. Histochem. Cytochem. 43, 347-352. 10.1177/43.4.7897179 [DOI] [PubMed] [Google Scholar]
- Kosman D., Mizutani C. M., Lemons D., Cox W. G., McGinnis W. and Bier E. (2004). Multiplex detection of RNA expression in Drosophila embryos. Science 305, 846 10.1126/science.1099247 [DOI] [PubMed] [Google Scholar]
- Larsson C., Koch J., Nygren A., Janssen G., Raap A. K., Landegren U. and Nilsson M. (2004). In situ genotyping individual DNA molecules by target-primed rolling-circle amplification of padlock probes. Nat. Methods 1, 227-232. 10.1038/nmeth723 [DOI] [PubMed] [Google Scholar]
- Larsson C., Grundberg I., Söderberg O. and Nilsson M. (2010). In situ detection and genotyping of individual mRNA molecules. Nat. Methods 7, 395-397. 10.1038/nmeth.1448 [DOI] [PubMed] [Google Scholar]
- Lehmann R. and Tautz D. (1994). In situ hybridization to RNA. In Drosophila Melanogaster: Pratical Uses in Cell and Molecular Biology, Vol. 44 (ed. Goldstein L. S. B. and Fyrberg E. A.), pp. 575-598. Methods in cell biology San Diego, CA: Elsevier Academic Press. [DOI] [PubMed] [Google Scholar]
- Nieto M. A., Patel K. and Wilkinson D. G. (1996). In situ hybridization analysis of chick embryos in whole mount and tissue sections. In Methods in Avian Embryology: Methods in Cell Biology, Vol. 51 (ed. Bronner-Fraser M.), pp. 219-235. San Diego, CA: Elsevier Academic Press. [DOI] [PubMed] [Google Scholar]
- Pernthaler A., Pernthaler J. and Amann R. (2002). Fluorescence in situ hybridization and catalyzed reporter deposition for the identification of marine bacteria. Appl. Environ. Microbiol. 68, 3094-3101. 10.1128/AEM.68.6.3094-3101.2002 [DOI] [PMC free article] [PubMed] [Google Scholar]
- Piette D., Hendrickx M., Willems E., Kemp C. R. and Leyns L. (2008). An optimized procedure for whole-mount in situ hybridization on mouse embryos and embryoid bodies. Nat. Protoc. 3, 1194-1201. 10.1038/nprot.2008.103 [DOI] [PubMed] [Google Scholar]
- Player A. N., Shen L.-P., Kenny D., Antao V. P. and Kolberg J. A. (2001). Single-copy gene detection using branched DNA (bDNA) in situ hybridization. J. Histochem. Cytochem. 49, 603-611. 10.1177/002215540104900507 [DOI] [PubMed] [Google Scholar]
- Sanders R., Mason D. J., Foy C. A. and Huggett J. F. (2013). Evaluation of digital PCR for absolute RNA quantification. PLoS ONE 8, e75296 10.1371/journal.pone.0075296 [DOI] [PMC free article] [PubMed] [Google Scholar]
- Shah S., Lubeck E., Schwarzkopf M., He T.-F., Greenbaum A., Sohn C. H., Lignell A., Choi H. M. T., Gradinaru V., Pierce N. A. et al. (2016a). Single-molecule RNA detection at depth by hybridization chain reaction and tissue hydrogel embedding and clearing. Development 143, 2862-2867. 10.1242/dev.138560 [DOI] [PMC free article] [PubMed] [Google Scholar]
- Shah S., Lubeck E., Zhou W. and Cai L. (2016b). In situ transcription profiling of single cells reveals spatial organization of cells in the mouse hippocampus. Neuron 92, 342-357. 10.1016/j.neuron.2016.10.001 [DOI] [PMC free article] [PubMed] [Google Scholar]
- Tautz D. and Pfeifle C. (1989). A non-radioactive in situ hybridization method for the localization of specific RNAs in Drosophila embryos reveals translational control of the segmentation gene hunchback. Chromosoma 98, 81-85. 10.1007/BF00291041 [DOI] [PubMed] [Google Scholar]
- Thisse C. and Thisse B. (2008). High-resolution in situ hybridization to whole-mount zebrafish embryos. Nat. Protoc. 3, 59-69. 10.1038/nprot.2007.514 [DOI] [PubMed] [Google Scholar]
- Thisse B., Heyer V., Lux A., Alunni V., Degrave A., Seiliez I., Kirchner J., Parkhill J. P. and Thisse C. (2004). Spatial and temporal expression of the zebrafish genome by large-scale in situ hybridization screening. In The Zebrafish: 2nd edition Genetics Genomics and Informatics: Methods in Cell Biology, Vol. 77 (ed. Detrich H. W. D. III, Zon L. I. and Westerfield M.), pp. 505-519. San Diego, CA: Elsevier Academic Press. [DOI] [PubMed] [Google Scholar]
- Trivedi V., Choi H. M. T., Fraser S. E. and Pierce N. A. (2018). Multidimensional quantitative analysis of mRNA expression within intact vertebrate embryos. Development 145, dev156869. 10.1242/dev.156869 [DOI] [PMC free article] [PubMed] [Google Scholar]
- Vogelstein B. and Kinzler K. W. (1999). Digital PCR. Proc. Natl. Acad. Sci. USA 96, 9236-9241. 10.1073/pnas.96.16.9236 [DOI] [PMC free article] [PubMed] [Google Scholar]
- Wang F., Flanagan J., Su N., Wang L.-C., Bui S., Nielson A., Wu X. Y., Vo H.-T., Ma X.-J. and Luo Y. L. (2012). RNAscope: a novel in situ RNA analysis platform for formalin-fixed, paraffin-embedded tissues. J. Mol. Diagnostics 14, 22-29. 10.1016/j.jmoldx.2011.08.002 [DOI] [PMC free article] [PubMed] [Google Scholar]
- Weiszmann R., Hammonds A. S. and Celniker S. E. (2009). Determination of gene expression patterns using high-throughput RNA in situ hybridization to whole-mount Drosophila embryos. Nat. Protoc. 4, 605-618. 10.1038/nprot.2009.55 [DOI] [PMC free article] [PubMed] [Google Scholar]
- Wiedorn K. H., Kühl H., Galle J., Caselitz J. and Vollmer E. (1999). Comparison of in-situ hybridization, direct and indirect in-situ PCR as well as tyramide signal amplification for the detection of HPV. Histochem. Cell Biol. 111, 89-95. 10.1007/s004180050338 [DOI] [PubMed] [Google Scholar]
- Zhou H., Bouwman K., Schotanus M., Verweij C., Marrero J. A., Dillon D., Costa J., Lizardi P. and Haab B. B. (2004). Two-color, rolling-circle amplification on antibody microarrays for sensitive, multiplexed serum-protein measurements. Genome Biol. 5, R28 10.1186/gb-2004-5-4-r28 [DOI] [PMC free article] [PubMed] [Google Scholar]
Associated Data
This section collects any data citations, data availability statements, or supplementary materials included in this article.