. 2018 Jun 7;7:e36381. doi: 10.7554/eLife.36381

Figure 1. Overall structure of the PRPP riboswitch and its G96A mutant, which is a ppGpp aptamer.

(A) Consensus sequence of the PRPP riboswitch, adapted from Sherlock et al. (Sherlock et al., 2018b). The secondary structure has been updated to show structural information gained from the present study. The sequence is depicted as in Sherlock et al. (see key). Nucleotides noted in blue are important bioinformatic differences between PRPP riboswitches and guanidine riboswitches. Base pair notation is as published previously (Leontis and Westhof, 2001). (B) Secondary structure of the PRPP riboswitch aptamer from T. mathranii. Nucleotides are colored by paired region. Paired regions are indicated in bold. Sequence numbering is indicated in gray. Nucleotides that directly contact PRPP are circled in red, and arrows indicate strand connectivity. (C) Crystal structure of the PRPP riboswitch. Chain A is shown. The RNA is depicted as a cartoon and PRPP is depicted as yellow spheres. Nucleotides are colored by paired region as in B. (D) Crystal structure of the G96A mutant. Chain A is shown. The RNA is depicted as a cartoon and ppGpp is depicted as green spheres. Nucleotides are colored by paired region as in B.

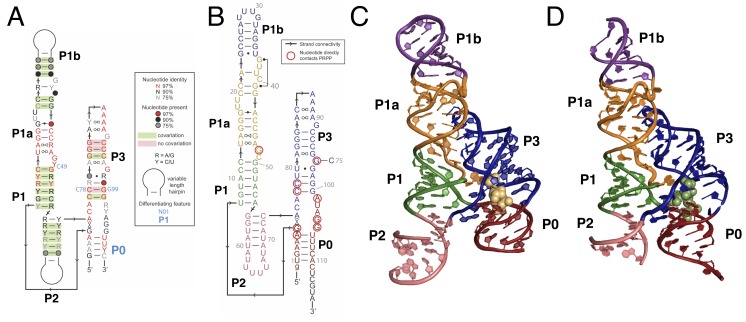
Figure 1—source data 1. Summary of fitted binding data without Bmax constraints.
DOI: 10.7554/eLife.36381.006
Figure 1—source data 2. Raw binding data.
DOI: 10.7554/eLife.36381.007

Figure 1.

Figure 1—figure supplement 1. Autoradiograph of a representative PAGE gel from dissociation constant determination for the PRPP aptamer.

Figure 1—figure supplement 1.

The higher of the two bands represents intact PRPP, while the lower band represents degradation products. The leftmost lane is purified PRPP. This leftmost lane represents a sample of PRPP that was purified and eluted but not subjected to the reaction conditions. Each pair of lanes thereafter represents one dialysis cassette. The concentration of aptamer added to the cassette in micromolar is depicted above each pair. The concentration of aptamer in crystallization experiments was 150 μM, three-fold greater than the highest concentration used in determining the dissociation constant for wild type RNA. ‘L’ is the side of the cassette to which PRPP ligand was initially added. ‘R’ is the side of the cassette to which RNA aptamer was initially added. After overnight incubation at room temperature, material recovered from dialysis cassettes was electrophoresed to separate intact PRPP from degradation products. PRPP incubated in the presence of aptamer experienced significant protection relative to unbound PRPP, permitting the use of this unstable metabolite in the present structural and biophysical studies.
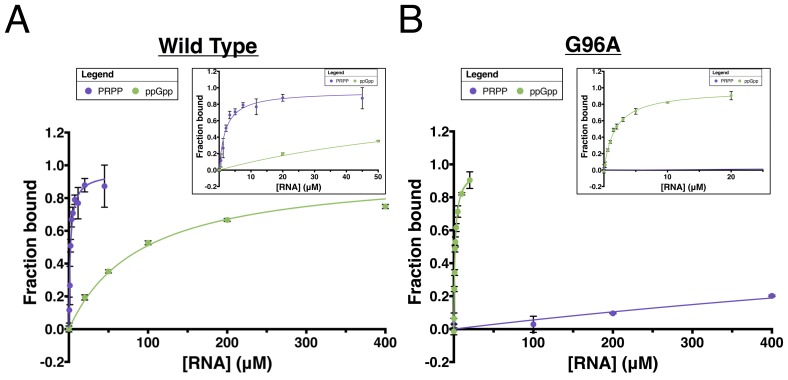
Figure 1—figure supplement 2. Data from equilibrium dialysis experiments and fits used to calculate dissociation constants.

Figure 1—figure supplement 2.

All experiments were performed in triplicate and the standard deviation for each data point is shown using black error bars. (A) wild type RNA binding to PRPP (purple) and ppGpp (green). The ppGpp complex did not quite reach saturation, so the Bmax was constrained to equal the Bmax value from the fit for ppGpp binding to the G96A mutant. (B) G96A mutant binding to PRPP (purple) and ppGpp (green). PRPP reached just 20% bound at 400 μM RNA, so the Bmax was constrained to equal the Bmax value from the fit for PRPP binding to wild type RNA.