

SUMMARY
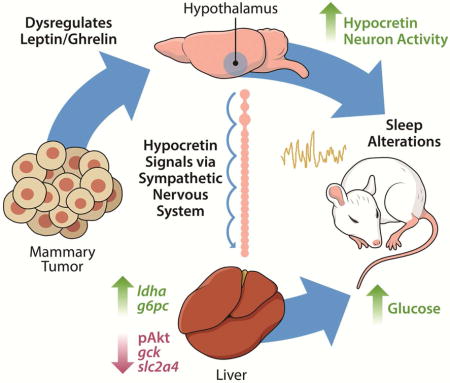
We investigated relationships among immune, metabolic, and sleep abnormalities in mice with non-metastatic mammary cancer. Tumor-bearing mice displayed IL-6 mediated peripheral inflammation, coincident with altered hepatic glucose processing and sleep. Tumor-bearing mice were hyperphagic, had reduced serum leptin concentrations, and enhanced sensitivity to exogenous ghrelin. We tested whether these phenotypes were driven by inflammation using neutralizing monoclonal antibodies against IL-6; despite the reduction in IL-6 signaling, metabolic and sleep abnormalities persisted. We next investigated neural populations coupling metabolism and sleep, and observed altered activity within lateral-hypothalamic hypocretin/orexin (HO) neurons. We used a dual HO receptor antagonist to test whether increased HO signaling was causing metabolic abnormalities. This approach rescued metabolic abnormalities and enhanced sleep quality in tumor-bearing mice. Peripheral sympathetic denervation prevented tumor-induced increases in serum glucose. Our results link metabolic and sleep abnormalities via the HO system, and provide evidence that central neuromodulators contribute to tumor-induced changes in metabolism.
Keywords: Breast cancer, hypocretin/orexin, sleep, IL-6, leptin, ghrelin
In Brief
Cancer patients with metabolic dysfunction have a worse prognosis. Using a mouse model of breast cancer, XXX et al show that tumors deregulate glucose metabolism independently of inflammation. Instead, the hypocretin/orexin neurons involved in regulating sleep-quality, are affected and cause alterations in blood glucose through the sympathetic nervous system.
INTRODUCTION
Among patients with cancer, metabolic dysfunction is a significant problem that is associated with decreased quality of life and increased mortality (Protani et al., 2010). There is evidence of increased glucose concentrations at breast cancer diagnosis relative to values from matched controls without cancer (Lin et al., n.d.). Elevated glucose concentrations are linked to cancer progression (Ryu et al., 2014), and recent rodent studies suggest that cancer can also alter glucose homeostasis (e.g., Masri et al, 2016). A better understanding of the relationship between breast cancer and metabolism is critical given that elevated blood glucose among breast cancer survivors is associated with decreased survival independent of comorbid type II diabetes and body mass index (Villarreal-Garza et al., 2012; Contiero et al., 2013). Sleep problems are also prevalent in breast cancer survivors, and poor sleep is a strong predictor of subsequent mortality even when taking into consideration other risk factors including age, hormone receptor status, cortisol concentrations, depression, and metastasis (Palesh et al., 2014). Despite the prevalence of these problems, the underlying mechanisms mediating cancer-associated metabolic changes and sleep disruption are unknown.
Cancer cells produce and secrete a number of factors, including inflammatory molecules and metabolic ‘waste’ which contribute to inflammation (Grivennikov et al., 2010; Hanahan and Weinberg, 2011). These factors are capable of altering the function of organs locally, or at a distal site (Colegio et al., 2014; Masri et al., 2016). Indeed, a prevalent hypothesis linking cancer to metabolic deregulation is that tumor-induced elevations in interleukin-6 (IL-6) promote hepatic insulin resistance via signal transducer and activator of transcription 3/suppressor of cytokine signaling 3 (STAT3/SOCS3) signaling (Masri et al., 2016), and a similar inflammatory mechanism has been proposed to underlie changes in sleep (Bower et al., 2011). Sleep is essential for proper metabolic regulation, as chronic sleep disruption promotes weight gain and the development of a chronic inflammatory state which may contribute to cancer initiation or progression (Irwin et al., 2008; Lucassen et al., 2012). Because the relationships among metabolism, sleep, and inflammation are poorly understood in the context of cancer, we sought to examine how these components interact during the course of tumor development in a mouse model of non-metastatic breast cancer. We hypothesized that tumor-induced inflammation contributes to metabolic and sleep abnormalities. To test this, we took a multifaceted approach yielding data on metabolic function, immune activation, and sleep throughout tumor growth. We demonstrate that syngeneic non-metastatic tumors (derived from 67NR cells) promote alterations in satiety hormone signaling and hepatic glucose processing coincident with peripheral IL-6-driven inflammation. These phenotypes were associated with disrupted and fragmented sleep, and aberrant activity of wake-stabilizing hypocretin/orexin (HO) neurons. Attenuation of HO signaling (via dual HO-receptor antagonism), but not blockade of IL-6, rescued metabolic abnormalities and enhanced sleep quality in tumor-bearing mice. Furthermore, peripheral sympathetic denervation (via 6-hydroxydopamine administration) prevented tumor-induced elevations in blood glucose concentrations. These data suggest that central neuromodulator systems contribute to impairments in glucose processing in tumor-bearing mice independent of the inflammatory milieu.
RESULTS
Non-metastatic mammary tumors promote peripheral IL-6 signaling
To assess the inflammatory profile in tumor-bearing mice, we measured the expression (mRNA and/or protein) of several cytokines in tumors, serum, spleen, liver, and brain at multiple time-points during tumor development. We observed increased spleen masses, macrophage (F4/80+) infiltration into the tumor, as well as high concentrations of IL-6 protein in serum and tumor parenchyma (Fig. 1A-D). Because the liver orchestrates acute phase responses to elevations in IL-6 (Castell et al., 1990), we examined whether tumor-induced inflammation was associated with altered liver function. We sampled livers from tumor-bearing mice ‘around the clock’ for 24 hours and observed increased protein concentrations of the IL-6 regulated transcription factor pSTAT3 (Fig. 1D), whose phosphorylation at tyrosine (Tyr) 705 is known to activate STAT3 and promote its transcriptional activity via nuclear translocation (Darnell, 1997), as well as increased mRNA expression of IL-6 target genes including stat3, socs3, interleukin-1 receptor-1 (il1r1), interleukin-6 receptor-alpha (il6rα), chemokine ligand 2 (ccl2), and C-reactive protein (crp) (Fig. 1E-J). Importantly, these changes were not detected at all circadian times, suggesting that circadian gating of immune responses may modulate the hepatic response to tumors at a distal site (Masri et al., 2016). Inflammatory changes were not evident in the hypothalamus (Fig. 1K,L), a key brain region involved in the regulation of metabolism and sleep, or in the hippocampus or cortex (Supplementary Figure 1). These data suggest that 67NR derived tumors promote peripheral, but not central, inflammatory responses which are largely driven by IL-6.
Figure 1.
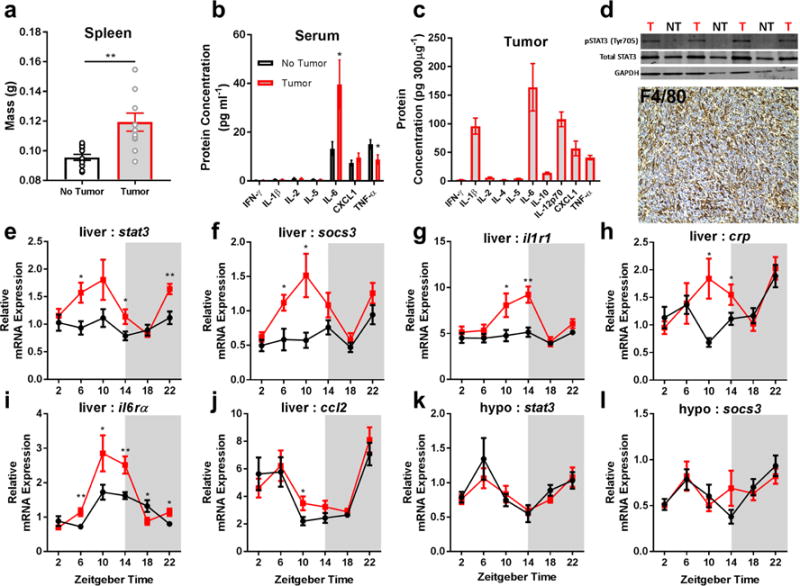
Non-metastatic tumors induce peripheral IL-6 signaling. Tumor bearing mice have increased (a) spleen mass (N = 12/group; t = 3.702, p = 0.0012), (b) high serum levels of IL-6 (N = 13 no tumor, N = 14 tumor for IL-6; t = 2.449, p = 0.022, N = 14/group for TNF-α, t = 2.322, p = 0.028), and (c) their tumors contain high levels of IL-6 protein. (d) This is associated with increased pSTAT3 activation (western blot, ZT 10) in the liver of tumor-bearing mice (T) compared to non-tumor bearing (NT) mice (only relevant lanes of the western blot are shown), and marked macrophage (F4/80+) infiltration into tumors. Tumor bearing mice have increased expression of downstream targets of IL-6 signaling in the liver including (e) stat3 (N = 9/group for ZT 6, t = 2.937, p = 0.0097; 10/group for ZT 14, t = 2.241, p = 0.038; 9 no tumor, 10 tumor for ZT 22, t = 3.571, p = 0.0024), (f) socs3 (N = 9 and 8/group for no tumor and tumor groups ZT 6, t = 2.692, p = 0.0167; N = 9 and 10 for ZT 10, t = 2.683, p = 0.0157), (g) il1r1 (N = 10 no tumor, 9 tumor for ZT 10, t = 2.379, p = 0.029; 8 and 10 for ZT 14, t = 3.725, p = 0.0018), (h) crp (N = 8 no tumor 10 tumor for ZT 10, t = 2.79, p = 0.013; 9 and 8 for ZT 14, t = 2.087, p = 0.054) (i) il6rα (N = 9/group for ZT 6, t = 3.237, p = 0.0052; 10 no tumor and 8 tumor for ZT 10, t= 2.144, p = 0.0478; 9 and 10 for ZT 14, t= 3.139, p = 0.00599; 10 and 9 for ZT 18, t = 2.137, p = .0474; and 9/group for ZT 22, t = 2.642, p = 0.0177), and (j) ccl2 (N = 10 no tumor and 9 tumor for ZT 10, t = 2.247, p = 0.038), but not the hypothalamus (k,l). (Error bars represent ±SEM; *p < 0.05, **p < 0.01, Student’s t-test)
Non-metastatic mammary tumors deregulate hepatic glucose metabolism
Because inflammatory signaling can disrupt liver glucose metabolism (Hotamisligil, 2006), we investigated gluconeogenesis and glycolysis pathway gene expression in the livers every four hours ‘around the clock’. We observed marked deregulation of primary enzymes responsible for glucose processing including gluconeogenesis enzymes: lactate dehydrogenase-A (ldha), phophoenolpyruvate carboxykinase 1 (pck1), and glucose-6-phosphatase (g6pc), and glycolysis enzymes: glucokinase (gck) and pyruvate kinase isozymes L/R (pklr) (Fig. 2H-L). These changes were associated with impaired glucose tolerance after an overnight fast and higher blood glucose when fed ad libitum concurrent with increased food intake particularly during the active phase (Fig. 2A-C, and E). We further assessed whether insulin signaling was normal by measuring a downstream kinase in the insulin receptor activation pathway, phosphorylated Akt (Ser473). We observed reduced pAkt and the insulin-dependent glucose transporter (GLUT4; slc2a4) expression in the livers of tumor-bearing mice (Fig. 2D,M), suggesting that serum elevations in glucose were likely a result of impaired insulin-dependent glucose uptake. We additionally tested functional gluconeogenesis via pyruvate and lactate tolerance tests, and demonstrate that tumor-bearing mice enhanced glucose production upon pyruvate and lactate challenge (Fig. 2F,G). Notably, metabolic abnormalities did not become apparent until the exponential phase of tumor growth, as no differences were observed when tumor-burden was ~0.05g, at 15 days post-injection (Fig. 2N).
Figure 2.
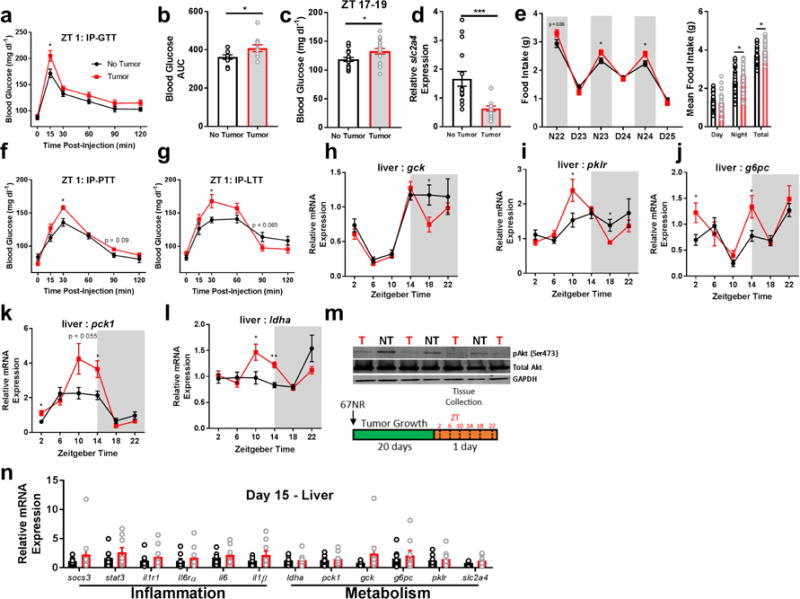
Non-metastatic tumors alter hepatic glucose metabolism. Tumor-bearing mice had impaired (a,b) glucose processing during a glucose tolerance test following an overnight fast (N = 10 no tumor, 9 tumor mice at 15 min post-injection, t = 2.599, p = 0.0187; N = 10/group for AUC, t = 2.134, p = 0.047), as well as (c) spontaneously higher glucose during the active phase (N = 19 no tumor, 18 tumor mice, t = 2.398, p = 0.0219). This was accompanied by (d) reduced expression of the insulin-dependent glucose transporter (slc2a4) (ZT 10, N = 15/group, t = 3.78, p = 0.0008), and (e) increased food intake (N23 N = 40/group, t = 2.251, p = 0.027; N24 t = 2.497, p = 0.0146), night average intake t = 2.542, p = 0.013; total intake t = 2.359, p = 0.021) and altered expression of gluconeogenesis and glycolysis pathway genes ‘around the clock’. (f) Tumor bearing mice enhanced gluconeogenesis in response to pyruvate (N = 15/group, 30 min post-injection, t = 3.43, p = 0.0019) and (g) lactate (N = 15/group, 30 min time point t = 2.534, p = 0.0174) challenges, (h) altered gck (N = 10/group for ZT 18, t = 2.365, p = 0.029), (i) pklr (N = 10 no tumor and 11 tumor for ZT 10, t = 2.23, p = 0.038; 9/group for ZT 18, t = 2.764, p = 0.014), (j) g6pc (N = 8 no tumor and 10 tumor at ZT 2, t = 2.258, p = 0.038; and 10 and 9 at ZT 14, t = 2.428, p = 0.0266), (k) pck1 (N = 10/group for ZT 2, t = 2.694, p = 0.015; 9/group for ZT 14, t = 2.792, p = 0.013), and (l) ldha (N = 9 no tumor and 12 tumor mice for ZT 10, t = 2.38, p = 0.028 ; 8/group for ZT 14, t= 5.105, p = 0.00016) as well as (m) reduced pAkt expression in the liver, indicating impaired insulin receptor signaling (ZT 10) (only relevant lanes of the western blot are shown). These changes in inflammation and metabolism were not evident until after day 15 following 67NR inoculation, as expression of all genes was equivalent between groups at this time (ZT 16) (n). (error bars represent S.E.M; *p < 0.05, **p < 0.01, ***p < 0.001; Student’s t-test).
Altered sleep-wake states in tumor-bearing mice
Because metabolic and immune factors directly contribute to changes in sleep and wakefulness (Opp and Toth, 2003; Sakurai, 2005), we assessed whether tumors directly altered sleep-wake cycles. We monitored EEG/EMG biopotentials via wireless telemetry throughout the course of tumor development. Reductions in locomotor activity, indicative of fatigue, as well as changes in body temperature regulation were detected towards the later stages (days 19-24) of tumor development (Supplementary Figure 2). This was accompanied by reduced time spent awake, and an increase in NREM but not REM sleep (Fig. 3A-I). Sleep was fragmented (Fig. 3M, Supplementary Figures 3), as tumor-bearing mice did not maintain long bouts of wakefulness during their normal active phase. However, no changes in the spectral components (0.5-25 Hz) of sleep were detected during this time, suggesting that there was no change in sleep microstructure despite increased and fragmented sleep. Tumor-bearing mice did exhibit altered temporal patterns of NREM delta (0.5-4 Hz) power, an index of sleep depth (Supplementary Figure 4). To test whether tumors impaired normal responses to a homeostatic sleep challenge, mice were sleep deprived for 6 hours at the start of the normal inactive phase (Oyanedel et al., 2015). Both tumor and non-tumor-bearing mice showed enhanced NREM delta power during recovery sleep that dissipated over time as sleep pressure resolved, suggesting an intact sleep homeostat (Supplementary Figure 4). Importantly, these sleep changes were evident at this time point without simultaneous changes in other behaviors classically associated with disrupted sleep, including depressive-like and anxiety-like behaviors (Supplementary Figure 5).
Figure 3.
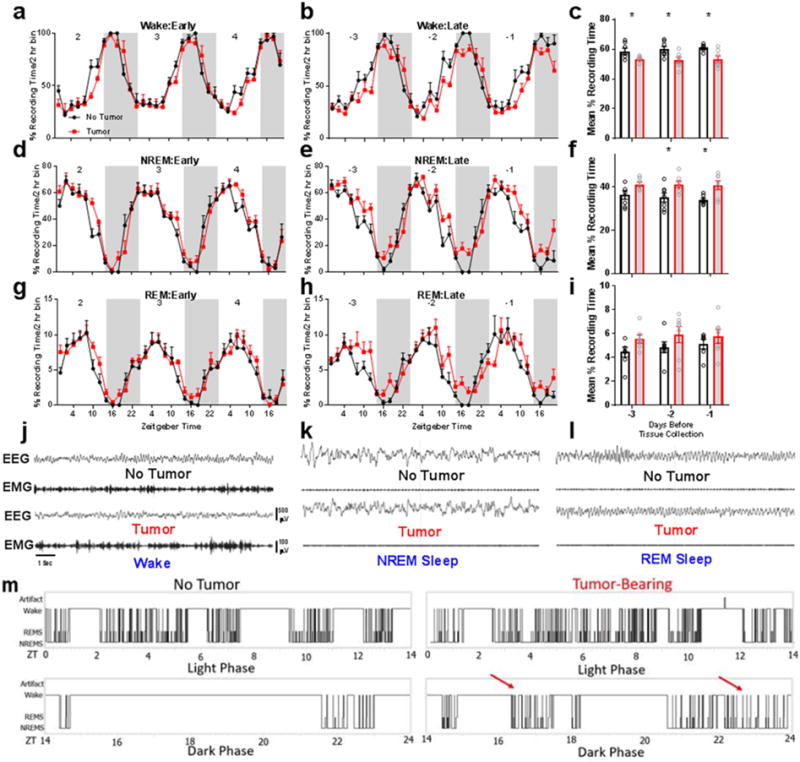
Peripheral tumors disrupt sleep-wake states in mice. Early during tumor development (i.e., 2-4 days postinduction, sleep is not different from non-tumor bearing controls (panels a,d,g). However, late during tumor development (3 days prior to euthanasia at endpoint criteria), mice with tumors spend less time awake (panels b,c) (N = 7/group for days −3, t = 2.401, p = 0.033, and −2, t = 2.595, p = 0.0234, and 6 no tumor and 7 tumor for −1, t = 2.984, p = 0.0124, days prior to tissue collection) and more time in NREM sleep (panels e,f) (N = same as panel (c), −2 days t = 2.317, p = .039; −1 days, t = 2.925, p = 0.0138). Smaller changes are evident in REM sleep, although the total amount of REM sleep remained similar between groups (panels h, i). Representative band-passed EEG/EMG signals from tumor and non-tumor bearing mice in the (j) wake, (k) NREM, and (l) REM sleep vigilance states. Tumor-induced sleep was fragmented, as evidenced in (m), which shows representative hypnograms during the light and dark phases during final day of tumor growth. Aberrant periods of sleep during the normal active phase are marked with red arrows. Error bars represent ±SEM, *p < 0.05, Student’s t-test.
Altered hypocretin/orexin neuron activity in tumor-bearing mice
Next, we investigated whether sleep changes were associated with the altered activity of neurons that control behavioral state switching, namely hypocretin/orexin (HO) and melanin-concentrating hormone (MCH) neurons in the lateral and perifornical hypothalamus. Because HO neurons gate arousal depending on metabolic state (Taylor and Samson, 2003; Yamanaka et al., 2003), we hypothesized that changes in their activity would further be associated with disrupted metabolism. We collected tissue at two time-points coincident with the peak and trough of normal HO neural activity (ZT 7 and ZT 17) (Estabrooke et al., 2001) and co-labeled hypothalamic sections with antibodies against hypocretin and the immediate early gene cFos. We observed an active-phase specific (ZT 17) increase in cFos+ hypocretin+ neurons in tumor-bearing mice (Fig. 4A and G), without simultaneous changes in adjacent MCH populations (Fig. 4J). This change was observed throughout the extent of the hypocretin field, as a greater percentage of cFos+hypocretin+ cells were detected in the dorsomedial, perifornical, and lateral hypothalamic areas (Fig. 4I); this was not due to a generalized activation of the hypothalamus, as the total number of cFos+ cells was unchanged between groups (Fig. 4A).
Figure 4.
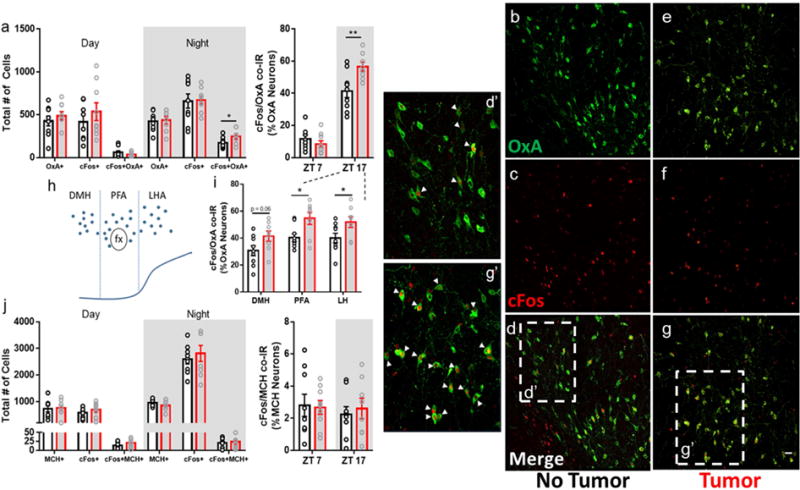
Non-metastatic tumors alter hypocretin/orexin neuron activity. (a) Tumor-bearing mice showed increased cFos immunoreactivity within hypocretin neurons during the active phase (ZT 17) (N = 9 no tumor and 8 tumor mice, t = 2.158, p = 0.047 for total cell numbers and t = 3.016, p = 0.0087 for % OxA neuron co-labeling at ZT 17). (b-g’) representative confocal images of hypocretin/orexin (AlexaFluor-488, green) and cFos (AlexaFluor-594, red) immunofluorescence in the hypothalamus. d’ and g’ show zoomed in sections of ‘d’ and ‘g’, respectively. Double-labeled cells are denoted by arrowheads. (h) schematic of the location of hypocretin/orexin neurons in the hypothalamus, and (i) quantification of double-labeling observed in each sub-region during the active phase (ZT 17) (N = 9 no tumor and 8 tumor mice, PFA t = 2.722, p = 0.016; LH t = 2.237, p = 0.041). (j) no changes were observed in co-distributed melanin concentrating hormone (MCH) neurons. (DMH = dorsomedial hypothalamus, PFA = perifornical area, LH = lateral hypothalamus). (Error bars represent SEM, *p < 0.05, **p < 0.01, Student’s t-test). Merged images (d,d’,g,g’) are composites of b,c, and e,f, respectively, scale bar = 50 μm
IL-6 blockade does not rescue metabolic or sleep phenotypes
Because insulin receptor substrates 1 and 2 (IRS1/2), key components in the insulin signaling pathway, are targeted for degradation via IL-6-STAT3-SOCS3 signaling (Rui et al., 2002), and we observed elevated hepatic responses coincident with tumor-derived IL-6, we predicted that blockade of IL-6 signaling would restore normal metabolic function and sleep. To test this, we administered a monoclonal antibody (mAb; 0.1 mg) against IL-6 (IP) or the IgG1 isotype control to mice in a full-factorial design at multiple time-points throughout tumor development; on day 15 (before hepatic abnormalities become apparent), 19, and 23, followed by tissue collection on day 26. We conducted a parallel experiment to test whether IL-6 blockade could rescue sleep deficits in tumor-bearing mice by administering the mAb at day 22 post-injection and collected tissue at day 25 after measuring sleep throughout the later stages of tumor development. We used a single antibody injection protocol for this experiment as its efficacy at reducing IL-6 was comparable to the triple-dose administration procedure (Supplementary Figure 6). Despite successfully reducing IL-6 concentrations and pSTAT3-mediated gene transcription (Fig. 5C-E), the metabolic alterations persisted (Fig. 5G-L) and tumor-bearing mice still displayed hyperglycemia (Fig. 5A). Additionally, IL-6 blockade did not improve (or alter) sleep in tumor-bearing mice, which still displayed reduced wakefulness and fragmented vigilance states (Fig. 5M). Two additional doses of IL-6 mAb (0.02 and 0.5 mg) also failed to normalize serum glucose in tumor-bearing mice relative to non-tumor bearing mice (Supplementary Figure 6). Together, these data demonstrate that IL-6 signaling is not necessary for the development of tumor-induced changes in sleep and glucose metabolism.
Figure 5.
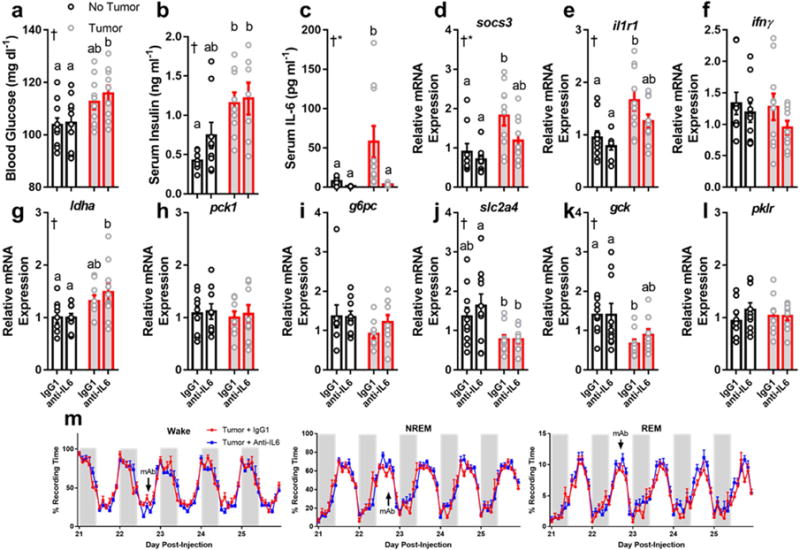
Neutralizing antibodies against IL-6 do not rescue metabolic or sleep phenotypes in tumor-bearing mice. Tumor-bearing mice increased (a) blood glucose (N = 10/group, main effect of tumor, F1,36 = 11.67, p = 0.0016) and (b) serum insulin (N = 8 no tumor IgG, 9 no tumor anti-IL-6, 9 tumor IgG, 7 tumor anti-IL-6, main effect of tumor, F1,29 = 16.46, p = 0.0003) regardless of whether they received anti-IL6 or the IgG1 isotype control (a total of three injections on days 15, 19, and 23). Despite successfully knocking down IL-6 (c) (N = 9 no tumor IgG, 7 no tumor anti-IL6, 10 tumor IgG and tumor anti-IL6; main effect of tumor F1,32 = 5.344, p = 0.027, main effect of antibody F1,32 = 7.016, p = 0.012, and an interaction among the two F1,32 = 4.391, p = 0.044) and IL-6 mediated socs3 expression (d) (N = 9 no tumor IgG and anti-IL6, 10 tumor IgG and anti-IL6, main effect of tumor, F1,34 = 12.34, p = 0.0013, main effect of antibody, F1,34 = 4.431, p = 0.043), but not il1r1 (N = 10/group except no tumor anti-IL6, main effect of tumor, F1,35 = 17.54, p = 0.0002) tumor bearing mice still showed deregulated expression of ldha (g) (N = 9 no tumor IgG and anti-IL6, 9 tumor IgG and 10 tumor anti-IL6, main effect of tumor, F1,33 = 10.3, p = 0.003), slc2a4 (j) (N = 10/group except 9 for tumor anti-IL6, main effect of tumor, F1,35= 11.79, p = 0.0015), and gck (k) (N = 10/group except 9 for tumor IgG, main effect of tumor, F1,35= 11, p = 0.0021), suggesting that IL-6 is not required for tumors to alter hepatic metabolism. Additionally, Anti-IL6 mAb treatment (single injection at day 22, denoted by “mAb” in figure) did not alter sleep in tumor bearing mice (m), demonstrating that IL-6 is not required for tumorinduced sleep disruption. (tissue collected at ZT 16) (Error bars represent S.E.M, † = main effect of tumor, * = main effect of antibody treatment, different letter headings represent multiple comparisons at p < 0.05, 2-way ANOVA; Tukey’s multiple comparisons test) (see Figure S8, 9).
Hypocretin/orexin dual-receptor antagonism attenuates metabolic abnormalities and enhances sleep quality in tumor-bearing mice
Given the ability of HO neurons to regulate metabolism and sleep, we further hypothesized that the aberrant HO signaling we observed in tumor-bearing mice contributed to metabolic dysfunction. To test this, we administered (oral) the dual HO-receptor antagonist Almorexant (ALX) at multiple time points during the course of tumor development (days 15, 18, 21, and 24). We then collected tissue during the mid-day and midnight (ZT 6 and ZT 18, respectively) on day 25 and assessed metabolic and immune phenotypes. ALX treatment attenuated daytime hyperglycemia in tumor-bearing mice (Fig. 6A), and partially rescued the expression of several genes controlling gluconeogenesis and glycolysis within the liver (ldha, gck, slc2a4) (Fig. 6B-D) independent of coincident IL-6 driven inflammation (Fig. 6F-H). However, not all changes in gene expression were attenuated by ALX (pck1, pklr, g6pc; data not shown), which is likely due to the long latency (~18 h) between drug administration and tissue collection. Importantly, repeated administration of ALX did not alter body or tumor masses or food intake, ruling out the idea that improvement in metabolism was purely due to reductions in feeding (Supplementary Figure 7). Pre-treatment with ALX improved measures of glucose tolerance in a separate cohort of mice (Supplementary Figure 7). These data provide evidence that central HO signaling contributes to tumor-induced changes in glucose metabolism.
Figure 6.
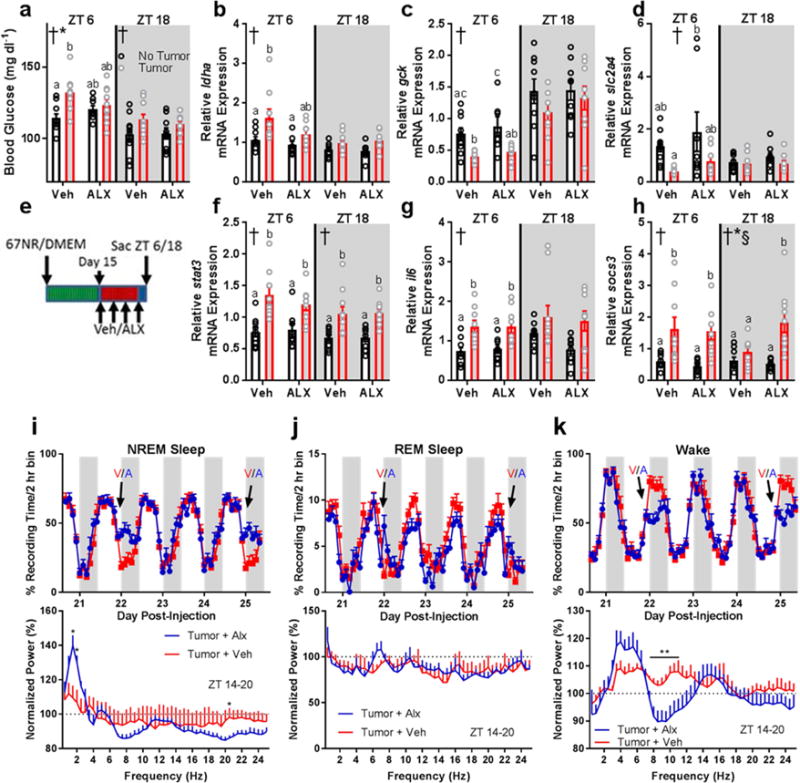
Dual HO-receptor antagonism attenuates tumor-induced impairments in glucose processing and improves sleep quality without affecting peripheral inflammation. (a) Blood glucose (ZT 6 2-way ANOVA main effect of tumor: F1,33 = 8.903, p = 0.0053; interaction: F1,33 = 4.381, p = 0.0441)(ZT 18 2-way ANOVA main effect of tumor: F1,35 = 5.149, p = 0.03), (b) liver ldha expression (ZT 6 2-way ANOVA main effect of tumor: F1,32 = 9.194, p = 0.0048), (c) liver gck expression (ZT 6 main effect of tumor: F1,30 = 19.25, p = 0.0001), and (d) liver slc2a4 expression (ZT 6 main effect of tumor: F1,31 = 8.089, p = 0.0078) were altered by tumor-status and attenuated by administration of ALX. (e) Experimental design for ALX administration. Changes in hepatic inflammatory gene expression were not observed in response to ALX treatment. (f) Liver stat3 (ZT 6 main effect of tumor: F1,32 = 24.41, p < 0.0001; ZT 18 main effect of tumor: F1,33 = 22.79, p < 0.0001), (g) liver il6 (ZT 6 main effect of tumor: F1,32 = 21.43, p < 0.0001), and (h) liver socs3 (ZT 6 main effect of tumor: F1,30 = 17.37, p = 0.0002; ZT 18 main effect of tumor: F1,34 = 17.4, p = 0.0002; main effect of ALX F1,34 = 4.778, p = 0.0358; interaction F1,34 = 7.874, p = 0.0082) showed enhanced expression in tumor-bearing mice regardless of ALX treatment (n = 8-10/group/timepoint). (i) ALX treatment (V = vehicle, A = ALX) increased NREM sleep time during the first 6 hours following injections (day 22 ZT 14 t = 3.755, p = 0.0032; ZT 16 t = 3.126, p = 0.0096; ZT 18 t = 2.925, p = 0.014; day 25 ZT 14 t = 3.574, p = 0.0044; ZT 16 t = 3.995, p = 0.0021; ZT 18 t = 2.301, p = 0.042). This sleep was characterized by more restorative delta (0.5-4 Hz) frequencies in the EEG on day 25 normalized to the same time-frame (ZT14-20) on a non-treatment day (day 24) (1.5 Hz t = 3.361, p = 0.0063; 2 Hz t = 2.825, p = 0.0165, 20.5 Hz t = 2.354, p = 0.0382). (j) ALX had negligible effects on REM sleep time (day 20 ZT 12 t = 2.234, p =0.047, day 21 ZT 18 t = 3.464, p = 0.00529; ZT 0 t = 2.889, p = 0.015; day 22 ZT 14 t = 3.973, p = 0.0022, ZT 8 t = 3.177, p = 0.0088; day 23 ZT 18 t = 3.141, p = 0.0094; day 24 ZT 12 t = 3.095, p = 0.01; day 25 ZT 14 t = 2.685, p = 0.021). No effects of ALX on normalized REM EEG spectra were observed. (k) ALX treatment decreased wakefulness during the first 6 hours following injections (day 22 ZT 14 t = 4.139, p = 0.0016; ZT 16 t = 2.974, p = 0.013; ZT 18 t = 2.831, p = 0.016; day 23 ZT 22 t = 2.213, p = 0.049; day 25 ZT 14 t = 3.625, p = 0.004; ZT 16 t = 3.828, p = 0.003; ZT 18 t = 2.421, p = 0.034). ALX decreased wakefulness theta/alpha EEG frequencies following treatment (7.5 Hz: t = 2.298, p = 0.042; 8 Hz: t = 2.888, p = 0.015; 8.5 Hz: t = 2.799, p = 0.017; 9 Hz: t = 2.737, p = 0.019; 9.5 Hz: t = 3.335, p = 0.0067; 10 Hz: t = 3.129, p = 0.0096; 10.5 Hz: t = 2.612, p = 0.024; 11 Hz: t = 2.346, p = 0.039). (n = 6 tumor + veh, 7 tumor + alx). Error bars represent S.E.M, † = main effect of tumor, * = interaction, § = main effect of ALX treatment; different letter headings represent multiple comparisons at p < 0.05, 2-way ANOVA; Tukey’s multiple comparisons test).
To assess whether ALX could improve sleep quality, we administered the drug (or vehicle) as above in tumor-bearing mice equipped with EEG/EMG biotelemeters. ALX promoted restorative delta-rich (0.5-4 Hz) NREM sleep without changes to REM sleep (Fig. 6I-K), suggesting that HO antagonism enhances sleep quality in association with improved glucose metabolism.
Peripheral sympathetic denervation attenuates metabolic abnormalities in tumor-bearing mice
As HO neurons can alter hepatic metabolism via the sympathetic nervous system (Yi et al., 2009), we tested whether peripheral ablation of noradrenergic signaling (i.e., sympathetic nerve terminals) would attenuate metabolic abnormalities in tumor-bearing mice. To accomplish this, we used peripheral 6-hydroxydopamine (6-OHDA) administration in a protocol similar to that of Rolls and colleagues (Ben-Shaanan et al., 2016) (Fig. 7A). Systemic injection of 6-OHDA resulted in the expected decrease in norepinephrine content in the spleen, suggesting successful SNS ablation (Fig. 7B). 6-OHDA successfully attenuated metabolic abnormalities in tumor-bearing mice, as mice that received this treatment showed equivalent blood glucose concentrations and normalization of several genes involved in gluconeogenesis/glycolysis (ldha, gck, pklr) at tissue collection (ZT 6; Fig. 7C-F). These data provide evidence that SNS signaling contributes to changes in glucose metabolism in tumor-bearing mice.
Figure 7.
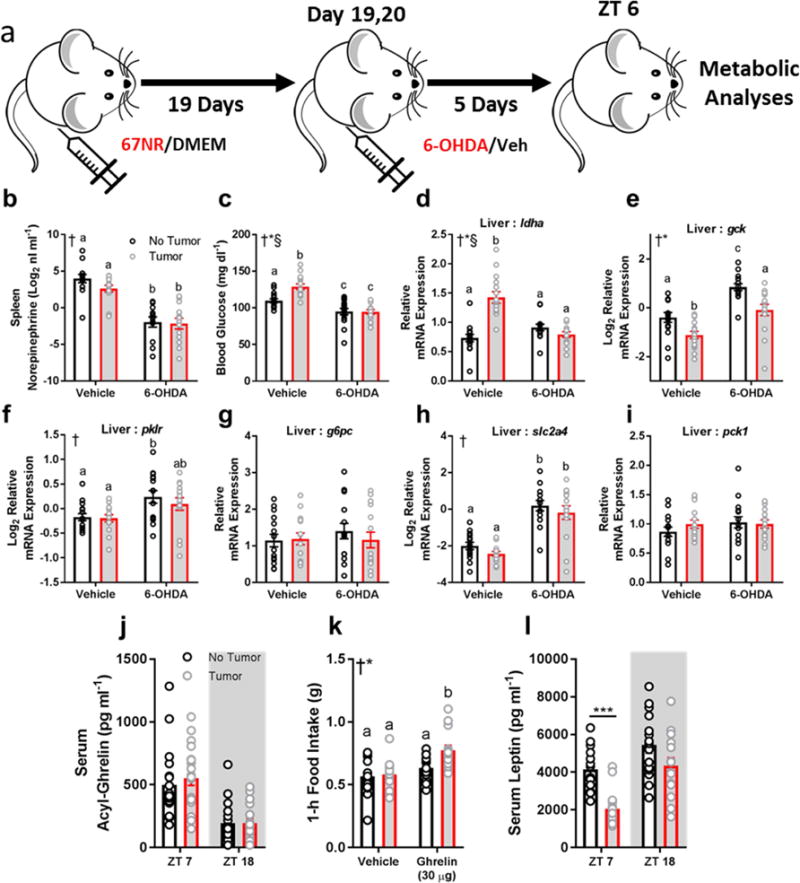
Peripheral sympathetic denervation rescues metabolic abnormalities in tumor-bearing mice. (a) Experimental design. (b) Norepinephrine content in the spleen was reduced in mice that received 6-OHDA, suggesting successful sympathetic nervous system (SNS) ablation (n = 12-14/group, main effect of 6-OHDA F1,49 = 75.61, p < 0.0001). (c) 6-OHDA treatment normalized blood glucose concentrations in tumor-bearing mice (n = 14- 15/group; main effect of tumor F1,55 = 6.923, p = 0.011; main effect of 6-OHDA F1,55 = 47.86 p < 0.0001; interaction F1,55 = 7.58, p = 0.008). 6-OHDA normalized (d) liver ldha expression (n = 14-15/group; main effect of tumor F1,54 = 16.73, p = 0.0001; main effect of 6-OHDA F1,54 = 10.51, p = 0.002; interaction F1,54 = 33.48, p < 0.0001) (e) liver gck (15/group; main effect of tumor: F1,56 = 19.97, p < 0.0001; main effect of 6-OHDA F1,56 = 37.54, p < 0.0001), (f) pklr (n = 15/group; main effect of 6-OHDA F1,56 = 11.2, p = 0.0014). (g) g6pc (no change), (h) slc2a4 (n = 14- 15/group; main effect of 6-OHDA F1,53 = 70.04, p < 0.0001), (i) pck1 (no change) (all 6-OHDA data collected at ZT 6) (2-way ANOVA † = main effect of 6-OHDA, * = main effect of tumor, § = interaction; different letters indicate p < 0.05 difference with Tukey’s post-hoc test). Data that did not meet requirements for ANOVA were log2- transformed. In a separate cohort, tumor-bearing mice had altered satiety hormonal signaling. (j) serum acyl-ghrelin concentrations were unchanged between groups (n = 18-19/group), (k) however tumor-bearing mice increased feeding responses to exogenous ghrelin after a 14 hour fast (n = 14-15/group) ZT 14 injection; main effect of ghrelin F1,55 = 15.67, p = 0.0002; main effect of tumor status F1,55 = 5.738, p = 0.02; † = main effect of tumor, * = main effect of ghrelin). Tumor bearing mice showed reduced serum leptin concentrations during the day (n = 15/group; ZT 7 t = 5.54, p < 0.0001)
Altered satiety hormone signaling in tumor-bearing mice
If hypocretin/orexin neurons contribute to tumor-induced changes in glucose metabolism and/or sleep, what then, is the signal that alters their activity? HO neurons are sensitive to metabolic signals from the periphery including ghrelin, leptin, and glucose (Yamanaka et al, 2003). We measured acyl-ghrelin in ad libitum fed mice during the mid-day and mid-night. Both tumor- and non-tumor bearing mice showed the expected differences in acyl-ghrelin concentrations between the day and night, but no group differences were observed (Fig. 7J). To investigate whether tumor-bearing mice were more sensitive to the effects of exogenous ghrelin, we administered ghrelin (IP; 30 μg/mouse) shortly before the active (dark) phase to fasting mice and measured food intake for one hour. Tumor-bearing mice showed enhanced feeding responses to exogenous ghrelin (Fig. 7K). Additionally, we investigated leptin concentrations, because leptin inhibits HO neurons (Yamanaka et al, 2003); serum leptin was significantly reduced in tumor bearing mice during the mid-light (ZT 7) phase (Fig. 7L). Together, these findings suggest that hormonal changes in the periphery (i.e., leptin, ghrelin) could modulate HO neural activity to drive aberrant hepatic metabolism and sleep in tumor-bearing mice.
DISCUSSION
Patients with breast cancer have idiopathic metabolic and sleep problems that reduce quality of life and may contribute to increased mortality (Palesh et al., 2014; Protani et al., 2010). Here, we demonstrate that non-metastatic tumors, independent from other extraneous factors (e.g., diet, stress, age, or metastasis), can deregulate hepatic glucose metabolism and sleep. Tumor-bearing mice were hyperphagic, had reduced circulating levels of the satiety hormone leptin, and enhanced feeding responses to exogenous ghrelin. These factors modulate hypocretin/orexin neurons, which showed aberrant neural activity in tumor-bearing mice. Reducing HO signaling via dual receptor antagonism attenuated the effects of tumors on serum glucose and improved measures of sleep quality. HO neurons may be achieving these effects via SNS signaling to the liver (Geerling et al., 2003; Yi et al., 2009), as peripheral sympathetic denervation also rescued serum glucose in tumor-bearing mice. Importantly, the tumor effects on glucose and sleep appear to be independent of IL-6 driven inflammation.
First, we investigated whether non-metastatic tumors in the periphery were able to induce systemic immune activation (Fig. 1), and demonstrate that 67NR-derived tumors promote a predominantly IL-6 driven response. IL-6 is a pleiotropic cytokine that has modulatory actions on metabolism. Specifically, IL-6 binding its receptor results in the downstream phosphorylation of the transcription factor STAT3. This protein regulates the expression of hundreds of genes, including its own negative regulator socs3 (Dauer et al., 2005). SOCS3 interacts and targets insulin receptor substrates 1 and 2 (IRS1 and 2) for ubiquitin-mediated degradation (Rui et al., 2002). IRS1 and 2 are major components regulating insulin-dependent glucose uptake, and their suppression results in insulin insensitivity concurrent with hyperglycemia, a phenotype we observed in the present study.
The promotion of hyperglycemia is a strategy used by tumors to facilitate their proliferation and growth (Ryu et al., 2014), therefore, we examined genes involved in gluconeogenesis and glycolysis in tumor-bearing mice. Additionally, recent evidence suggests that hyperglycemia can promote metastatic seeding by impairing neutrophil mobilization (Fainsod-Levi et al., 2017). We observed impaired glucose tolerance, spontaneous hyperglycemia, as well as altered temporal expression patterns of genes responsible for glucose synthesis (ldha, pck1, g6pc) and breakdown (gck, pklr), with the former showing an increase and the latter showing a decrease in expression, suggesting a shift towards hepatic glucose production. Indeed, tumor-bearing mice enhanced hepatic gluconeogenesis in response to pyruvate and lactate challenges, which provide non-carbohydrate carbon substrates for glucose production (Fig. 2F,G). Tumor-driven disruption of liver function has recently been demonstrated in metastatic mouse models of lung adenocarcinoma (Masri et al., 2016), transplanted colorectal cancer, and spontaneous pancreatic ductal adenocarcinoma (Flint et al., 2016). Importantly, our data provide the first evidence for tumor-induced liver dysfunction in a non-metastatic mouse model of mammary cancer, as 67NR cells fail to intravasate and do not leave their primary site (Lou et al., 2008). Additionally, in contrast to other models, 67NR-derived tumors do not cause behavioral deficits or cachexia (Supplementary Figs. 5,7), which may independently contribute to metabolic and sleep changes. We observed a similar metabolic phenotype in the livers of mice inoculated with metastatic sister cell lines to 67NR (i.e., 4T1 and 4T07; data not shown), suggesting that our findings are not specific only to 67NR-generated tumors.
Given the reciprocal interactions among sleep, metabolism, and immunity (Laposky et al., 2008), we investigated whether tumors in the periphery could disrupt sleep-wake states. Tumor-bearing mice had increased and fragmented sleep towards the later stages of tumor development (when total tumor burden was ~3-4% of body mass) (Fig. 3, Supplementary Fig. 3). They also displayed altered temporal patterns of NREM delta power (Supplementary Fig. 4). Because cytokine signaling directly interacts with neural circuitry controlling vigilance states (Imeri and Opp, 2009), we initially predicted that altered sleep was driven by central inflammation, however we found no evidence of altered immune activation in the brain (Supplementary Fig. 1). Indeed, protein expression of inflammatory cytokines in the brain (hippocampus and cortex) was not different between tumor and non-tumor bearing mice regardless of whether the tumor cells were situated orthotopically (within the mammary fat pad) or subcutaneously, suggesting that the changes we observed were not due to the lack of specific tumor-stromal interactions (Supplementary Fig. 5). Further, these changes were not due to elevated glucocorticoids, as corticosterone concentrations in serum were equivalent between groups at this time (Supplementary Fig. 7).
Given the increase in IL-6 signaling observed in the present study, as well as previous reports indicating a causal link between this cytokine and the deregulation of hepatic metabolism and sleep (Flint et al., 2016; Masri et al., 2016; Vgontzas et al., 1999), we predicted that blocking IL-6 would rescue the disrupted phenotypes we observed. After administrations of neutralizing antibodies against IL-6, we were unable to rescue either metabolic or sleep problems in tumor-bearing mice (Fig. 5, Supplementary Fig. 6). These data demonstrate that IL-6 is not necessary for the development of glucose dysregulation and vigilance-state disruption in response to non-metastatic tumors in the periphery. Hypocretin/orexin neurons receive peripheral signals on metabolic and immune status, integrating these factors to subsequently regulate arousal and feeding behavior (Adamantidis and de Lecea, 2009; Inutsuka et al., 2014; Willie et al., 2001). These neurons send projections to the liver to regulate glucose production via autonomic pathways (Yi et al., 2009). We observed increased HO neuronal activity during the active phase (as assessed via cFos immunofluorescence) concurrent with increased food intake, sensitivity to ghrelin, and decreased leptin concentrations (Figs. 2,4,7). These data suggest that disrupted sleep may be coupled to changes in metabolism or immune signaling in the periphery. We did not observe changes in either total cFos+ or cFos+/MCH+ cells, which are co-distributed with HO neurons, suggesting a specific effect of peripheral tumors on HO neurons. These data provide evidence for a link between tumor-induced changes in metabolism and alterations to the activity of neurons controlling sleep-wake states. Indeed, hypocretin receptor antagonism is capable of lowering glucose, preventing weight gain, and promoting sleep (Tsuneki et al., 2016). To this end, we tested whether blockade of hypocretin signaling (using the dual receptor antagonist Almorexant; ALX) could improve metabolic and sleep parameters in tumor-bearing mice. Mice that harbored tumors and received vehicle administrations remained hyperglycemic at tissue collection, while this phenotype was attenuated in mice that received ALX. This was associated with improved expression of hepatic genes that control glucose production and uptake (i.e., ldha, gck, and slc2a4). As expected, ALX did not reverse tumor-induced hypersomnia, however, ALX did improve sleep quality (Fig. 6I) (i.e., NREM delta power), which was diminished in tumor-bearing mice (Supplementary Figure 4). This is consistent with previous studies involving ALX (Brisbare-Roch et al., 2007). Because hypocretin receptor antagonists are already approved for use in clinical populations (e.g., Suvorexant) (Michelson et al., 2014), this raises an attractive possibility that they could be repurposed to improve metabolism and sleep in cancer patients.
As mentioned, HO neurons signal via the sympathetic nervous system (SNS) to influence hepatic glucose production (Yi et al., 2009). Peripheral sympathetic denervation (via administration of 6-OHDA) attenuated tumor-induced changes in glucose metabolism (Fig. 7B-I), consistent with the hypothesis that aberrant activity in HO neurons alters glucose concentrations via the SNS. The tumor-induced change in HO neural activity may be driven by alterations to satiety hormones; HO neurons are sensitive to these peripheral signals including ghrelin, leptin, and glucose (Yamanaka et al., 2003). Ghrelin is a gut hormone upregulated during extended periods of fasting and is a powerful modulator of feeding behavior (Nakazato et al., 2001). It exists in two isoforms, des-acyl and acyl ghrelin. Ghrelin O-acyl-transferase (GOAT) is the enzyme that enables ghrelin to bind and activate its receptor (GHS-R). HO neurons express GHS-Rs, and ghrelin-induced feeding responses can be blocked via attenuation of HO signaling (Toshinai et al., 2003). We detected no changes in circulating acyl-ghrelin concentrations, but enhanced sensitivity to exogenous ghrelin in tumor-bearing mice (Fig. 7J,K). Additionally, HO neurons express leptin receptors (LepRb; (Håkansson et al., 1999), and receive inhibitory input from LepRb-expressing GABAergic neurons in the lateral hypothalamus (Bonnavion et al., 2015). Tumor-bearing mice had reduced circulating leptin concentrations, which may disinhibit HO neurons to promote the phenotype we observed.
Limitations of Study
There are limitations to our study that warrant discussion. First, we conducted our study in a single non-metastatic model of breast cancer; although other studies have reported similar effects of lung and pancreatic tumors on hepatic glucose metabolism (Masri et al., 2016; Flint et al., 2016). Future studies will need to determine the generality of the tumor effects on HO activity, sleep, and satiety hormones. Additionally, while no changes in gluconeogenesis/glycolysis gene expression in skeletal muscle were observed, future studies should investigate muscle metabolic processes in this model, given the gross changes in lean body mass (Supplementary Figure 7). Further, how different cancer treatment regimens, such as surgery and chemotherapy, interact with the tumor effects we observed to influence metabolic and sleep phenotypes remains an open question. We have previously demonstrated chemotherapy-induced changes in sleep in non-tumor bearing mice (Borniger et al., 2015), and others have linked reductions in arousal to chemotherapy-induced changes in HO signaling (e.g., Weymann et al., 2014). Our data suggest that independent of treatment, cancer alone is capable of altering neuromodulator systems that control arousal and metabolism. An alternative mechanism may involve tumor-induced modulation of a separate set of sleep-promoting neural populations, where HO neurons then attempt to compensate for enhanced sleep drive. Additionally, due to the marked reduction in locomotor activity observed in tumor-bearing mice, it is possible that simple reductions in activity contributed to the observed phenotypes. Future studies should examine whether normalizing activity among tumor-bearing mice prevents metabolic and sleep changes from occurring. Finally, it is possible that the cancer cell line used in the present study simply did not induce a sufficient inflammatory response to drive IL-6 mediated impairments in glucose processing or sleep abnormalities. Future work should use more aggressive/metastatic lines and/or transgenic cancer models to test the generalizability of our results.
Together, our data demonstrate a novel sleep-altering effect of non-metastatic mammary tumors, which is accompanied by deregulated glucose metabolism. This effect is not mediated by tumor-induced elevations in IL-6, as blocking IL-6 signaling did not rescue the observed deficits. In contrast, timed inhibition of hypocretin/orexin receptor signaling improved glucose metabolism and sleep quality in tumor-bearing mice. Peripheral sympathetic denervation recapitulated the effect on metabolism. This phenotype may be driven by reductions in serum leptin or increased sensitivity to ghrelin. These data provide evidence that central neuromodulator signaling contributes to tumor-induced changes in whole-body glucose metabolism, and suggest that targeting the HO system may be a novel strategy for improving metabolic and sleep problems in patients with breast cancer.
METHODS
Contact for Reagent and Resource Sharing
Further information and requests for reagents may be directed to Jeremy Borniger (jcbornig@stanford.edu).
Experimental Model and Subject Details
Mice
Adult (>8 wks old) female BALB/c mice (Charles River Laboratories) were group housed (4/cage) and allowed to acclimate to our facility for 1 week on a 14:10 light/dark cycle at 22±2°C before experimental group assignment. Mice were provided food (Harlan Teklad #7912), reverse osmosis water, and cotton nesting material ad libitum throughout the course of the experiment. BALB/c mice were used as the 67NR tumor cell line was originally derived from a spontaneous tumor in this strain of mice, allowing for experiments to be done in the context of an intact immune system. All procedures were approved by The Ohio State University Institutional Animal Care and Use Committee.
Cell Lines
Non-metastatic murine 67NR, 4T07 (metastatic), and 4T1 (metastatic) mammary cancer cells (Fred Miller, PhD, Karmanos Cancer Institute, Detroit, MI, USA) obtained from the supplier were cultured using sterile technique in Dulbecco’s modified Eagle’s medium supplemented with 10% fetal bovine serum and 1% penicillin/streptomycin. Cells were used within 3 passages upon arrival. Prior to injections cells underwent mycoplasma testing using the PlasmoTest kit (InvivoGen, San Diego, CA, USA) and were verified to be free of any mycoplasma contamination. These cells (67NR), when implanted, display a breast cancer phenotype similar to the basal subtype (Aslakson and Miller, 1992). Cells were incubated at 37°C in a mixture of 5% carbon dioxide and 95% air. Once cells reached ~90% confluence, cell numbers and viability were determined with a 1:1 mixture of trypan blue (Life Technologies) in an automated hemocytometer (The Countess II, Life Technologies, Carlsbad, CA, USA). Cells were diluted in DMEM to make a final concentration of 1 × 10⁵ cells per 100 μL. Mice were briefly anesthetized under isoflurane, and received bilateral subcutaneous injections (100 μL surrounding the left and right inguinal mammary fat pad) of 67NR in DMEM (hereafter referred to as “Tumor”) or DMEM alone (“No Tumor”). Proper injection was confirmed by observing the presence of a wheal upon injection. Mice were inspected daily for tumor growth. Once a tumor became palpable, measures were taken daily using sliding calipers and volume was determined using the formula Volume = (length x width2)/2 (Tomayko and Reynolds, 1989). Sleep measures were recorded continuously throughout tumor growth, and once a tumor exceeded 1.5 cm in any dimension, or 25 days post-injection, the mouse was euthanized. Animals showing any of the following signs were removed from the study and euthanized: (1) overall tumor volume exceeding 2000 mm3, (2) ulcerated tumors, (3) evidence of skin irritation at the injection site, or (4) tumor interfered with normal mouse function (e.g., mobility, eating, drinking). Only one mouse met any of these removal criteria (initial signs of an ulcerated tumor) and was euthanized at day 18 post-67NR injection. One additional mouse, upon necropsy, had developed an intra-peritoneal tumor, and its data were excluded from all analyses due to the atypical, extensive immune activation observed. To determine whether differences were dependent on specific tumor and stromal interactions, an additional group received orthotopic injections of the same volume of cells (67NR) into the 4th and 9th inguinal mammary fat pad.
Method Details
Transmitter implantation and biopotential recording
Following acclimation, mice were deeply anesthetized under isoflurane vapors (3% induction, 1.5% maintenance) and implanted with PhysioTel F20-EET (Data Sciences International [DSI], St. Paul, MN, USA) biotelemetry units to allow acquisition of electroencephalogram and electromyogram potentials as described previously (Borniger et al., 2015). Following immobilization in a stereotaxic apparatus, a midline incision was made extending between the caudal margin of the eyes and the midpoint of the scapulae. The skull was exposed and cleaned, and two stainless steel screws (00-96 × 1/16; Plastics One, Roanoke VA, USA) were inserted through the skull to make contact with the underlying dura mater. These screws served as cortical electrodes. One screw was placed 1 mm lateral to the sagittal suture and 1 mm rostral to Bregma. The other screw was placed contralaterally 2 mm from the sagittal suture and 2 mm caudal to Bregma. The transmitter was inserted into a subcutaneous pocket along the back of the animal. A set of leads was attached to the cortical electrodes and secured with dental cement. Another set of leads was inserted into the trapezius muscles for EMG measurement. The surgical procedures were performed using aseptic technique, and buprenorphine (0.05 mg/kg, SC) was administered to provide post-operative analgesia along with supplemental warmth (heating pad) until the animals were mobile. Following surgery, mice were singly housed and their cages were placed on top of receiver boards (RPC-1; DSI) in ventilated cabinets. These boards relay telemetered data to a data exchange matrix (DSI) and a computer running Ponemah software (version 6.1; DSI, St. Paul, MN, USA). Mice were allowed to recover from the surgery for two weeks prior to beginning sleep recordings.
Sleep deprivation
A separate cohort of mice (n=6/group) was used for analyses of the homeostatic response to sleep deprivation. Total sleep deprivation was accomplished via ‘gentle handling’ during the first six hours of the rest phase (ZT 0-6), followed by an 18h recovery period (Oyanedel et al., 2015). If EEG/EMG biopotentials showed signs of sleep and the animal displayed a sleeping posture, then the cage was gently tapped to arouse the mouse. As this method is dependent on live monitoring of EEG/EMG and sleep posture, this method cannot eliminate all sleep, and short episodes (< 10 sec) of ‘micro-sleep’ persisted.
Behavior
Sucrose Anhedonia
Mice were tested for anhedonia-like behavior on the sucrose preference test on days 22-24 post-injection. Food was removed from the cage at ZT 14 (lights off), and two water bottles (15 ml Falcon tubes with rubber stoppers) were weighed and placed into the hopper and the mouse could drink from these ad libitum for the next 6 h (after which they were weighed again). One bottle contained normal drinking water, and the other contained a 2% sucrose solution in standard drinking water. The first two nights were used to habituate mice to the two water bottle paradigm, and data from the final night were used to assess anhedonia-like behavior. Reduced sucrose preference in rodents is interpreted as an anhedonic response indicative of a depressive-like state (Bedrosian et al., 2011).
Open Field
The open field chamber consisted of a 40 × 40 cm transparent acrylic box flanked by two stacked grids of intersecting infra-red beam emitters/detectors. This allows for determination of mouse position and # of rears (an index of exploratory behavior). This test was completed immediately prior to the forced-swim test on day 25 post-injection. Mice were allowed to explore the open field for 30 min, and the first 5 min were scored for central tendency (an index of anxiety-like behavior) and # of rears, and the entire recording period was used to assess locomotor activity. These variables were scored automatically by Photobeam Activity System (PAS) software (San Diego Instruments, San Diego, CA).
Forced Swim Test
Mice were tested for depressive-like behavior using a 5 minute forced-swim test. Briefly, mice were placed into a clear 3000 ml containers filled with ~2000 ml room temperature water (~22°C) and videotaped for the next 5 minutes. Following testing, mice were patted dry and placed back into their home cage. Containers were emptied and cleaned (with 70% EtOH) between each test. The tape was analyzed (by an uninformed observer) for time spent swimming (i.e., vigorous swimming or scratching at the container wall) and time spent immobile (i.e., minimal movement necessary to keep head elevated above the water surface) and number of immobile and mobile bouts using Observer XT Software (8.0, Noldus Information Technology, Leesburg, VA, USA).
RNA extraction and quantitative RT-PCR
Following euthanasia via isoflurane overdose/decapitation, brains and livers were immediately dissected and placed into RNALater (Qiagen) on ice. RNA was extracted using TRIzol reagent (Invitrogen) according to the manufacturer’s instructions. RNA quality and quantity were determined using a spectrophotometer (NanoDrop), and cDNA was synthesized using M-MLV reverse transcription. 20 ng of cDNA/reaction was used in subsequent PCR. Taqman Fast advanced master mix (Life Technologies) containing AmpliTaq Fast DNA polymerase was used in a 20 μL duplex reaction with one of the primer/probe pairs listed in Supplementary Table 1 and a primer-limited primer/probe for the endogenous control eukaryotic 18s rRNA. The 2-step real-time PCR cycling conditions used were: 95°C for 20 s, 40 cycles of 95°C for 3 s, and then 60°C for 30 s. Relative gene expression was calculated using a relative standard curve of serially diluted pooled samples, and normalized to 18s rRNA signal.
Sympathetic denervation
To selectively ablate peripheral sympathetic nerve terminals, mice were injected (IP) with 6-hydroxydopamine (6-OHDA; 150 mg/kg in 0.01% ascorbic acid; Sigma) at days 19 and 20 following tumor cell inoculation. Tissue was collected at ZT 6 on day 25 and metabolic parameters were assessed. To verify successful denervation, spleens were homogenized for evaluation of norepinephrine concentrations (IBL America, Cat#IB89537).
Anti-IL-6 mAb administration
Three different cohorts of mice were injected bilaterally with 1 × 10⁵ 67NR cells in DMEM or DMEM alone as previously. Tumor growth was monitored daily. In the first cohort, at 23 days post-injection, mice were given a single 0.1 mg intraperitoneal (IP) injection (in 200 μl sterile PBS) of a rat monoclonal antibody against mouse IL-6 (R&D Systems, MAB406), or the IgG1 isotype control (MAB005) (as in (Bonapace et al., 2014). Tissue was collected ~75 h later during the early active phase (ZT 16), and hepatic metabolic parameters were examined via qPCR. A second cohort of mice was used to examine the effects of a singular IL-6 mAb treatment on sleep in tumor-bearing mice. The final cohort was injected with the anti-IL-6 mAb or the control IgG1 isotype control starting prior to when metabolic and sleep abnormalities appeared, and then throughout tumor growth (days 15, 19, and 23). Tissue was then collected on day 26.
Dose effects for the hepatic response to anti-IL-6 mAb were assessed using a negative control group (no tumor + IgG 0.5 mg), a positive control group (tumor + IgG 0.5 mg), and 5 × escalating doses of the mAb in tumor bearing mice (0.02, 0.1, and 0.5 mg) on day 23 post-injection (tissue collected on day 26).
Ghrelin administration
To assess sensitivity to ghrelin, tumor and non-tumor bearing mice were injected (IP) with rat/mouse ghrelin (30 μg/mouse) (Anaspec Cat# AS-24159) at day 25 post-67NR inoculation at the start of the active phase (ZT 14). Mouse weights were determined to be similar prior to injections. Injections were done after a 14 h fasting period. Food intake was measured during the first hour following ghrelin administration.
Almorexant (ALX) administration
Mice were injected with 67NR cells or the DMEM vehicle as above. On days 15, 18, 21, and 24 following injections, mice were administered (oral) 100 mg/kg Almorexant hydrochloride (ALX; MedChem Express) in H2O + 1.25% hydroxypropyl methyl cellulose/0.1% dioctyl sodium sulfosuccinate/0.25% methyl cellulose (vehicle) or the vehicle alone (Black et al., 2013), two hours prior to lights off (ZT 12). Tissue was collected at two circadian time points (ZT 6 and ZT 18) on day 25 following 67NR/DMEM injections.
For assessing the effects of ALX on sleep, mice were fitted with EEG/EMG biotelemeters as previously, and following two weeks recovery, were inoculated with 67NR cells. ALX or the vehicle was administered as above and sleep was monitored during baseline and during the final 5 days of recording (as in the anti-IL-6 experiment).
A final group was administered ALX or the vehicle in a full factorial design on days 15, 18, 21, and 24. During this time, food intake was monitored. Mice were fasted on the final night (night 24), and an IP GTT was conducted the following morning at ZT 1 (as below).
Intraperitoneal glucose, pyruvate, and lactate tolerance tests (GTT/PTT/LTT)
Mice were fasted overnight for 12 h (for GTT), or 16 h (for PTT/LTT). Following the fast, at ZT 1, baseline blood glucose was measured using a glucose meter (Bayer, Contour 7151G), and mice were intraperitoneally injected with 2 g kg−1 glucose, pyruvate, or lactate in isotonic saline. Glucose levels in blood were further measured at 15, 30, 60, 90, and 120 min intervals following injection to examine its clearance from circulation (GTT), or hepatic gluconeogenesis (PTT/LTT).
Assessment of Body Composition
To ascertain whether 67NR-generated tumors caused gross changes in body composition, we used nuclear magnetic resonance imaging (Echo MRI mouse, Echo Medical Systems, Houston, USA) to examine fat, lean, free water, and total water mass. No anesthesia was used for these scans (lasting 0.5-3.2 minutes/mouse). Data were generated from the average of 3 scans/mouse/day. Scans were completed at baseline, day 15, and day 25 following tumor cell implantation.
Cytokine protein quantification and enzyme immunoassays (EIAs)
To examine cytokine protein profiles in serum, tumors, cortex, and hippocampus, a 10-plex cytokine [V-Plex proinflammatory panel 1, Meso-Scale Discovery (MSD)] panel was completed according to the manufacturer’s instructions. This kit measures protein levels of IFN-γ, IL-10, IL-12p70, IL-1β, IL-2, IL-4, IL-5, IL-6, KC/GRO (CXCL1), and TNF-α. Serum corticosterone was determined using an enzyme immunoassay kit (DetectX, K014-H5, Arbor Assays, MI, USA). Samples were diluted with dissociation reagent and assay buffer 1:100. Plates were read on a plate reader at 450 nm and concentrations were determined using a 4-parameter logistic curve. Serum insulin concentrations were determined using a commercially available sandwich ELISA (Ultra Sensitive Mouse Insulin ELISA Kit, Crystal Chem, Downers Grove, IL, USA) according to the manufacturer’s instructions (wide-range protocol).
Serum Acyl-Ghrelin concentrations were determined using a commercially available kit (Rat/Mouse Ghrelin (active) ELISA, EZRGRA-90K, Millipore). Because acyl-ghrelin is extremely unstable, samples were processed immediately after collection (no freeze/thaw). Whole blood samples were placed into tubes containing Pefabloc (1 mg/ml) and allowed to clot for 30 min. Following centrifugation, serum samples were then transferred to tubes containing HCl at a final concentration of 0.05N prior to starting the assay. Serum leptin concentrations were determined using a commercially available assay (Mouse/Rat leptin Quantikine ELISA (MOB00), R&D Systems) in line with the manufacturer’s instructions.
Immunohistochemistry
F4/80 staining was completed to examine macrophage infiltration into 67NR-generated tumors. Tumors were post-fixed in 4% paraformaldehyde for 2-3 days and then dehydrated in 70% ethanol prior to paraffin embedding and downstream processing. Blocks were deparaffinized in xylene and rehydrated in distilled water. A 125°C antigen retrieval step was completed to unmask cloaked antigens prior to staining. Each of the following steps included appropriate wash steps in between. Slides were incubated in 3% hydrogen peroxide in methanol for 10 min followed by a serum-free protein block for 10 min, and then incubated with primary antibody (rat anti-F4/80 Serotec #MCA497G) (1:100 dilution) in Dako antibody diluent for 30 min. Then, sections were incubated with biotinylated rabbit anti-rat (1:200) 2° Ab in blocking solution for 30 min, followed by incubation in Vector RTU ABC Elite complex for 30 min. DAB was used as the chromogen for 5 min, and hematoxylin was used as a counterstain for 30 s. Sections were rinsed with tap water and 1% ammonium hydroxide, dehydrated in EtOH, cleared in xylene, and coverslipped.
cFos and Hypocretin-1 (orexin-a) or pro-MCH co-staining were completed on free-floating 30 μm cryostat sections in a separate cohort of animals. Following 5 × 10 min washes in PBS, sections were blocked in 2.5% normal donkey serum, 0.1% Triton-X100, and 0.01M PBS. Sections were then incubated for 24h at room temperature in primary antibodies (1:400; Goat anti-orexin-A #sc-8070 or goat anti-Pro-MCH (1:100) #sc-14509; rabbit anti-cfos (1:500) #sc-52) in blocking solution. Sections were washed 3 times in PBS, then incubated in donkey anti-goat and anti-rabbit secondary antibodies (1:200; Alexa-fluor 488 and 594), washed again and then mounted onto slides with VectaShield + DAPI mounting media (Vector Labs). Images containing hypocretin or MCH neurons were taken through the extent of the hypothalamus and the total number of hypocretin/orexin+ (or MCH+) and cFos+ cells were counted by a blinded observer.
Western blotting
Livers were homogenized in RIPA lysis buffer and 50 μg of protein lysate was resolved on Tris-glycine SDS-PAGE gels. Antibodies against Total STAT3 (1:1000), pSTAT3 (1:2000), Total AKT (1:1000), pAKT (1:2000), GAPDH (1:1000) (all from Cell Signaling) were used for Western blotting overnight at 4°C. Secondary antibodies (Donkey anti-rabbit (1:30,000) and Donkey anti-mouse (1:20,000) (Li-Cor)) were used for 1 hour at room temperature. Membranes were scanned using Li-Cor CLx Imager.
Sleep architecture and spectral analyses
Raw biopotentials were band pass filtered (0.3-25 Hz for EEG, and 25-50 Hz for EMG) and analyzed in 10s epochs via the automated rodent sleep scoring module in Neuroscore (DSI) as previously described (Borniger et al., 2015). Delta and theta ratio criteria, as well as EMG threshold values (for scoring of NREM, REM, and wake, respectively) were adjusted on a per-animal basis to ensure accurate scoring across the experimental set. The delta band was set at 0.5–4.0 Hz, and the theta band was set at 6-9 Hz. Artifact detection thresholds were set at 0.4 mV for both EMG and EEG, and if >10% of an epoch fell outside this threshold, the entire epoch was scored as artifact. Visual inspection of the EEG was conducted on a subset of recordings (3 days/animal) to further ensure accurate scoring. Wake was characterized by high frequency and low voltage EEG accompanied by high voltage EMG. NREM (i.e., slow wave sleep) sleep was characterized by low frequency and high voltage EEG (predominant delta), accompanied by low voltage EMG. REM (i.e., paradoxical) sleep was characterized by high frequency, low voltage EEG (predominant theta) and EMG values. 10 s epochs were collapsed into 2 h bins for subsequent graphing and statistical analyses.
For spectral analyses, biopotentials were visually inspected, cleaned of artifacts, and subjected to Fast-Fourier transforms. Periodogram data were collected in 10s epochs of scored data. 2-h bins of NREM spectral power data were compiled, normalized to % of total spectral power, and analyzed over the course of a day to visualize differences in diurnal variation in NREM delta power. Normalized power spectra for wake, NREM, and REM sleep were generated by comparing the spectral power during the first 6 hours following ALX treatment to the same time period on the previous (no treatment) day.
Quantification and Statistical Analysis
Outliers were removed a priori using the Grubb’s test. Group means were compared using Student’s t-tests. For the IL-6 antibody, 6-OHDA, and Almorexant (ALX) experiments, groups were compared using two-way ANOVAs with tumor status and treatment as independent variables, followed by Tukey’s multiple comparisons test. A two-tailed alpha of 0.05 was considered significant throughout. If data failed to meet the requirements for ANOVA, they were log(2) transformed. All statistical analyses were completed with SPSS Statistics software (version 22, IBM, Armonk, NY) or GraphPad Prism 6.0 (GraphPad Software, San Diego, CA, USA).
Supplementary Material
Highlights.
-
-
Tumors promote IL-6 driven inflammation and changes in metabolism and sleep.
-
-
This is associated with aberrant activity of hypocretin/orexin (HO) neurons.
-
-
Blocking HO signaling attenuated metabolic abnormalities and enhanced sleep quality.
-
-
Reduced leptin and sensitivity to ghrelin may contribute to altered HO activity.
Acknowledgments
The authors acknowledge the excellent care provided to the animals used in these studies from the OSU Laboratory Animal Resources personnel, specifically Melinda Weiss and Allison Woolum. We thank Karmanos Cancer Center for providing the murine cells used in our experiments, and thank the OSU Histology/Pathology Core for completing paraffin embedding/sectioning of our tumor samples. We thank the OSU small animal imaging core for assistance in the use of EchoMRI. We further acknowledge Jennifer Hollyfield, Yasmine Cisse, Monica Gaudier-Diaz, and Adam Hinzey. This research was supported by an NIH R21 grant 1R21CA191846 to RJN and Pelotonia and Presidential Fellowship to JCB.
Footnotes
Publisher's Disclaimer: This is a PDF file of an unedited manuscript that has been accepted for publication. As a service to our customers we are providing this early version of the manuscript. The manuscript will undergo copyediting, typesetting, and review of the resulting proof before it is published in its final citable form. Please note that during the production process errors may be discovered which could affect the content, and all legal disclaimers that apply to the journal pertain.
Author Contributions: JCB, WHWII designed, completed, analyzed all experiments and wrote the manuscript; S, NZ, AAZ, SLM, JAF, KME, ANS, CJB, TT, conducted experiments and provided editorial comments on the paper; UJM, and MBL designed experiments and edited the paper; RJN and ACD designed experiments and wrote and edited the manuscript.
Declaration of Interest
The authors declare no competing interests.
References
- Adamantidis A, de Lecea L. The hypocretins as sensors for metabolism and arousal. J Physiol. 2009;587:33–40. doi: 10.1113/jphysiol.2008.164400. [DOI] [PMC free article] [PubMed] [Google Scholar]
- Aslakson CJ, Miller FR. Selective Events in the Metastatic Process Defined by Analysis of the Sequential Dissemination of Subpopulations of a Mouse Mammary Tumor. Cancer Res. 1992;52:1399–1405. [PubMed] [Google Scholar]
- Bedrosian TA, Fonken LK, Walton JC, Haim A, Nelson RJ. Dim light at night provokes depression-like behaviors and reduces CA1 dendritic spine density in female hamsters. Psychoneuroendocrinology. 2011;36:1062–1069. doi: 10.1016/j.psyneuen.2011.01.004. [DOI] [PubMed] [Google Scholar]
- Ben-Shaanan TL, Azulay-Debby H, Dubovik T, Starosvetsky E, Korin B, Schiller M, Green NL, Admon Y, Hakim F, Shen-Orr SS, et al. Activation of the reward system boosts innate and adaptive immunity. Nat Med. 2016;22:940–944. doi: 10.1038/nm.4133. [DOI] [PubMed] [Google Scholar]
- Black SW, Morairty SR, Fisher SP, Chen TM, Warrier DR, Kilduff TS. Almorexant Promotes Sleep and Exacerbates Cataplexy in a Murine Model of Narcolepsy. Sleep. 2013;36:325–336. doi: 10.5665/sleep.2442. [DOI] [PMC free article] [PubMed] [Google Scholar]
- Bonapace L, Coissieux MM, Wyckoff J, Mertz KD, Varga Z, Junt T, Bentires-Alj M. Cessation of CCL2 inhibition accelerates breast cancer metastasis by promoting angiogenesis. Nature. 2014;515:130–133. doi: 10.1038/nature13862. [DOI] [PubMed] [Google Scholar]
- Bonnavion P, Jackson AC, Carter ME, de Lecea L. Antagonistic interplay between hypocretin and leptin in the lateral hypothalamus regulates stress responses. Nat Commun. 2015;6:6266. doi: 10.1038/ncomms7266. [DOI] [PMC free article] [PubMed] [Google Scholar]
- Borniger JC, Gaudier-Diaz MM, Zhang N, Nelson RJ, DeVries AC. Cytotoxic chemotherapy increases sleep and sleep fragmentation in non-tumor-bearing mice. Brain Behav Immun, Sleep, Brain, Behavior, and Immunity. 2015;47:218–227. doi: 10.1016/j.bbi.2014.11.001. [DOI] [PubMed] [Google Scholar]
- Bower JE, Ganz PA, Irwin MR, Kwan L, Breen EC, Cole SW. Inflammation and Behavioral Symptoms After Breast Cancer Treatment: Do Fatigue, Depression, and Sleep Disturbance Share a Common Underlying Mechanism? J Clin Oncol. 2011;29:3517–3522. doi: 10.1200/JCO.2011.36.1154. [DOI] [PMC free article] [PubMed] [Google Scholar]
- Castell JV, Gómez-lechón MJ, David M, Fabra R, Trullenque R, Heinrich PC. Acute-phase response of human hepatocytes: Regulation of acute-phase protein synthesis by interleukin-6. Hepatology. 1990;12:1179–1186. doi: 10.1002/hep.1840120517. [DOI] [PubMed] [Google Scholar]
- Colegio OR, Chu NQ, Szabo AL, Chu T, Rhebergen AM, Jairam V, Cyrus N, Brokowski CE, Eisenbarth SC, Phillips GM, et al. Functional polarization of tumour-associated macrophages by tumour-derived lactic acid. Nature. 2014;513:559–563. doi: 10.1038/nature13490. [DOI] [PMC free article] [PubMed] [Google Scholar]
- Contiero P, Berrino F, Tagliabue G, Mastroianni A, Mauro MGD, Fabiano S, Annulli M, Muti P. Fasting blood glucose and long-term prognosis of non-metastatic breast cancer: a cohort study. Breast Cancer Res Treat. 2013;138:951–959. doi: 10.1007/s10549-013-2519-9. [DOI] [PMC free article] [PubMed] [Google Scholar]
- Darnell JE. STATs and Gene Regulation. Science. 1997;277:1630–1635. doi: 10.1126/science.277.5332.1630. [DOI] [PubMed] [Google Scholar]
- Dauer DJ, Ferraro B, Song L, Yu B, Mora L, Buettner R, Enkemann S, Jove R, Haura EB. Stat3 regulates genes common to both wound healing and cancer. Oncogene. 2005;24:3397–3408. doi: 10.1038/sj.onc.1208469. [DOI] [PubMed] [Google Scholar]
- Eban-Rothschild A, Rothschild G, Giardino WJ, Jones JR, de Lecea L. VTA dopaminergic neurons regulate ethologically relevant sleep-wake behaviors. Nat Neurosci. 2016;19:1356–1366. doi: 10.1038/nn.4377. [DOI] [PMC free article] [PubMed] [Google Scholar]
- Estabrooke IV, McCarthy MT, Ko E, Chou TC, Chemelli RM, Yanagisawa M, Saper CB, Scammell TE. Fos Expression in Orexin Neurons Varies with Behavioral State. J Neurosci. 2001;21:1656–1662. doi: 10.1523/JNEUROSCI.21-05-01656.2001. [DOI] [PMC free article] [PubMed] [Google Scholar]
- Flint TR, Janowitz T, Connell CM, Roberts EW, Denton AE, Coll AP, Jodrell DI, Fearon DT. Tumor-Induced IL-6 Reprograms Host Metabolism to Suppress Anti-tumor Immunity. Cell Metab. 2016;24:672–684. doi: 10.1016/j.cmet.2016.10.010. [DOI] [PMC free article] [PubMed] [Google Scholar]
- Geerling JC, Mettenleiter TC, Loewy AD. Orexin neurons project to diverse sympathetic outflow systems. Neuroscience. 2003;122:541–550. doi: 10.1016/j.neuroscience.2003.07.008. [DOI] [PubMed] [Google Scholar]
- Grivennikov SI, Greten FR, Karin M. Immunity, Inflammation, and Cancer. Cell. 2010;140:883–899. doi: 10.1016/j.cell.2010.01.025. [DOI] [PMC free article] [PubMed] [Google Scholar]
- Håkansson M, De LL, Sutcliffe JG, Yanagisawa M, Meister B. Leptin receptor- and STAT3-immunoreactivities in hypocretin/orexin neurones of the lateral hypothalamus. J Neuroendocrinol. 1999;11:653–663. doi: 10.1046/j.1365-2826.1999.00378.x. [DOI] [PubMed] [Google Scholar]
- Hanahan D, Weinberg RA. Hallmarks of Cancer: The Next Generation. Cell. 2011;144:646–674. doi: 10.1016/j.cell.2011.02.013. [DOI] [PubMed] [Google Scholar]
- Hotamisligil GS. Inflammation and metabolic disorders. Nature. 2006;444:860–867. doi: 10.1038/nature05485. [DOI] [PubMed] [Google Scholar]
- Imeri L, Opp MR. How (and why) the immune system makes us sleep. Nat Rev Neurosci. 2009;10:199–210. doi: 10.1038/nrn2576. [DOI] [PMC free article] [PubMed] [Google Scholar]
- Inutsuka A, Inui A, Tabuchi S, Tsunematsu T, Lazarus M, Yamanaka A. Concurrent and robust regulation of feeding behaviors and metabolism by orexin neurons. Neuropharmacology. 2014;85:451–460. doi: 10.1016/j.neuropharm.2014.06.015. [DOI] [PubMed] [Google Scholar]
- Irwin MR, Wang M, Ribeiro D, Cho HJ, Olmstead R, Breen EC, Martinez-Maza O, Cole S. Sleep Loss Activates Cellular Inflammatory Signaling. Biol Psychiatry, Neurostimulatory and Neuroablative Treatments for Depression. 2008;64:538–540. doi: 10.1016/j.biopsych.2008.05.004. [DOI] [PMC free article] [PubMed] [Google Scholar]
- Laposky AD, Bass J, Kohsaka A, Turek FW. Sleep and circadian rhythms: Key components in the regulation of energy metabolism. FEBS Lett. 2008;582:142–151. doi: 10.1016/j.febslet.2007.06.079. [DOI] [PubMed] [Google Scholar]
- Lin X, Hong S, Huang J, Chen Yi, Chen Yufeng, Wu Z. Plasma Apolipoprotein A1 Levels at Diagnosis Are Independent Prognostic Factors in Invasive Ductal Breast Cancer. Discov Med. 2017;23:247–258. [PubMed] [Google Scholar]
- Lou Y, Preobrazhenska O, auf dem Keller U, Sutcliffe M, Barclay L, McDonald PC, Roskelley C, Overall CM, Dedhar S. Epithelial–mesenchymal transition (EMT) is not sufficient for spontaneous murine breast cancer metastasis. Dev Dyn. 2008;237:2755–2768. doi: 10.1002/dvdy.21658. [DOI] [PubMed] [Google Scholar]
- Lucassen EA, Rother KI, Cizza G. Interacting epidemics? Sleep curtailment, insulin resistance, and obesity. Ann N Y Acad Sci. 2012;1264:110–134. doi: 10.1111/j.1749-6632.2012.06655.x. [DOI] [PMC free article] [PubMed] [Google Scholar]
- Masri S, Papagiannakopoulos T, Kinouchi K, Liu Y, Cervantes M, Baldi P, Jacks T, Sassone-Corsi P. Lung Adenocarcinoma Distally Rewires Hepatic Circadian Homeostasis. Cell. 2016;165:896–909. doi: 10.1016/j.cell.2016.04.039. [DOI] [PMC free article] [PubMed] [Google Scholar]
- Michelson D, Snyder E, Paradis E, Chengan-Liu M, Snavely DB, Hutzelmann J, Walsh JK, Krystal AD, Benca RM, Cohn M, et al. Safety and efficacy of suvorexant during 1-year treatment of insomnia with subsequent abrupt treatment discontinuation: a phase 3 randomised, double-blind, placebo-controlled trial. Lancet Neurol. 2014;13:461–471. doi: 10.1016/S1474-4422(14)70053-5. [DOI] [PubMed] [Google Scholar]
- Nakazato M, Murakami N, Date Y, Kojima M, Matsuo H, Kangawa K, Matsukura S. A role for ghrelin in the central regulation of feeding. Nature. 2001;409:194–198. doi: 10.1038/35051587. [DOI] [PubMed] [Google Scholar]
- Opp MR, Toth LA. Neural-immune interactions in the regulation of sleep. Front Biosci. 2003;8:d768–779. doi: 10.2741/1061. [DOI] [PubMed] [Google Scholar]
- Oyanedel CN, Kelemen E, Scheller J, Born J, Rose-John S. Peripheral and central blockade of interleukin-6 trans-signaling differentially affects sleep architecture. Brain Behav Immun. 2015;50:178–185. doi: 10.1016/j.bbi.2015.07.001. [DOI] [PubMed] [Google Scholar]
- Palesh O, Aldridge-Gerry A, Zeitzer JM, Koopman C, Neri E, Giese-Davis J, Jo B, Kraemer H, Nouriani B, Spiegel D. Actigraphy-Measured Sleep Disruption as a Predictor of Survival among Women with Advanced Breast Cancer. Sleep. 2014;37:837–842. [Google Scholar]
- Protani M, Coory M, Martin JH. Effect of obesity on survival of women with breast cancer: systematic review and meta-analysis. Breast Cancer Res Treat. 2010;123:627–635. doi: 10.1007/s10549-010-0990-0. [DOI] [PubMed] [Google Scholar]
- Rui L, Yuan M, Frantz D, Shoelson S, White MF. SOCS-1 and SOCS-3 Block Insulin Signaling by Ubiquitin-mediated Degradation of IRS1 and IRS2. J Biol Chem. 2002;277:42394–42398. doi: 10.1074/jbc.C200444200. [DOI] [PubMed] [Google Scholar]
- Ryu TY, Park J, Scherer PE. Hyperglycemia as a Risk Factor for Cancer Progression. Diabetes Metab J. 2014;38:330–336. doi: 10.4093/dmj.2014.38.5.330. [DOI] [PMC free article] [PubMed] [Google Scholar]
- Sakurai T. Roles of orexin/hypocretin in regulation of sleep/wakefulness and energy homeostasis. Sleep Med Rev. 2005;9:231–241. doi: 10.1016/j.smrv.2004.07.007. [DOI] [PubMed] [Google Scholar]
- Taylor MM, Samson WK. The other side of the orexins: endocrine and metabolic actions. Am J Physiol - Endocrinol Metab. 2003;284:E13–E17. doi: 10.1152/ajpendo.00359.2002. [DOI] [PubMed] [Google Scholar]
- Tomayko MM, Reynolds CP. Determination of subcutaneous tumor size in athymic (nude) mice. Cancer Chemother Pharmacol. 1989;24:148–154. doi: 10.1007/BF00300234. [DOI] [PubMed] [Google Scholar]
- Toshinai K, Date Y, Murakami N, Shimada M, Mondal MS, Shimbara T, Guan JL, Wang QP, Funahashi H, Sakurai T, et al. Ghrelin-Induced Food Intake Is Mediated via the Orexin Pathway. Endocrinology. 2003;144:1506–1512. doi: 10.1210/en.2002-220788. [DOI] [PubMed] [Google Scholar]
- Tsuneki H, Sasaoka T, Sakurai T. Sleep Control, GPCRs, and Glucose Metabolism. Trends Endocrinol Metab. 2016;27:633–642. doi: 10.1016/j.tem.2016.06.011. [DOI] [PubMed] [Google Scholar]
- Vgontzas AN, Papanicolaou DA, Bixler EO, Lotsikas A, Zachman K, Kales A, Prolo P, Wong ML, Licinio J, Gold PW, et al. Circadian Interleukin-6 Secretion and Quantity and Depth of Sleep. J Clin Endocrinol Metab. 1999;84:2603–2607. doi: 10.1210/jcem.84.8.5894. [DOI] [PubMed] [Google Scholar]
- Villarreal-Garza C, Shaw-Dulin R, Lara-Medina F, Bacon L, Rivera D, Urzua L, Aguila C, Ramirez-Morales R, Santamaria J, Bargallo E, et al. Impact of Diabetes and Hyperglycemia on Survival in Advanced Breast Cancer Patients. J Diabetes Res. 2012;2012:e732027. doi: 10.1155/2012/732027. [DOI] [PMC free article] [PubMed] [Google Scholar]
- Weymann KB, Wood LJ, Zhu X, Marks DL. A role for orexin in cytotoxic chemotherapy-induced fatigue. Brain Behav Immun. 2014;37:84–94. doi: 10.1016/j.bbi.2013.11.003. [DOI] [PMC free article] [PubMed] [Google Scholar]
- Willie JT, Chemelli RM, Sinton CM, Yanagisawa M. To eat or to sleep? Orexin in the regulation of feeding and wakefulness. Annu Rev Neurosci. 2001;24:429–458. doi: 10.1146/annurev.neuro.24.1.429. [DOI] [PubMed] [Google Scholar]
- Yamanaka A, Beuckmann CT, Willie JT, Hara J, Tsujino N, Mieda M, Tominaga M, Yagami K, Sugiyama F, Goto K, et al. Hypothalamic Orexin Neurons Regulate Arousal According to Energy Balance in Mice. Neuron. 2003;38:701–713. doi: 10.1016/s0896-6273(03)00331-3. [DOI] [PubMed] [Google Scholar]
- Yi CX, Serlie MJ, Ackermans MT, Foppen E, Buijs RM, Sauerwein HP, Fliers E, Kalsbeek A. A Major Role for Perifornical Orexin Neurons in the Control of Glucose Metabolism in Rats. Diabetes. 2009;58:1998–2005. doi: 10.2337/db09-0385. [DOI] [PMC free article] [PubMed] [Google Scholar]
Associated Data
This section collects any data citations, data availability statements, or supplementary materials included in this article.