

Abstract
Aims/Introduction
To explore angiopoietin‐like protein 8 (ANGPTL‐8) levels, and its association with hepatocellular lipid content (HCL) and insulin resistance in patients with different extents of non‐alcoholic fatty liver disease (NAFLD).
Materials and Methods
In 48 adults were recruited, of which 12 had no NAFLD (HCL < 5.5%; group 1), 18 had mild NAFLD (5.5% ≤ HCL < 10.0%; group 2) and 18 had moderate‐to‐severe NAFLD (HCL ≥ 10.0%; group 3). The peripheral insulin sensitivity of all participants was monitored by a hyperinsulinemic‐euglycemic clamp (M value), as well as the magnetic resonance image of HCL. Serum ANGPTL‐8, blood glucose levels and lipid profiles were also recorded in the study.
Results
Group 3 had a worse metabolic profile, and had the highest ANGPTL‐8 level (1,129 ± 351 pg/mL vs 742 ± 252 pg/mL, 765 ± 301 pg/mL, P = 0.001) compared with those in group 1 and group 2. In all metabolic profiles, HCL positively correlated the strongest with ANGPTL‐8 (r = 0.436, P = 0.042). Multivariate stepwise linear regression analysis showed ANGPTL‐8 and alanine aminotransferase were independent determinants of HCL (P = 0.002, P < 0.001, respectively), and these two indexes explained 67.4% of the variation of HCL (P < 0.001).
Conclusions
ANGPTL‐8 was positively correlated with hepatocellular lipid content independent of obesity and insulin resistance, indicating that ANGPTL‐8 might be a new and important important predictor of the severity of NAFLD.
Keywords: Angiopoietin‐like protein 8, Hepatocellular lipid content, Non‐alcoholic fatty liver disease
Introduction
Non‐alcoholic fatty liver disease (NAFLD) has gained more and more attention in China as a result of a rising prevalence of approximately 15% in large cities1. NAFLD, ranging from non‐alcoholic simple steatosis to non‐alcoholic steatohepatitis (NASH), is characterized by hepatic fat accumulation coexistent with inflammation, impaired liver function and subsequent advanced fibrosis that increases the mortality risk in NAFLD patients2. In addition to hepatic consequences, NAFLD is also related to systemic metabolic complications, chronic kidney and cardiovascular disease, which contributes to liver‐related, and cardiovascular, overall mortality3, 4. Despite the severe damage caused by NAFLD, its underlying pathological mechanism (s) are not yet fully elucidated. The classic “two‐hit” hypothesis is that hepatic triglyceride (TG) accumulation sensitizes the liver to the second insults, such as oxidative stress, inflammatory factors and cytokines, all of which will finally result in NASH5. However, now this hypothesis is being challenged by some recent emerging evidence6, 7, 8, 9, 10, 11. A recent study found that NAFLD is increasingly viewed as a metabolic disorder, as other organs, such as adipose tissue, muscle and the intestine, play important roles in the pathogenesis of NAFLD and its complications12. Therefore, NAFLD is not merely considered as the hepatic manifestation of metabolic syndrome, but is assumed to precede the development of metabolic syndrome and type 2 diabetes, in which insulin resistance (IR) might play a major role13.
Angiopoietin‐like protein 8 (ANGPTL‐8; also known as betatrophin, hepatocellular carcinoma‐associated protein, re‐feeding‐induced in fat and liver protein, and lipasin)14, 15, 16, 17, 18 is mainly expressed in the liver in humans, and is highly enriched in the liver, brown adipose tissue and white adipose tissue in mice16. Mice lacking ANGPTL‐8 consistently show lower TG levels owing to enhanced plasma TG clearance by having increased post‐heparin lipoprotein lipase activity17, 19. Previous studies showed that ANGPTL‐8 was increased in NAFLD patients and those with liver cirrhosis, and was also highly expressed in palmitate‐treated HepG2, the liver of db/db mice and mice consuming a high‐fat diet19, 20. The relationship between ANGPTL‐8 and IR were also reported, most of which showed a positive correlation between them. von Loeffelholz et al.21 showed that weight loss reduced liver fat by 45% and circulating ANGPTL‐8 by 11%. ANGPTL‐8 was related to liver steatosis21. It is still in question whether increased ANGPTL‐8 in NAFLD resulted from hepatic fat accumulation or was only secondary to decreased insulin sensitivity in NAFLD. Given the potential effect of IR, relevant research would be warranted to elucidate the relationship between ANGPTL‐8 and NAFLD as possible of eliminating the influence of IR from both peripheral tissue (such as muscle) and the liver. Therefore, the present study aimed to explore ANGPTL‐8 and its relationship with hepatocellular lipid content (HLC) in NAFLD patients and peripheral IR, which was measured by a hyperinsulinemic‐euglycemic clamp and hepatic IR shown by homeostatic model assessment of insulin resistance (HOMA‐IR).
Methods
Study population
A total of 48 individuals, aged 40–65 years, were recruited from a national cohort study, “Early Recognition and Intervention Technology Study of Metabolic Syndrome,” which was initiated by Shanghai Sixth People's Hospital, between September 2013 and August 2014 in China. Individuals at high‐risk of NAFLD (because of the presence of obesity, metabolic syndrome, type 2 diabetes or abnormal plasma aminotransferases) were recruited in this study. The exclusion criteria were: (i) known history of cardiovascular disease; (ii) current treatment with system corticosteroids; (iii) cirrhosis with or without ascites; (iv) known hyperthyroidism or hypothyroidism; (v) severe disability and psychiatric disturbance; (vi) the presence of cancer; and (vii) pregnancy. Volunteers were also excluded if they had a history of alcohol abuse (>30 g/day for men and >20 g/day for women), type 1 diabetes or any liver disease other than NASH (i.e., hepatitis B or C, autoimmune hepatitis, hemochromatosis, Wilson's disease or drug‐induced hepatitis).
The study was approved by both the Ethics Committee of Shanghai Sixth People's Hospital and The First Affiliated Hospital of Sun Yat‐sen University, and written informed consent was obtained from each patient before their participation.
Measurements
Height and weight were measured, and body mass index (BMI; kg/m2) was calculated by dividing weight (kg) by squared height (m2). The waist circumferences were measured at the midpoint between the lowest rib and the uppermost lateral border of the right iliac crest. The hips circumferences were measured at their widest point, and the waist‐to‐hip ratio was calculated. Blood pressure was measured using a mercury sphygmomanometer at a resting state.
All blood samples were taken after an overnight fast for 10–12 h. Blood specimens were separated by centrifugation, and serum samples were stored at −80°C until analysis of ANGPTL‐8. A 75‐g glucose solution was given to every participant orally, and plasma glucose was measured at 30 min and 2 h after glucose administration. In all participants, fasting plasma glucose, 30‐min plasma glucose, 2‐h plasma glucose, fasting insulin, serum total cholesterol, TG, low‐density lipoprotein cholesterol, high‐density lipoprotein cholesterol, alanine aminotransferase (ALT), aspartate aminotransferase, gamma glutamyl transpeptidase, blood urea nitrogen, serum creatinine and hemoglobin A1c were measured. Serum betatrophin levels were measured using a commercially available human enzyme‐linked immunosorbent assay kit (catalog number E11644h; Wuhan Eiaab Science, Wuhan, China) with an intra‐assay coefficient of variation of ≤4.8% and an interassay coefficient of variation of ≤7.2%. Human ANGPTL‐8 enzyme‐linked immunosorbent assay kits were measured twice to ensure the reliability of the experiments according to the manufacturer's protocol.
Hyperinsulinemic‐euglycemic clamp
A hyperinsulinemic‐euglycemic clamp was used after a 10‐h fast on a different day. In brief, human regular insulin diluted in 0.9% saline was infused intravenously at a constant rate of 80 mU/m2 per min for 2 h. Fasting glucose was clamped at 5.6 mmol/L with a coefficient of variation <5% by titrating the infusion rate of 20% dextrose based on the measurement of the arterialized plasma glucose every 5 min22, 23. After 2 h of constant insulin infusion, steady‐state conditions can typically be achieved for plasma insulin, blood glucose and the glucose infusion rate. Assuming that the hyperinsulinemic state is sufficient to completely suppress hepatic glucose production, and as there is no net change in blood glucose concentrations under steady‐state clamp conditions, the glucose infusion rate must be equal to the glucose disposal rate (M value).
Hepatocellular lipid content measurement
Participants underwent an upper abdominal coil magnetic resonance imaging (MRI; 3‐Tesla whole‐body scanner; SIEMENS 3.0T MAGNETOM Verio; Siemens Healthcare Sector, Erlangen, Germany) examination that included an initial set of localizer images and the T1 volumetric interpolated breath‐hold examination Dixon sequence to calculate HCL, as previously described22, 24. A hepatocellular lipid content of >5.5% was considered a diagnosis of NAFLD, as previously defined25. According to the severity of NAFLD, volunteers were divided into three groups: group 1 (G1) had no NAFLD (HCL < 5.5%); group 2 (G2) had mild NAFLD (5.5 ≤ HCL < 10.0%); and group 3 (G3) had moderate‐to‐severe NAFLD (HCL ≥ 10.0%).
Calculations
HOMA‐IR values were calculated as fasting plasma glucose (mmol/L) × fasting insulin (μU/mL) / 22.5. HOMA of β‐cell function (HOMA‐β) values were calculated as 20 × fasting insulin (uU/mL) / (fasting plasma glucose [mmol/L] – 3.5). The estimated glomerular filtration rate values were calculated from creatinine levels using the CKD‐EPI formula.
Statistical analysis
Statistical analysis was carried out using SPSS 18.0 software (SPSS, Chicago, IL, USA). The data are presented as mean ±standard deviation (25th and 75th percentiles) for continuous variables. Continuous variables including log‐transformed variables, such as HOMA‐IR, TG and HCL, with normal distribution were compared by anova, those that neither followed a normal distribution nor were log transformed were compared using the Kruskal–Wallis H‐test (paired were compared using the Mann–Whitney U‐test). Correlation coefficients were analyzed using the Pearson correlation (normally distributed data) or Spearman's correlation (data not normally distributed). Analysis of covariance was used to adjust age, sex and BMI.
Results
Comparison of characteristics and serum ANGPTL‐8 levels in participants without or with different extents of NAFLD
The demographic and biochemical characteristics of all participants are summarized in Table 1. The distributions of age, sex, total cholesterol and low‐density lipoprotein cholesterol were not statistically different among groups. Compared with G1, G3 had a worse metabolic profile, such as severe obesity, higher prevalence of diabetes mellitus, increased blood pressure and so on. In contrast, high‐density lipoprotein cholesterol was significantly elevated and the M value was reduced in G3 when compared with those in G2.
Table 1.
Characteristics of participants with different extent of non‐alcoholic fatty liver disease
| Group 1 (HCL < 5.5%) | Group 2 (5.5% ≤ HCL < 10.0%) | Group 3 (HCL ≥ 10.0%) | P‐value | |
|---|---|---|---|---|
| n | 12 | 18 | 18 | |
| HCL (%) | 5.1 ± 0.2 | 7.6 ± 1.3 | 18.3 ± 4.8a , b | <0.0001 |
| Sex (male/female) | 6/6 | 7/11 | 8/10 | 0.832 |
| Age (years) | 52.2 ± 4.8 | 56.3 ± 4.9 | 51.9 ± 7.2 | 0.059 |
| NC (cm) | 34.2 ± 3.7 | 34.4 ± 2.7 | 35.8 ± 2.8 | 0.272 |
| BMI (kg/m2) | 23.6 ± 1.7 | 23.4 ± 2.1 | 26.8 ± 2.4a , b | <0.0001 |
| WHR | 0.86 ± 0.04 | 0.91 ± 0.05a | 0.94 ± 0.07a | 0.002 |
| SBP (mmHg) | 116 ± 14 | 120 ± 14 | 132 ± 19a , b | 0.024 |
| DBP (mmHg) | 71.8 ± 7.3 | 72.8 ± 9.8 | 80.4 ± 11.8a , b | 0.037 |
| FPG (mmol/L) | 5.2 ± 0.5 | 5.8 ± 1.4 | 7.0 ± 2.4a , b | 0.017 |
| PG30min (mmol/L) | 9.0 ± 1.84 | 10.6 ± 2.7 | 11.8 ± 2.5a | 0.015 |
| PG2h (mmol/L) | 6.5 ± 2.6 | 9.4 ± 4.0 | 13.2 ± 4.9a , b | <0.0001 |
| HBA1c (%) | 5.7 ± 0.5 | 6.2 ± 0.8 | 6.8 ± 1.2a | 0.006 |
| Diabetes (%) | 8.3 (1/12) | 27.8 (5/18) | 55.6 (10/18)b | <0.0001 |
| CHOL (mmol/L) | 5.2 ± 0.8 | 5.8 ± 1.0 | 5.6 ± 1.1 | 0.297 |
| TG (mmol/L) | 0.8 (0.7–1.2) | 1.4 (1.1–2.0)a | 1.5 (1.2–2.6)a | 0.002 |
| HDL‐c (mmol/L) | 1.6 (1.4–1.7) | 1.2 (1.0–1.3)a | 1.2 (1.0–1.5)a | 0.001 |
| LDL‐c (mmol/L) | 3.2 ± 0.76 | 4.10 ± 1.10 | 3.88 ± 0.87 | 0.055 |
| GFR (mL/min/1.73 m2) | 101 ± 23 | 93 ± 19 | 100 ± 18 | 0.458 |
| ALT (U/L) | 13 (11–17) | 19 (16–23)a | 28 (18–40)a | 0.001 |
| AST (U/L) | 18 (18–22) | 21 (191–23) | 22 (17–27) | 0.402 |
| GGT (U/L) | 18 (14–26) | 28 (21–49) | 32 (26–61)a | 0.008 |
| FINS (μU/mL) | 5.4 (3.6–5.7) | 4.7 (30.0–5.6) | 11.0 (8.1–14.4)a , b | <0.0001 |
| HOMA‐IR | 1.19 (0.73–1.44) | 0.98 (0.79–1.28) | 3.16 (2.03–3.40)a , b | <0.0001 |
| HOMA‐β | 65.0 (48.4–76.4) | 65.5 (23.3–86.7) | 76.1 (65.5–134.5) | 0.134 |
| M value (mg/kg/min) | 11.1 ± 2.4 | 7.9 ± 2.1a | 4.5 ± 1.8a , b | <0.0001 |
| ANGPTL‐8 (pg/mL) | 742 ± 252 | 765 ± 301 | 1,129 ± 351a , b | 0.001 |
ALT, alanine aminotransferase; AST, aspartate aminotransferase; BMI, body mass index; CHOL, total cholesterol; DBP, diastolic blood pressure; eGFR, estimated glomerular filtration rate; FINS, fasting insulin; FPG, fasting plasma glucose; GGT, gamma‐glutamyl transpeptidase; HbA1c, hemoglobin A1c; HCL, hepatocellular lipid content; HDL‐c, high‐density lipoprotein; HOMA‐IR, homeostatic model assessment of insulin resistance; HOMA‐β, homeostatic model assessment of β‐cell function; LDL‐c, low‐density lipoprotein; M value, Matsuda value calculated by hyperinsulinemic‐euglycemic clamp; PG2h, 2‐h plasma glucose during oral glucose tolerance test; PG30min, 30‐min plasma glucose during oral glucose tolerance test; SBP, systolic blood pressure; TG, triglyceride; WHR, waist‐to‐hip ratio.
Data are presented as the mean ± standard deviation or median (25th–75th).
Group 1 (no non‐alcoholic fatty liver disease [NAFLD]) vs group 2 (mild NAFLD) and group 3 (moderate‐to‐severe NAFLD) P < 0.05.
Group 2 vs group 3 P < 0.05.
More severe IR situations were also observed in G3, shown by both increased HOMA‐IR and decreased M value (all P < 0.05; Figure 1).
Figure 1.
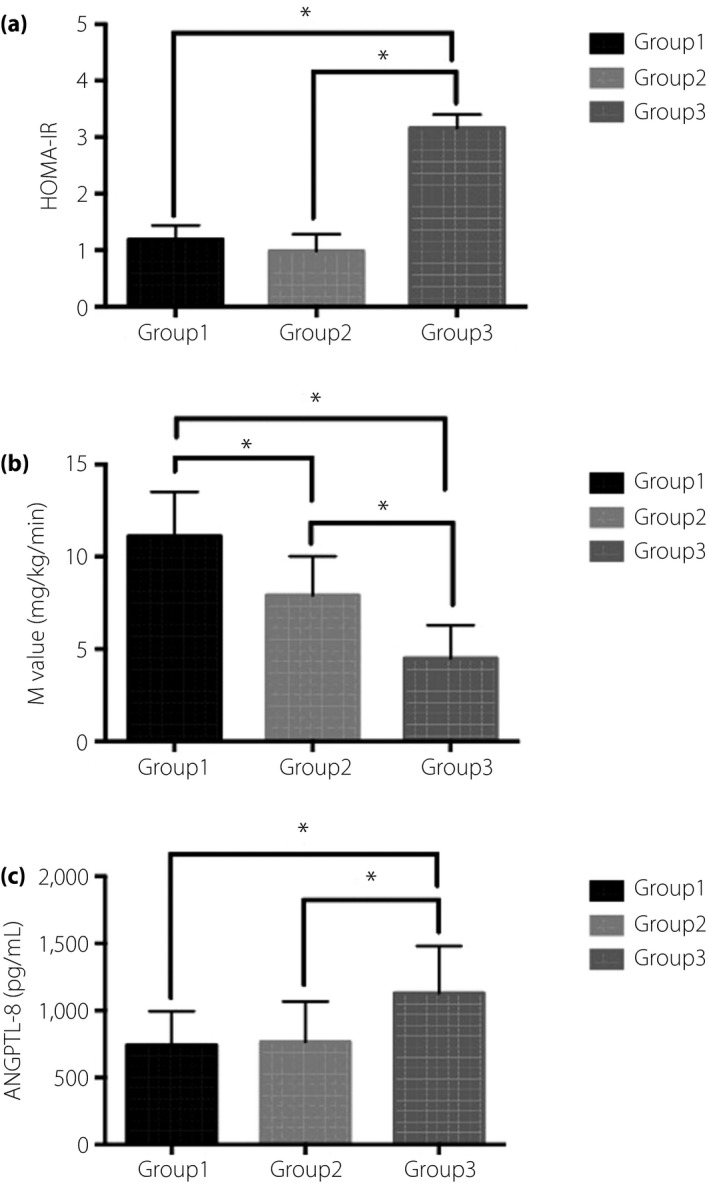
The (a) homeostatic model assessment of insulin resistance (HOMA‐IR), (b) M value and (c) angiopoietin‐like protein 8 (ANGPTL‐8) in different hepatocellular lipid content (HCL) groups (HCL < 5.5% for group 1, 5.5% ≤ HCL < 10.0% for group 2 and HCL ≥ 10.0% for group 3). More severe IR was observed in group 3, shown by both increased HOMA‐IR and decreased M value (group 3 vs group 1, group 2; HOMA‐IR: (3.16 [2.03–3.40] vs 1.19 [0.73–1.44], 0.98 (0.79–1.28), P < 0.05; M value: 4.5 ± 1.8 mg/kg/min vs 11.1 ± 2.4 mg/kg/min, 7.9 ± 2.1 mg/kg/min, P < 0.05). The M value of group 2 was significantly lower than group 1 (7.9 ± 2.1 mg/kg/min vs 11.1 ± 2.4 mg/kg/min, P < 0.05). Group 3 had a significantly increased ANGPTL‐8 compared with group 1 and group 2 (1,129 ± 351 pg/mL vs 742 ± 252 pg/mL, 765 ± 30 pg/mL, P = 0.001).
Serum ANGPTL‐8 levels ranged from 249 to 1,708 pg/mL, with a mean of 895 ± 354 pg/mL in the 48 participants. G3 had a significantly increased ANGPTL‐8 compared with G1 and G2 (1,129 ± 351 vs 742 ± 252 pg/mL, 765 ± 301 pg/mL, P = 0.001; Table 1; Figure 1). ANGPTL‐8 levels were comparable between G1 and G2.
Correlation of serum ANGPTL‐8 level and HCL in participants without or with different extents of NAFLD
HCL was positively associated with ANGPTL‐8 (r = 0.515, P < 0.001; Table 2), and the correlation parameter remained significant after adjusting age, sex and BMI (r = 0.463, P = 0.003; Table 2; Figure 2). After further adjusting the log HOMA‐IR and M value, ANGPTL‐8 (r = 0.436, P = 0.042) was still significantly related with HCL in individuals with NAFALD (G2 and G3).
Table 2.
Correlation analyses of hepatocellular lipid content or angiopoietin‐like protein 8 with metabolic profiles
| Log HCL | ANGPTL‐8 | |||||||
|---|---|---|---|---|---|---|---|---|
| Unadjusted | Adjusted for age, sex and BMI | Unadjusted | Adjusted for age, sex and BMI | |||||
| r | P‐value | r | P‐value | r | P‐value | r | P‐value | |
| BMI | 0.660 | 0.000 | 0.229 | 0.118 | ||||
| WHR | 0.489 | 0.001 | 0.376 | 0.018 | 0.276 | 0.058 | 0.233 | 0.138 |
| SBP | 0.352 | 0.022 | 0.202 | 0.219 | –0.003 | 0.985 | –0.066 | 0.677 |
| DBP | 0.347 | 0.024 | 0.041 | 0.805 | 0.187 | 0.202 | 0.126 | 0.425 |
| FPG | 0.426 | 0.005 | 0.384 | 0.017 | 0.104 | 0.481 | 0.185 | 0.242 |
| PG30min | 0.390 | 0.012 | 0.391 | 0.015 | 0.071 | 0.636 | –0.010 | 0.948 |
| PG2h | 0.507 | 0.001 | 0.436 | 0.006 | 0.260 | 0.078 | 0.240 | 0.126 |
| HbA1c | 0.455 | 0.002 | 0.359 | 0.027 | 0.233 | 0.111 | 0.114 | 0.471 |
| CHOL | 0.019 | 0.907 | –0.109 | 0.525 | –0.082 | 0.581 | –0.183 | 0.246 |
| TG | 0.412 | 0.007 | 0.337 | 0.044 | 0.184 | 0.211 | –0.063 | 0.692 |
| HDL‐c | –0.303 | 0.051 | –0.090 | 0.600 | –0.080 | 0.590 | –0.016 | 0.919 |
| LDL‐c | 0.013 | 0.936 | –0.177 | 0.301 | –0.050 | 0.734 | –0.138 | 0.383 |
| ALT | 0.457 | 0.002 | 0.449 | 0.006 | 0.163 | 0.270 | 0.062 | 0.696 |
| AST | 0.256 | 0.102 | 0.314 | 0.062 | –0.006 | 0.967 | 0.004 | 0.978 |
| GGT | 0.356 | 0.026 | 0.344 | 0.040 | 0.235 | 0.121 | 0.300 | 0.053 |
| log HOMA‐IR | 0.672 | 0.000 | 0.566 | 0.002 | 0.478 | 0.003 | 0.306 | 0.113 |
| log HOMA‐β | 0.362 | 0.045 | 0.304 | 0.115 | 0.349 | 0.034 | 0.292 | 0.132 |
| M value | −0.785 | 0.000 | –0.654 | 0.000 | –0.445 | 0.012 | –0.289 | 0.136 |
| ANGPTL‐8 | 0.515 | 0.000 | 0.463 | 0.003 | ||||
| HCL | 0.457 | 0.002 | 0.546 | 0.000 | ||||
ANGPTL‐8, angiopoietin‐like protein 8; ALT, alanine aminotransferase; ANGPTL‐8, angiopoietin‐like protein 8; AST, aspartate aminotransferase; CHOL, total cholesterol; DBP, diastolic blood pressure; eGFR, estimated glomerular filtration rate; FINS, fasting insulin; FPG, fasting plasma glucose; GGT, gamma‐glutamyl transpeptidase; HbA1c, hemoglobin A1c; HCL, hepatocellular lipid content; HDL‐c, high‐density lipoprotein; HOMA‐β, homeostatic model assessment of β‐cell function; LDL‐c, low‐density lipoprotein; M value, Matsuda value calculated by hyperinsulinemic‐euglycemic clamp; PG2h, 2‐h plasma glucose during oral glucose tolerance test; PG30 min, 30‐min plasma glucose during oral glucose tolerance test; SBP, systolic blood pressure; TG, triglyceride; WHR, waist‐to‐hip ratio.
Figure 2.
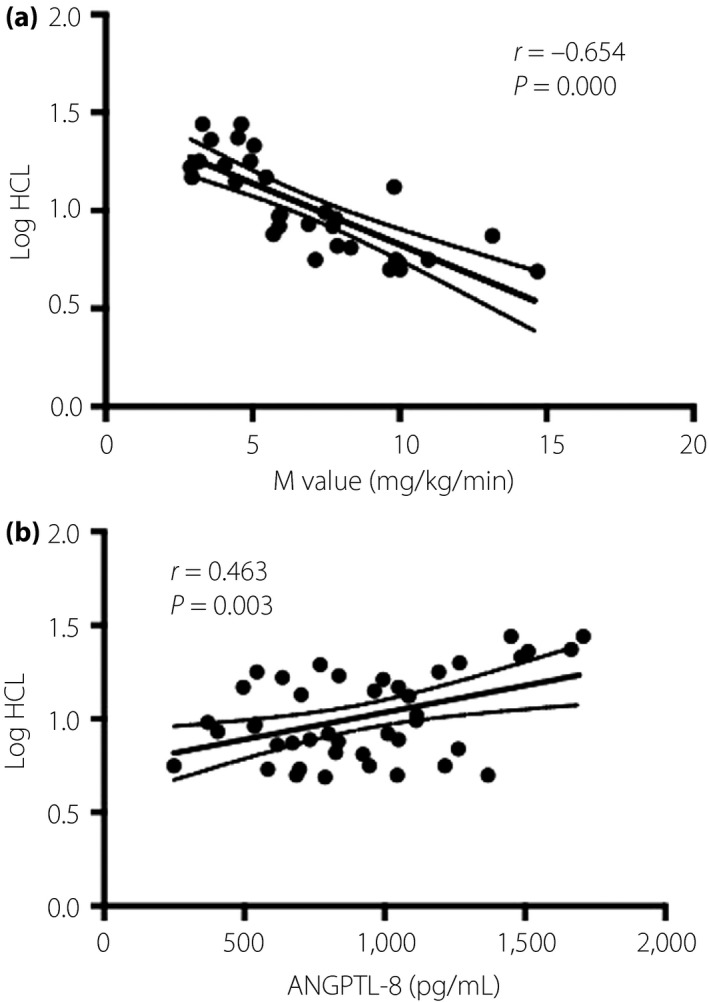
The relationship between, hepatocellular lipid content (HCL) with (a) M value and (b) angiopoietin‐like protein 8 (ANGPTL‐8). Log HCL significantly correlates with M value (r = −0.654, P = 0.000) and ANGPTL‐8 (r = 0.463, P = 0.003).
Correlation of HCL or serum ANGPTL‐8 with metabolic parameters
HCL was positively correlated with BMI (r = 0.66, P < 0.001) and waist‐to‐hip ratio (r = 0.489, P = 0.001; Table 2). HCL was significantly associated with metabolic profile; that is, blood pressure, blood glucose parameters, lipid profile in the univariate Pearson correlation analysis, and even after adjusting age, sex and BMI (Table 2). HCL was positively related with log HOMA‐IR (r = 0.672, P < 0.0001), and negatively related with M value (r = −0.785, P < 0.001), although the correlation weakened slightly after adjusting age, sex and BMI (Table 2; Figure 2). No significance of correlation between HOMA‐β and HCL was observed.
ANGPTL‐8 was positively correlated with waist‐to‐hip ratio, HOMA‐IR and HOMA‐β (P < 0.05), and was negatively related with M value (P < 0.05), which vanished after the adjustment of age, sex and BMI.
Multivariate stepwise linear regression analysis of HCL
To examine the contribution of age, sex, BMI, ALT, ANGPTL‐8, log HOMA‐IR and M value to HCL in all participants, multivariate stepwise linear regression analysis was used. When age, sex and BMI entered into the equation as covariates, it was ANGPTL‐8 (coefficient β = 0.007, P = 0.002) and ALT (coefficient β = 0.215, P < 0.001) that remained independent determinants of HCL, and explained 67.4% of its variation (P < 0.001). Similar results were obtained when such regression analysis was carried out only in patients with NAFLD.
Discussion
In the present study, we concluded that individuals with moderate‐to‐severe NAFLD diagnosed by MRI had increased serum ANGPTL‐8 in contrast to age‐ and sex‐matched healthy individuals and those with mild NAFLD. A positive correlation was observed between ANGPTL‐8 and HLC, which was independent of obesity and IR. In addition, on the basis of multivariate linear regression analysis, serum ANGPTL‐8 and ALT were defined as an independent predictor indicating the existence of significant NAFLD. The innovational point of the present study was that we first showed high serum ANGPTL‐8 might result from excessive hepatic lipid accumulation, rather than the provocation of IR in the background of NAFLD. From this assumption, serum ANGPTL‐8 was further confirmed to be a non‐invasive and independent indicator of the severity of NAFLD.
The results in the present study showed that serum ANGPTL‐8 in moderate‐to‐severe NAFLD patients increased by 52 and 48%, respectively, compared with that in those without or with mild NAFLD. The results were consistent with the study of von Loeffelholz et al.21, which showed that circulating ANGPTL‐8 was numerically increased in NAFLD patients compared with those with non‐NAFLD.
Although ANGPTL‐8 secretes almost uniquely from the liver in humans and is involved in lipid metabolism, the reciprocal effect of excessive hepatic lipid deposition and the expression of ANGPTL‐8 in the liver still need to be fully studied. ANGPTL‐8 increased in high‐fat diet‐fed mice and db/db or ob/ob mice, and was also highly induced by endoplasmic reticulum stress that was activated by hyperlipidemia or lipotoxicity20. In contrast, ANGPTL‐8 Gpihbp1 knockout mice showed decreased serum TG levels and its opposite phenotype (overexpression of ANGPTL‐8) severely increased TG levels, which probably resulted from the inhibition of ANGPTL‐8 to the lipoprotein lipase activity. These results showed that the expression of ANGPTL‐8 could modulate TG metabolism in mice19. Therefore, it seems that the expression of ANGPTL‐8 in the liver and hepatic lipid deposition could promote each other. However, such mechanisms need to be confirmed in humans. What we have learnt until now was that in human liver cells, ANGPTL‐8 can activate the autophagic process and mediate the regulation of thyroid hormone 3 in lipid metabolism19.
Another interesting finding of the present study was the positive relationship between serum ANGPTL‐8 and HCL. They were not influenced by the whole body and liver IR. In the multiple linear regression analysis, only ANGPTL‐8 and ALT were the independent determinants of HCL. Furthermore, the correlation between ANGPTL‐8 and IR indexes including HOMA IR and M value became non‐significant after adjusted for age, sex and BMI.
The positive correlation between ANGPTL‐8 and HCL also could be obtained from a population‐based study by Hu et al.26 However, the differences between the present study and their study might be the interpretation of the results: different methods (MRI vs ultrasound) were used to measure HCL, and a lack of adjustment of IR when assessing the correlation existed in that study. Additionally, increased ANGPTL‐8 was found in individuals with cirrhosis and was positively correlated with the severity of cirrhosis, which was speculated to be related to the existence of IR21, 27. However, such speculations cannot be approved by the results in the present study.
Contrary to the above speculations, we inferred that ANGPTL‐8 could be involved in the pathogenic process of NAFLD independent of the coexistence of IR. In a rodent study, the expression of ANGPTL‐8 was not associated with either mild age‐related IR in Wistar rats or with severe genetically‐based IR in Goto‐Kakizaki rats28. In the study by von Loeffelholz et al.21, after adjustment for age, circulating ANGPTL‐8 correlated with the insulin area under the curve, but this correlation disappeared after 45% liver lipid reduction with concomitant ANGPTL‐8 decrease21, which indirectly inflected the correlation between serum ANGPTL‐8 and HLC. However, further confirmation in humans and studies focused on related mechanism(s) are still required in future.
Increased serum ANGPTL‐8 can be observed in NAFLD patients in most studies excluding the one by Cengiz et al.29 In that study, serum ANGPTL‐8 decreased in NAFLD and NASH patients who had more severe liver steatosis and even fibrosis. In such settings, a large number of inflammatory cytokines were released, which could lead to a low expression of ANGPTL‐8.
The regulations of ANGPTL‐8 on lipid metabolism have been confirmed in rodent model studies; however, a consensus about the relationship between ANGPTL‐8 and serum lipid profile in humans has not yet been reached. In the present study, no significant correlation was observed after the adjustment, which was consistent with previous studies by Espes et al.30 and Hu et al.31 Some studies reported that serum ANGPTL‐8 decreased in patients with dyslipidemia and correlated with high‐density lipoprotein cholesterol or very low‐density lipoprotein levels15, 32. The reasons for the discrepancy of these clinical findings need to be elucidated further. The possible reasons might be the different population and methodology applied in these studies.
One of the main limitations of the present study was the cross‐sectional design, in which the causal relationship between ANGPTL‐8 and HCL in NAFLD cannot be concluded from this study. Another limitation was the relatively small sample size, which might reduce the statistical power of the results.
In summary, the present study showed that serum ANGPTL‐8 increased in individuals with moderate‐to‐severe NAFLD diagnosed by MRI and was positively correlated with hepatocellular lipid content, which was independent of obesity and IR. We speculate that ANGPTL‐8 could contribute to the pathogenesis of NAFLD independent of IR in the liver, and could be a potential therapy target of NAFLD. Further investigation is required to investigate the mechanism(s) of ANGPTL‐8 in the pathogenesis of NAFLD.
Disclosure
The authors declare no conflict of interest.
Acknowledgments
This study was funded by Industrial Technology Research and Development funding projects, Guangdong Province (no. 2012A030400006, 2014A020212436), Sun Yat‐sen University Clinical Research 5010 Program, Guangzhou Municipal Science and Technology special fund (no. 1346000270), Doctoral Fund of Ministry of Education, China (no. 20130171110067), Medical Scientific Research Foundation of Guangdong Province (no. A2015127), Chinese National Natural Science Foundation (no. 81572623), Key Medical Laboratory of Guangdong Province, and National Key Clinical Specialty Discipline Construction Program of China.
J Diabetes Investig 2018;9:952–958
References
- 1. Fan JG. Epidemiology of alcoholic and nonalcoholic fatty liver disease in China. J Gastroenterol Hapatol 2013; 28(Suppl 1): 11–17. [DOI] [PubMed] [Google Scholar]
- 2. Polyzos SA, Kountouras J, Zavos C. Nonalcoholic fatty liver disease: the pathogenetic roles of insulin resistance and adipocytokines. Curr Mol Med 2009; 9: 299–314. [DOI] [PubMed] [Google Scholar]
- 3. Rinella ME. Nonalcoholic fatty liver disease: a systematic review. JAMA 2015; 313: 2263–2273. [DOI] [PubMed] [Google Scholar]
- 4. Arora A, Sharma P. Non‐invasive diagnosis of fibrosis in non‐alcoholic fatty liver disease. J Clin Exp Hepatol 2012; 2: 145–155. [DOI] [PMC free article] [PubMed] [Google Scholar]
- 5. Day CP, James OF. Steatohepatitis: a tale of two “hits”. Gastroenterology 1998; 114: 842–845. [DOI] [PubMed] [Google Scholar]
- 6. EASL‐EASD‐EASO Clinical Practice Guidelines for the management of non‐alcoholic fatty liver disease. J Hepatol 2016; 64: 1388–1402. [DOI] [PubMed] [Google Scholar]
- 7. Li YY. Genetic and epigenetic variants influencing the development of nonalcoholic fatty liver disease. World J Gastroenterol 2012; 18: 6546–6551. [DOI] [PMC free article] [PubMed] [Google Scholar]
- 8. Hotamisligil GS. Endoplasmic reticulum stress and the inflammatory basis of metabolic disease. Cell 2010; 140: 900–917. [DOI] [PMC free article] [PubMed] [Google Scholar]
- 9. Zhang XQ, Xu CF, Yu CH, et al Role of endoplasmic reticulum stress in the pathogenesis of nonalcoholic fatty liver disease. World J Gastroenterol 2014; 20: 1768–1776. [DOI] [PMC free article] [PubMed] [Google Scholar]
- 10. Lozupone CA, Stombaugh JI, Gordon JI, et al Diversity, stability and resilience of the human gut microbiota. Nature 2012; 489: 220–230. [DOI] [PMC free article] [PubMed] [Google Scholar]
- 11. Kahali B, Halligan B, Speliotes EK. Insights from genome‐wide association analyses of nonalcoholic fatty liver disease. Semin Liver Dis 2015; 35: 375–391. [DOI] [PMC free article] [PubMed] [Google Scholar]
- 12. Haas JT, Francque S, Staels B. Pathophysiology and mechanisms of nonalcoholic fatty liver disease. Annu Rev Physiol 2016; 78: 181–205. [DOI] [PubMed] [Google Scholar]
- 13. Lonardo A, Ballestri S, Marchesini G, et al Nonalcoholic fatty liver disease: a precursor of the metabolic syndrome. Dig Liver Dis 2015; 47: 181–190. [DOI] [PubMed] [Google Scholar]
- 14. Yi P, Park JS, Melton DA. Betatrophin: a hormone that controls pancreatic β cell proliferation. Cell 2013; 153: 747–758. [DOI] [PMC free article] [PubMed] [Google Scholar] [Retracted]
- 15. Fenzl A, Itariu BK, Kosi L, et al Circulating betatrophin correlates with atherogenic lipid profiles but not with glucose and insulin levels in insulin‐resistant individuals. Diabetologia 2014; 57: 1204–1208. [DOI] [PubMed] [Google Scholar]
- 16. Zhang R. Lipasin, a novel nutritionally‐regulated liver‐enriched factor that regulates serum triglyceride levels. Biochem Biophys Res Commun 2012; 424: 786–792. [DOI] [PubMed] [Google Scholar]
- 17. Ren G, Kim JY, Smas CM. Identification of RIFL, a novel adipocyte‐enriched insulin target gene with a role in lipid metabolism. Am J Physiol Endocrinol Metab 2012; 303: E334–E351. [DOI] [PMC free article] [PubMed] [Google Scholar]
- 18. Quagliarini F, Wang Y, Kozlitina J, et al Atypical angiopoietin‐like protein that regulates ANGPTL3. Proc Natl Acad Sci USA 2012; 109: 19751–19756. [DOI] [PMC free article] [PubMed] [Google Scholar]
- 19. Zhang R. The ANGPTL3‐4‐8 model, a molecular mechanism for triglyceride trafficking. Open Biol 2016; 6: 150272. [DOI] [PMC free article] [PubMed] [Google Scholar]
- 20. Lee YH, Lee SG, Lee CJ, et al Association between betatrophin/ANGPTL8 and non‐alcoholic fatty liver disease: animal and human studies. Sci Rep 2016; 6: 24013. [DOI] [PMC free article] [PubMed] [Google Scholar]
- 21. von Loeffelholz C, Pfeiffer AFH, Lock JF, et al ANGPTL8 (betatrophin) is expressed in visceral adipose tissue and relates to human hepatic steatosis in two independent clinical collectives. Horm Metab Res 2017; 49: 343–349. [DOI] [PubMed] [Google Scholar]
- 22. Hong BS, Li Y, Lai S, et al Ectopic fat deposition on insulin sensitivity: correlation of hepatocellular lipid content and M value. J Diabetes Res 2016; 2016: 3684831. [DOI] [PMC free article] [PubMed] [Google Scholar]
- 23. Muniyappa R, Lee S, Chen H, et al Current approaches for assessing insulin sensitivity and resistance in vivo: advantages, limitations, and appropriate usage. Am J Physiol Endocrinol Metab 2008; 294: E15–E26. [DOI] [PubMed] [Google Scholar]
- 24. Dong Z, Luo Y, Zhang Z, et al MR quantification of total liver fat in patients with impaired glucose tolerance and healthy subjects. PLoS One 2014; 9: e111283. [DOI] [PMC free article] [PubMed] [Google Scholar]
- 25. Szczepaniak LS, Nurenberg P, Leonard D, et al Magnetic resonance spectroscopy to measure hepatic triglyceride content: prevalence of hepatic steatosis in the general population. Am J Physiol Endocrinol Metab 2005; 288: E462–E468. [DOI] [PubMed] [Google Scholar]
- 26. Hu W, Shao X, Guo D, et al Relationship of serum betatrophin with nonalcoholic fatty liver in a Chinese population. PLoS One 2017; 12: e0170758. [DOI] [PMC free article] [PubMed] [Google Scholar]
- 27. Arias‐Loste MT, García‐Unzueta MT, Llerena S, et al Plasma betatrophin levels in patients with liver cirrhosis. World J Gastroenterol 2015; 21: 10662–10668. [DOI] [PMC free article] [PubMed] [Google Scholar]
- 28. Cahová M, Habart D, Olejár T, et al Lipasin/betatrophin is differentially expressed in liver and white adipose tissue without association with insulin resistance in Wistar and Goto‐Kakizaki rats. Physiol Res 2017; 66: 273–281. [DOI] [PubMed] [Google Scholar]
- 29. Cengiz M, Ozenirler S, Kocabiyik M. Serum β‐trophin level as a new marker for noninvasive assessment of nonalcoholic fatty liver disease and liver fibrosis. Eur J Gastroenterol Hepatol 2016; 28: 57–63. [DOI] [PubMed] [Google Scholar]
- 30. Espes D, Lau J, Carlsson PO. Increased circulating levels of betatrophin in individuals with long‐standing type 1 diabetes. Diabetologia 2014; 57: 50–53. [DOI] [PMC free article] [PubMed] [Google Scholar]
- 31. Hu H, Sun W, Yu S, et al Increased circulating levels of betatrophin in newly diagnosed type 2 diabetic patients. Diabetes Care 2014; 37: 2718–2722. [DOI] [PubMed] [Google Scholar]
- 32. Fu Z, Berhane F, Fite A, et al Elevated circulating lipasin/betatrophin in human type 2 diabetes and obesity. Sci Rep 2014; 4: 5013. [DOI] [PMC free article] [PubMed] [Google Scholar]