Abstract
Aims/Introduction
To measure longitudinal changes in resting energy expenditure and body composition of Japanese pregnant women with or without diabetes.
Materials and Methods
The study population consisted of women who had delivered a live singleton neonate after 22 weeks’ gestation at Okayama University Hospital from July 2013 to June 2017. Resting energy expenditure and body composition were measured in the first trimester, second trimester, third trimester and postpartum.
Results
A total of 144 women participated in this study: 103 with normal glucose tolerance and 41 with diabetes. The resting energy expenditure (kcal/day) of pregnant women with normal glucose tolerance was significantly higher in the third trimester (1,644 ± 234) than in the first (1,461 ± 215) and second trimesters (1,491 ± 219), and postpartum (1,419 ± 254), whereas that of pregnant women with diabetes did not significantly change during all periods (1,568 ± 404, 1,710 ± 332, 1,716 ± 251, 1,567 ± 249). The resting energy expenditure of women with good glycemic control was lower than that of women with poor control. Fat‐free mass was closely correlated with resting energy expenditure.
Conclusions
The resting energy expenditure of Japanese pregnant women with normal glucose tolerance was significantly increased in the third trimester. The resting energy expenditure of women with good glycemic control was lower than that of women with poor control. Resting energy expenditure and fat‐free mass are potential indexes for medical nutrition therapy in pregnant women with diabetes.
Keywords: Diabetes, Fat‐free mass, Resting energy expenditure
Introduction
The number of patients with diabetes mellitus is rapidly increasing worldwide. The world's diabetic population is predicted to exceed 438 million in 20301. New diagnostic criteria of gestational diabetes mellitus (GDM) were proposed by the International Association of Diabetes and Pregnancy Study Groups in March 20102, and have been used in Japan since July 2010. Pregnancy complications related to diabetes have increased after using these new criteria. Medical nutrition therapy (MNT) is one of the most important interventions for pregnant women with diabetes. The Standards of Medical Care in Diabetes published by the American Diabetes Association recommend that individuals who have prediabetes or diabetes should receive individualized MNT, preferably provided by a registered dietitian familiar with the components of diabetic MNT3. In Japan, the Ministry of Health, Labor and Welfare proposes the addition of a step‐by‐step energy intake for Japanese pregnant women with normal glucose tolerance from the first trimester to the third trimester or postpartum. By contrast, the MNT of pregnant women with diabetes is controversial, because related evidence is insufficient.
Resting energy expenditure (REE) accounts for approximately 70% of total energy expenditure per day, and REE increases by approximately 20% in late pregnancy because of increased maternal body mass4. Few studies have been carried out on the REE of pregnant women with diabetes, and REE is determined primarily by fat‐free mass (FFM)5. Therefore, REE and FFM can be helpful indexes to assess the MNT of pregnant women with diabetes.
In the present study, we aimed to measure longitudinal changes in the REE of Japanese pregnant women with or without diabetes and propose appropriate MNT. We also evaluated the changes in fat mass (FM) and FFM.
Methods
The present study was carried out with the permission of the research ethics committee of Okayama University Medical Department. We obtained informed consent from all patients.
Population and data sources
The study population consisted of women who had their prenatal care and delivery of a live singleton neonate after 22 weeks’ gestation at Okayama University Hospital, Okayama, Japan, from July 2013 to June 2017.
Exclusion criteria
Women who met any of following criteria were excluded from the study: refusing to participate, taking steroid medication, diagnosed with thyroid disease, long‐term admission for threatened labor or other reasons and unable to undergo examination.
Oral glucose tolerance test
Participants underwent a 2‐h 75‐g oral glucose tolerance test (OGTT) when their random plasma glucose level was ≥100 mg/dL in the first trimester (G1; as early gestational age as possible) and second trimester (G2; between 24 and 32 weeks’ gestation). Participants with a history of diabetes mellitus before pregnancy did not undergo a 2‐h 75‐g OGTT. The OGTT results were used to identify women with GDM or overt diabetes in pregnancy following the recommendation of the Japanese Society of Diabetes and Pregnancy based on the International Association of Diabetes and Pregnancy Study Groups guideline (GDM can be identified by at least one OGTT value: fasting glucose level ≥92 mg/dL, 1 h ≥ 180 mg/dL or 2 h ≥ 153 mg/dL; overt diabetes in pregnancy: fasting glucose level ≥126 mg/dL or hemoglobin A1c ≥6.5%)3.
MNT
We advised all pregnant women with diabetes of the daily energy intake (prepregnancy body mass index [BMI] <25 kg/m2: ideal bodyweight × 30 + 200 kcal/day, prepregnancy BMI ≥25 kg/m2: ideal bodyweight × 30 kcal/day). They were instructed to carry out self‐monitoring blood glucose. Patients with prebreakfast fasting blood glucose level of >95 mg/dL, preprandial glucose level of >100 mg/dL and/or postprandial glucose level of >120 mg/dL received insulin treatment.
Obstetric and neonatal outcomes
Medical records were used to obtain data regarding maternal age, height, prepregnancy weight, total weight gain during pregnancy, weeks of delivery, mode of delivery, newborn birthweight, perinatal complication, neonatal complication value of cord C‐peptide and treatment of diabetes. The prenatal and neonatal complications included the outcomes that have been established in the hyperglycemia and adverse pregnancy outcome study6; that is, primary outcome (birthweight >90th percentile, primary cesarean section, clinical neonatal hypoglycemia, cord serum C‐peptide >90th percentile) and/or secondary outcome (pre‐eclampsia, preterm delivery [<37 weeks], sum of skinfolds >90th percentile, percent body fat >90th percentile).
REE and body composition were measured in G1 (up to 15 gestational weeks), G2 (16–27 weeks), G3 (28 weeks to delivery) and postpartum (P; 4–5 weeks after delivery).
REE
We used a handheld indirect calorimeter (MedGem; Microlife, Inc., Golden, CO, USA) to assess REE. All participants were examined for 4 h after oral intake of food and a 15‐ min resting time in a semi‐recumbent position. They were then instructed to place disposable plastic nose clips on their nose and breathe through the mouthpieces. Oxygen concentration in inspired and expired airflow was measured using an ultrasonic sensor. The MedGem device was programmed to begin collecting data when the first breath was detected, and continued until either a steady state or 10 min was reached. The accuracy and reliability of this device have been evaluated in several studies7, 8, 9. To calculate REE from measured oxygen consumption, the MedGem device uses the Weir equation (De Weir, 1949), which is the universal standard for the conversion of gas exchange measurements into REE:
The MedGem device does not measure CO2 production. Instead, it uses the abbreviated version of the Weir equation (De Weir, 1949), which calculates REE using only oxygen consumption:
A constant of 0.85 is used for the respiratory quotient. REE was calculated using the following equation:
Bioelectric impedance analysis
We used a foot‐to‐foot bioelectric impedance analysis system (TANITA MC‐180; TANITA, Tokyo, Japan) to measure impedance. The participants stood erect with bare feet on the analyzer's footpads. When they held the grips, measurements were carried out. The electric current was supplied from the electrodes on the tips of the toes and fingers, and the machine measured the voltage on the heels of both feet and near the sides of both hands. Analyses of weight, muscle volume, FM, FFM, total body water and body fat percentages were then carried out. We used the maternity mode to correct the weight of the fetus according to the gestational age. Several studies have been carried out to determine the accuracy and reliability of the bioelectric impedance analysis device10, 11, 12.
Statistical analysis
Differences in maternal age, height, prepregnancy weight, prepregnancy BMI, total weight gain during pregnancy and newborn birthweight between women with normal glucose tolerance and those with diabetes were evaluated using the t‐test. Differences among REE mean continuous variables were evaluated using the t‐test or anova with a standard Tukey honestly significant difference adjustment for multiple comparisons. Differences among the data of bioelectric impedance analysis mean continuous variables were evaluated using the Mann–Whitney U‐test or Kruskal–Wallis test with a standard Scheffé honestly significant difference adjustment for multiple comparisons.
Results
A total of 208 women agreed to participate in the present study. Of these, 64 women were excluded according to the exclusion criteria. Consequently, 144 women were included: 103 pregnant women with normal glucose tolerance and 41 with diabetes (GDM: 27, overt diabetes in pregnancy: 3, type 1 diabetes: 6, type 2 diabetes: 5). The characteristics of the participants are shown in Table 1. Prepregnancy bodyweight and BMI of pregnant women with diabetes were higher than those of pregnant women with normal glucose tolerance. Newborn birthweight and perinatal prognosis were not significantly different between the two groups.
Table 1.
Characteristics of the participants
| No diabetes (n = 103) | Diabetes (n = 41) | P | |
|---|---|---|---|
| Age (years) | 33.7 ± 5.7 | 33.7 ± 5.8 | NS |
| Height (cm) | 157.6 ± 6.5 | 158.1 ± 4.4 | NS |
| Prepregnancy weight (kg) | 54.3 ± 10.0 | 63.5 ± 12.7 | <0.01 |
| Ideal bodyweight (kg) | 54.7 ± 4.5 | 54.9 ± 2.8 | NS |
| Prepregnancy BMI (kg/m2) | 21.8 ± 3.4 | 25.4 ± 4.9 | <0.01 |
| Total weight gain during pregnancy (kg) | 8.3 ± 3.3 | 7.7 ± 5.2 | NS |
| Weeks of delivery (weeks) | 38.9 ± 1.3 | 38.4 ± 1.7 | NS |
| Mode of delivery (%) | |||
| Vaginal | 68.0 | 65.8 | |
| Emergency cesarean section | 6.8 | 24.4 | |
| Elective cesarean section | 25.2 | 9.8 | |
| Newborn birthweight (g) | 2939.5 ± 360.5 | 3108.9 ± 650.1 | NS |
| Primiparous women (%) | 59.2 | 56.1 | NS |
| Prenatal and neonatal complications (%) | 18.4 | 46.3 | NS |
Data are shown as mean ± standard deviation. NS, not significant.
Measured values of REE, FM and FFM are shown in Table 2. The REE of pregnant women with normal glucose tolerance was significantly higher in G3 than in G1, G2, and P. The REE of pregnant women with diabetes showed similar, but not significant, trends (Figure 1). The REE of overweight pregnant women with normal glucose tolerance was significantly higher during all periods than that of normal weight or underweight women. However, the REE of overweight pregnant women with diabetes was not significantly different from that of normal weight or underweight women after G3 (Figure 2). Pregnant women with poor glycemic control (hemoglobin A1c ≥6.2% or glycated albumin ≥15.8%) showed higher REE during all periods than those with normal glucose tolerance. Conversely, the REE of women with good glycemic control (hemoglobin A1c <6.2% and glycated albumin <15.8%) was not significantly different from that of pregnant women with normal glucose tolerance (Figure 3). The REE of women with good glycemic control was lower than that of women with poor glycemic control (Figure 4). All groups showed no significant changes in FM. The FFM of pregnant women with normal glucose tolerance was significantly higher in G3 than in G1, G2 and P (Figure 5).
Table 2.
Measured resting energy expenditure, fat mass and fat‐free mass
| No diabetes (n = 103) | Diabetes (n = 41) | |||||||
|---|---|---|---|---|---|---|---|---|
| G1 | G2 | G3 | P | G1 | G2 | G3 | P | |
| Week of pregnancy | 12.6 ± 1.8 | 24.9 ± 1.7 | 34.6 ± 1.7 | – | 11.8 ± 3.0 | 24.9 ± 1.8 | 34.1 ± 2.0 | – |
| REE (kcal/day) | 1.461 ± 215 | 1.491 ± 219 | 1.644 ± 234†‡§ | 1.419 ± 254 | 1.568 ± 404 | 1.710 ± 332 | 1.716 ± 251 | 1.567 ± 249 |
| FM (kg) | 14.7 ± 5.9 | 17.6 ± 7.3 | 17.8 ± 6.7 | 16.8 ± 6.5 | 25.2 ± 9.4 | 22.9 ± 9.2 | 22.3 ± 8.9 | 22.9 ± 9.5 |
| FFM (kg) | 37.0 ± 3.2 | 39.7 ± 4.8 | 43.3 ± 4.8†‡§ | 37.6 ± 8.4 | 43.0 ± 5.7 | 42.6 ± 3.2 | 46.8 ± 6.6 | 40.4 ± 4.3 |
Data are shown as mean ± standard deviation. †Significant difference from the first trimester (G1). ‡Significant difference from the second trimester (G2). §Significant difference from postpartum (P). FFM, fat‐free mass; FM, fat mass; G3, third trimester; REE, resting energy expenditure.
Figure 1.
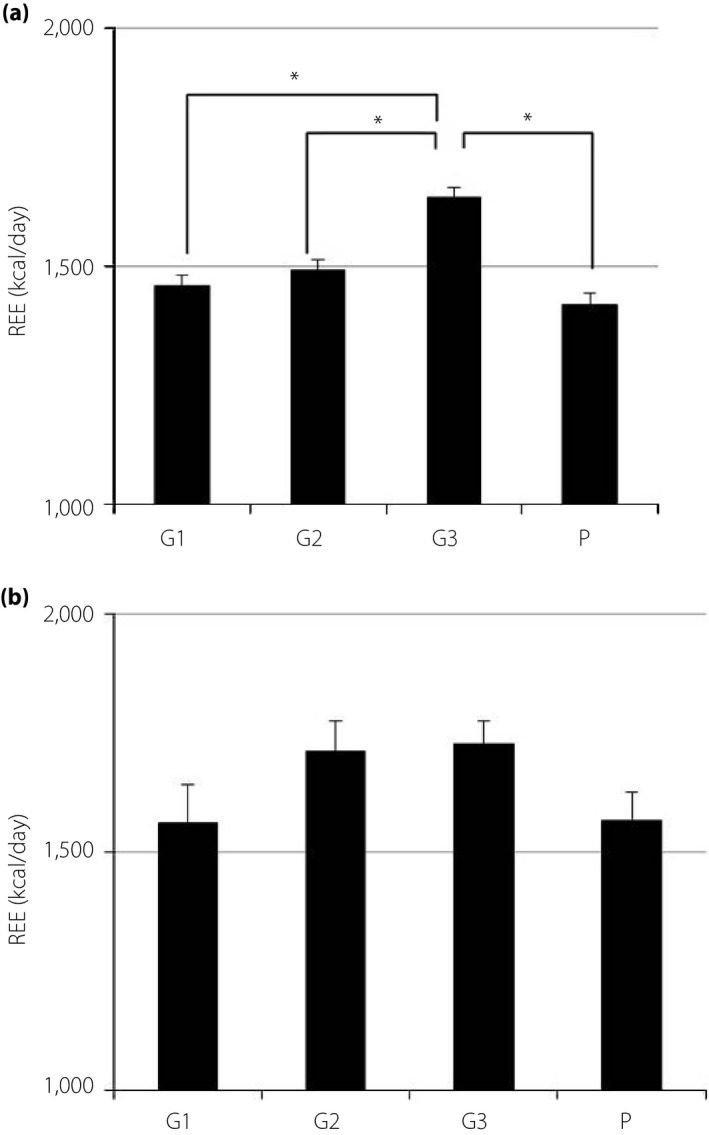
Resting energy expenditure (REE) in Japanese women during and after pregnancy (REE data are expressed as kilocalories per day. The height of each bar represents the mean ± standard error). (a) No diabetes (n = 103). (b) Diabetes (n = 41). *P < 0.05. G1, first trimester; G2, second trimester; G3, third trimester; P, postpartum.
Figure 2.
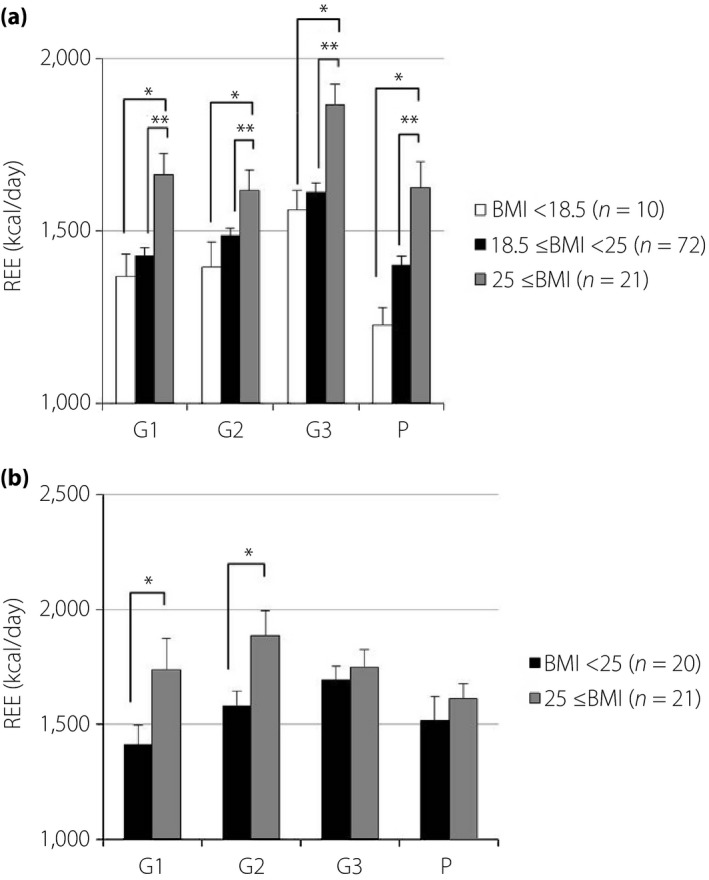
Associations between resting energy expenditure (REE) and prepregnancy body mass index (BMI; REE data are expressed as kilocalories per day. The height of each bar represents the mean ± standard error). (a) No diabetes. (b) Diabetes. *P < 0.05, **P < 0.01). G1, first trimester; G2, second trimester; G3, third trimester; P, postpartum.
Figure 3.
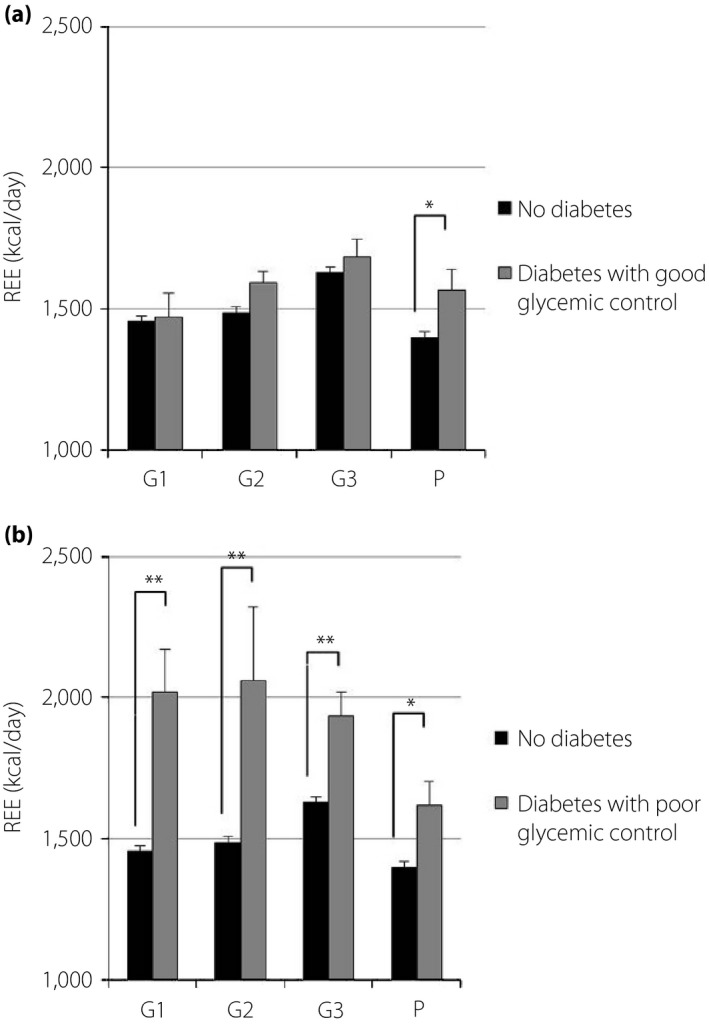
Comparison of resting energy expenditure (REE) in pregnant women with and without diabetes. (a) Good glycemic control: hemoglobin A1c <6.2% and glycated albumin <15.8%. (b) Poor glycemic control: hemoglobin A1c ≥6.2% or glycated albumin ≥15.8%. *P < 0.05, **P < 0.01. G1, first trimester; G2, second trimester; G3, third trimester; P, postpartum.
Figure 4.
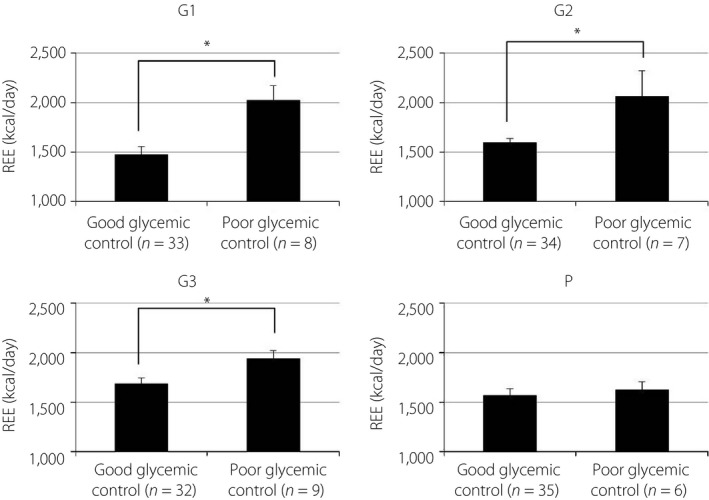
Resting energy expenditure (REE) in women with diabetes and its relationship to glycemic control. *P < 0.05, *P < 0.01. G1, first trimester; G2, second trimester; G3, third trimester; P, postpartum.
Figure 5.
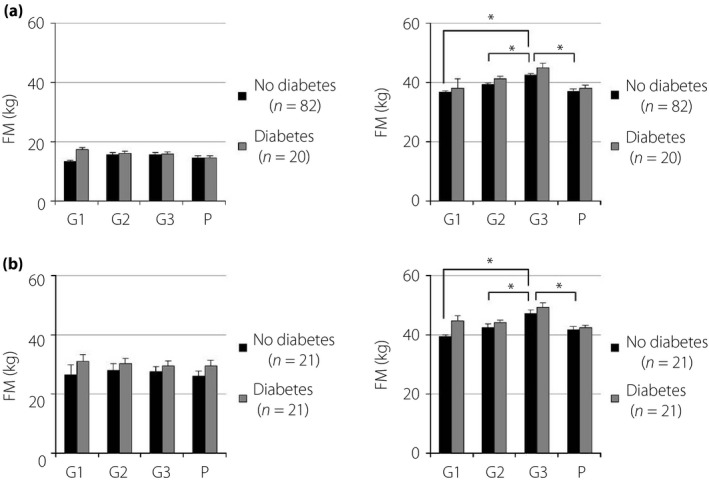
Fat mass (FM) and fat‐free mass (FFM) in Japanese women during and after pregnancy. (a) Prepregnancy body mass index <25 kg/m2. (b) Prepregnancy body mass index ≥25 kg/m2. *P < 0.05. G1, first trimester; G2, second trimester; G3, third trimester; P, postpartum.
FFM was closely correlated with REE in pregnant women with and without diabetes (Figure 6). The relationship between glycemic control and REE is shown in Figure 7. A statistically significant correlation was found in hemoglobin A1c and REE. The relationship between FFM in G3 and newborn birthweight is shown in Figure 8.
Figure 6.
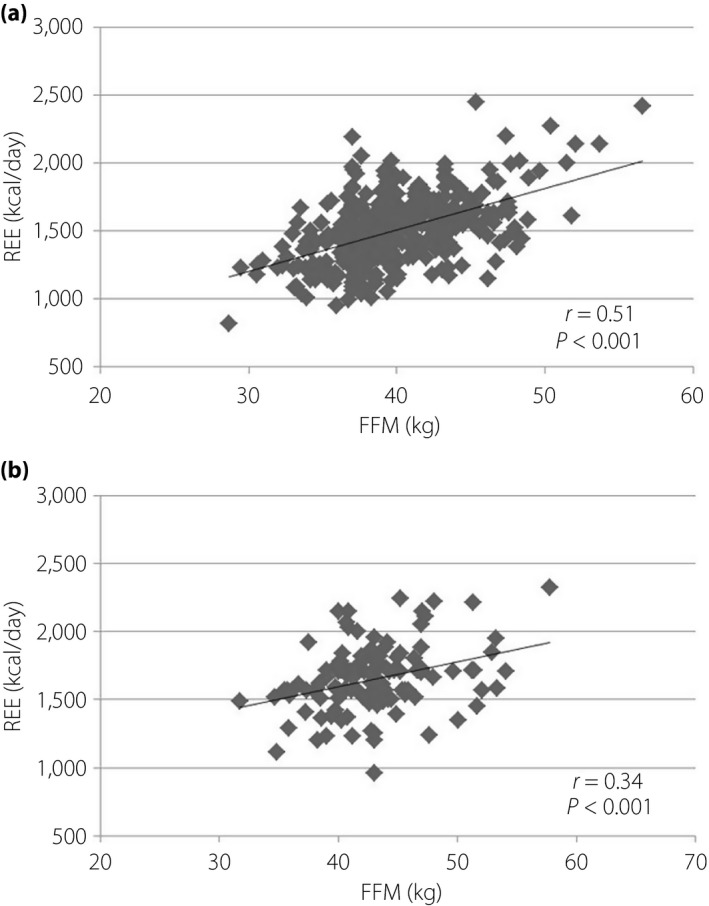
Correlation between fat‐free mass (FFM) and resting energy expenditure (REE). (a) No diabetes. (b) Diabetes.
Figure 7.
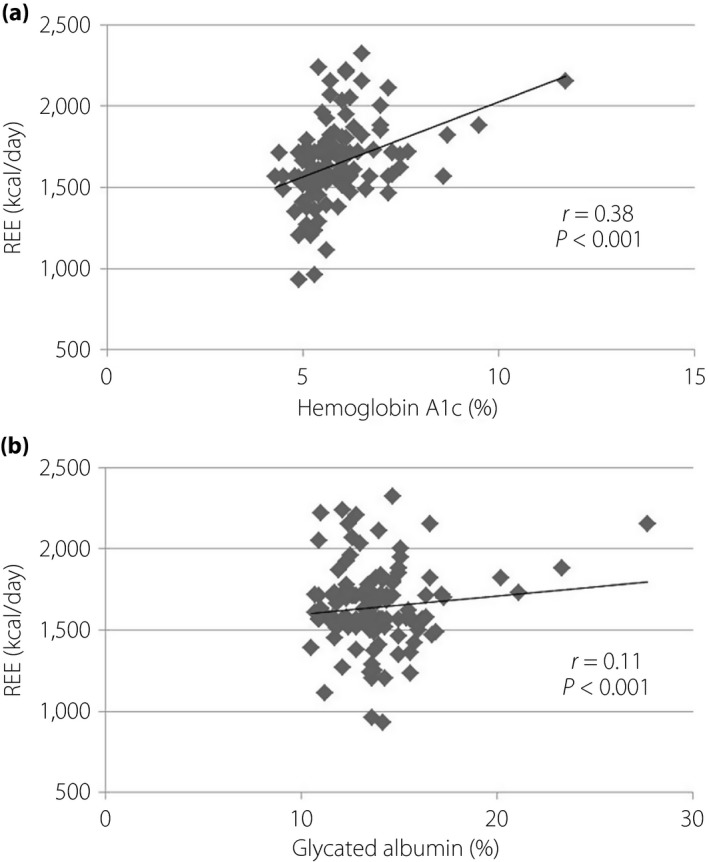
Correlation between glycemic control and resting energy expenditure (REE). (a) Hemoglobin A1c. (b) Glycated albumin.
Figure 8.
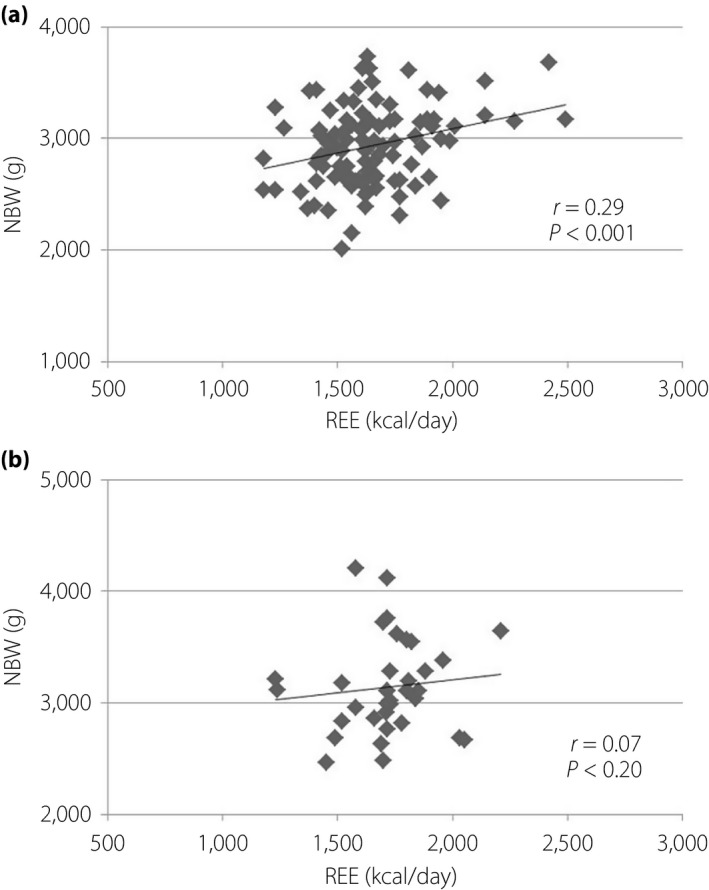
Correlation between resting energy expenditure (REE) in the third trimester and newborn birthweight (NBW). (a) No diabetes. (b) Diabetes.
Discussion
In the present study, we made three important clinical observations. First, the REE of pregnant women with normal glucose tolerance was significantly increased in G3, but the increase of REE in G3 might be suppressed in pregnant women with treated diabetes. Second, the REE of women with good glycemic control was lower than that of women with poor control. Third, FM did not change during all periods, and FFM showed similar changes as REE.
The REE of pregnant women with normal glucose tolerance were significantly increased in G3, but the increase of REE in G3 might be suppressed in pregnant women with treated diabetes. Several studies have documented the REE of pregnant women with normal glucose tolerance. Previous studies reported that energy demand increases at conception, does not change in G1 or G2 of pregnancy and increases gradually from G3 to term13, 14. The present data supported this result. A significant rise in REE during G3 occurred both in the preprandial and postprandial states15. Extra energy intake is required to support the increases in REE and adequate gestational weight gain16. Less demanding activities result in compensation for the increased energy costs of pregnancy17. In contrast, how the REE changes in pregnant women with diabetes is unknown. In the present study, the REE of pregnant women with treated diabetes was not significantly increased in G3. However, the REE of normal weight or underweight (prepregnancy BMI <25 kg/m2) pregnant women with diabetes increased in G3, similar to that in pregnant women with normal glucose tolerance. It is adequately advised when receiving MNT not to change additional energy intake during pregnancy and postpartum for pregnant women with diabetes. Furthermore, adding more energy intake, particularly in G3, in normal weight or underweight pregnant women with diabetes might also be acceptable.
The REE of women with good glycemic control was lower than that of women with poor control. No reports are available about the relationship between REE and glycemic control in pregnant women with diabetes. A previous study reported that REE is significantly higher in obese non‐pregnant patients with diabetes than in non‐pregnant patients without diabetes, particularly in those with poor glycemic control18. The present study showed agreeable results in pregnant women; that is, REE was significantly higher in pregnant women with poor glycemic control than in women with good control. Our regression analysis of glycemic control and REE confirmed that poor glycemia leads to high REE. The proposed mechanisms are increased gluconeogenesis, abnormal protein metabolism, increased sympathetic activity and hyperglucagonemia19, 20, 21. In a recent study, Diderholm et al.22 showed that the rates of glucose production and lipolysis are highly correlated with REE in 21 pregnant women without GDM at 35 gestational weeks. Good glycemic control by adequate treatment of diabetes is supposed to decrease the REE, particularly in G3, when the rates of glucose production and lipolysis are increasing. As a result, the REE of pregnant women with diabetes was not increased in G3. In the present study, the REE of pregnant women with good glycemic control had not significantly changed compared with that of pregnant women with normal glucose tolerance. The MNT of pregnant women with good glycemic control can be based on the same energy amount as that with normal glucose tolerance. Further assessment considering their actual dietary energy intake is important to evaluate the MNT of pregnant women with diabetes.
FM had not changed during all periods, and FFM showed similar changes as REE. This result supported that FFM is the largest contributor to REE23, 24. We have shown that FFM was not significantly different between preconception and a few weeks after delivery, whereas Berggren et al.25 reported the same trend at 1 year postpartum. Our regression analysis proved that FFM was closely correlated with REE in pregnant women with and without diabetes. The FFM of pregnant women with diabetes was lower in P than in G1, which can be attributed to adequate treatment for diabetes. The present study also showed that maternal weight gain was the result of FFM gain, because FM had not changed during all periods in both pregnant women with and without diabetes. Maternal weight gain was not attributed to FM gain in any Japanese pregnant women. This fact could be supported by MNT. Several studies claimed that FFM, not FM, correlated with birthweight26, 27, 28. The present study showed that REE and newborn birthweight were correlated in pregnant women with normal glucose tolerance, but whether the same trend can be observed in pregnant women with diabetes is unknown. There are variations in the data of pregnant women with diabetes. Diderholm et al.22 showed that lipolysis and glucose production are related to fetal weight. The variations of data might be effected by glycemic control. Both GDM and obesity are independently associated with adverse pregnancy outcomes29. Prepregnancy overweight and obesity account for a high proportion of large‐for‐gestational age infants, even in the absence of GDM30. Therefore, interventions focused on body composition are important. Further analysis is required to investigate the effect of body composition, as well as BMI, on perinatal outcomes.
The present study had two limitations. First, our data were obtained from a single medical facility in Japan, and only a small number of participants with diabetes were included. The REE can significantly increase in pregnant women with diabetes if a larger number of participants are included in the analysis. We had not carried out more detailed regression analysis because of our small sample. A larger sample should be included in future research to show a more reliable result. Second, we could not accurately assess the total energy expenditure of the participants, because the data of their actual dietary energy intake were unavailable.
To our knowledge, the present study is the first to evaluate energy REE and body composition of pregnant women with diabetes. The results could be helpful for MNT in the future, and provide critical evidence to determine adequate energy intake.
In conclusion, the REE of pregnant women with normal glucose tolerance was significantly higher in G3 than in G1, G2 and P. A possibility exists that the increase of REE in women with treated diabetes was suppressed as a result of glycemic control. REE and FFM are potential indexes for MNT in pregnant women with diabetes, because FFM was closely correlated with REE.
Disclosure
The authors declare no conflict of interest.
Acknowledgment
We thank Editage (http://www.editage.jp) for English language editing.
J Diabetes Investig 2018;9:959–966
References
- 1. Hiramatsu Y, Shimizu I, Omori Y, et al Determination of reference intervals of glycated albumin and hemoglobin A1c in healthy pregnant Japanese women and analysis of their time courses and influencing factors during pregnancy. Endocr J 2012; 59: 145–151. [DOI] [PubMed] [Google Scholar]
- 2. Metzger BE, Gabbe SG, Persson B, et al International Association of Diabetes and Pregnancy Study Groups Consensus Panel. International association of diabetes and pregnancy study groups recommendations on the diagnosis and classification of hyperglycemia in pregnancy. Diabetes Care 2010; 33: 676–682. [DOI] [PMC free article] [PubMed] [Google Scholar]
- 3. American Diabetes Association . Executive summary: standards of medical care in diabetes‐2014. Diabetes Care 2014; 37(Suppl 1): S5–S13. [DOI] [PubMed] [Google Scholar]
- 4. Melzer K, Schutz Y, Boulvain M, et al Pregnancy‐related changes in activity energy expenditure and resting metabolic rate in Switzerland. Eur J Clin Nutr 2009; 63: 1185–1191. [DOI] [PubMed] [Google Scholar]
- 5. Martin K, Wallace P, Rust PF, et al Estimation of resting energy expenditure considering effects of race and diabetes status. Diabetes Care 2004; 27: 1405–1411. [DOI] [PubMed] [Google Scholar]
- 6. Lowe LP, Metzger BE, Dyer AR, et al Hyperglycemia and adverse pregnancy outcome (HAPO) study: associations of maternal A1c and glucose with pregnancy outcomes. Diabetes Care 2012; 35: 574–580. [DOI] [PMC free article] [PubMed] [Google Scholar]
- 7. McDoniel SO. Systematic review on use of a handheld indirect calorimeter to assess energy needs in adults and children. Int J Sport Nutr Exerc Metab 2007; 17: 491–500. [DOI] [PubMed] [Google Scholar]
- 8. Compher C, Hise M, Sternberg A, et al Comparison between Medgem and Deltatrac resting metabolic rate measurements. Eur J Clin Nutr 2005; 59: 1136–1141. [DOI] [PubMed] [Google Scholar]
- 9. Alam DS, Hulshof PJ, Roordink D, et al Validity and reproducibility of resting metabolic rate measurements in rural Bangladeshi women: comparison of measurements obtained by Medgem™ and Deltatrac™ device. Eur J Clin Nutr 2005; 59: 651–657. [DOI] [PubMed] [Google Scholar]
- 10. Velazquez‐Alva Mdel C, Irigoyen‐Camacho ME, Huerta‐Huerta R, et al A comparison of dual energy X‐ray absorptiometry and two bioelectrical impedance analyzers to measure body fat percentage and fat‐free mass index in a group of Mexican young women. Nutr Hosp 2014; 29: 1038–1046. [DOI] [PubMed] [Google Scholar]
- 11. Yu OK, Rhee YK, Park TS, et al Comparisons of obesity assessments in over‐weight elementary students using anthropometry, BIA, CT and DEXA. Nutr Res Pract 2010; 4: 128–135. [DOI] [PMC free article] [PubMed] [Google Scholar]
- 12. Lukaski HC, Siders WA, Nielsen EJ, et al Total body water in pregnancy: assessment by using bioelectrical impedance. Am J Clin Nutr 1994; 59: 578–585. [DOI] [PubMed] [Google Scholar]
- 13. Chihara H, Otsubo Y, Araki T. Resting energy expenditure in pregnant Japanese women. J Nippon Med Sch 2002; 69: 373–375. [DOI] [PubMed] [Google Scholar]
- 14. Van Raaij JMA, Susan H, Vermaat‐Miedema SH, et al Energy requirements of pregnancy in the Netherlands. The Lancet 1987; 24: 953–955. [DOI] [PubMed] [Google Scholar]
- 15. Willommet L, Schutz Y, Whitehead R, et al Whole body protein metabolism and resting energy expenditure in pregnant Gambian women. Am J Physiol 1992; 1: E624–E631. [DOI] [PubMed] [Google Scholar]
- 16. Buttle NF, Wong WW, Treuth MS, et al Energy requirements during pregnancy based on total energy expenditure and energy deposition. Am J Clin Nutr 2004; 79: 1078–1087. [DOI] [PubMed] [Google Scholar]
- 17. Lof M. Physical activity pattern and activity energy expenditure in health pregnant and non‐pregnant Swedish women. Eur J Clin Nutr 2011; 65: 1295–1301. [DOI] [PubMed] [Google Scholar]
- 18. Alawad AO, Merghani TH, Ballal MA. Resting metabolic rate in obese diabetic and obese non‐diabetic subjects and its relation to glycaemic control. BMC Res Notes 2013; 6: 382. [DOI] [PMC free article] [PubMed] [Google Scholar]
- 19. Nair KS, Halliday D, Garrow JS. Increased energy expenditure in poorly controlled type 1 (insulin‐dependent) diabetic patients. Diabetologia 1984; 27: 13–16. [DOI] [PubMed] [Google Scholar]
- 20. Gougeon R, Pencharz PB, Marliss EB. Effect of NIDDM on the kinetics of whole‐body protein metabolism. Diabetes 1994; 43: 318–328. [DOI] [PubMed] [Google Scholar]
- 21. Felig P, Wahren J, Hendler R. Influence of maturity‐onset diabetes on splanchnic glucose balance after oral glucose ingestion. Diabetes 1978; 27: 121–126. [DOI] [PubMed] [Google Scholar]
- 22. Diderholm B, Beardsall K, Murgatoyd P, et al Maternal rates of lipolysis and glucose production in late pregnancy are independently related to foetal weight. Clin Endocrinol 2017; 87: 272–278. [DOI] [PubMed] [Google Scholar]
- 23. Browning MG, Evans RK. The contribution of fat‐free mass to resting energy expenditure: implications for weight loss strategies in the treatment of adolescent obesity. Int J Adolesc Med Health 2015; 27: 241–246. [DOI] [PubMed] [Google Scholar]
- 24. Hronek M, Klemera P, Tosner J, et al Anthropometric measured fat‐free mass as essential determinant of resting energy expenditure for pregnant and non‐pregnant women. Nutrition 2011; 27: 885–890. [DOI] [PubMed] [Google Scholar]
- 25. Berggren EK, Presley L, Amini SB, et al Are the metabolic changes of pregnancy reversible in the first year postpartum? Diabetologia 2015; 58: 1561–1568. [DOI] [PMC free article] [PubMed] [Google Scholar]
- 26. Kent E, O'Dwyer V, Fattah C, et al Correlation between birth weight and maternal body composition. Obstet Gynecol 2013; 121: 46–50. [DOI] [PubMed] [Google Scholar]
- 27. Sanin Aguirre LH, Reza‐Lopez S, Levario‐Carrillo M. Relation between maternal body composition and birth weight. Biol Neonate 2004; 86: 55–62. [DOI] [PubMed] [Google Scholar]
- 28. Forsum E, Sadurskis A, Wager J. Resting metabolic rate and body composition of healthy Swedish women during pregnancy. Am J Clin Nutr 1988; 47: 942–947. [DOI] [PubMed] [Google Scholar]
- 29. Catalano PM, McIntyre HD, Cruickshank JK, et al The hyperglycemia and adverse pregnancy outcome (HAPO) study: associations of GDM and obesity with pregnancy outcomes. Diabetes Care 2012; 35: 780–786. [DOI] [PMC free article] [PubMed] [Google Scholar]
- 30. Black MH, Sacks DA, Xiang AH, et al The relative contribution of prepregnancy overweight and obesity, gestational weight gain, and IADPSG‐defined gestational diabetes mellitus to fetal overgrowth. Diabetes Care 2013; 36: 56–62. [DOI] [PMC free article] [PubMed] [Google Scholar]


