

Abstract
Background:
Transforming growth factor-beta (TGF-β) signaling is recognized as being critical for carcinogenesis. Vitamin D has proved to exert numerous tumor suppressive effects. Effects of bone marrow derived mesenchymal stem cells (BM-MSCs) on tumor progression are still controversial. The present study was conducted to evaluate the effects of BM-MSCs and vitamin D on TGF-β signaling in an experimental hepatocellular carcinoma (HCC) model in rats.
Materials and Methods:
The study was conducted on fifty female white albino rats divided equally into 5 groups: controls, HCC induced by diethyl-nitrosamine (DENA) and carbon tetrachloride (CCl4), HCC plus MSCs, HCC plus vitamin D and HCC plus both MSCs and vitamin D. The following parameters were assessed in rat liver tissues: TGF-β and Smad2 protein levels by ELISA and western blotting, respectively, gene expression of Smad3, Smad7, Snail, HNF4α and MMP-2 and histopathological lesions. Serum levels of alpha fetoprotein (AFP), ALT and albumin were also assessed.
Results:
TGF-β protein levels and gene expression of its downstream effectors (Smad3 and Snail), in addition to Smad2 protein levels were significantly higher in the HCC group than in the control group. On the other hand, they were significantly down-regulated in all treated groups with most significant amelioration with both MSCs and vitamin D. Also, the serum levels of AFP were significantly increased in the untreated HCC group, and this was again reversed in all treated groups. Histopathological examination of liver tissue revealed that administration of MSCs or vitamin D into HCC rat group improved the histopathological picture with residual tumor pathology, while administration of both MSCs and vitamin D showed better restoration of liver parenchyma. These data suggest that the TGF-β signaling pathway could be used as a therapeutic target in HCC.
Keywords: HCC-TGF-β, signaling, MSCs, Vitamin D
Introduction
Hepatocellular carcinoma (HCC), originating from epithelium of hepatocytes and accounting for 80% of primary liver cancers, ranks as 4th place in causing tumor-related deaths globally. Abnormal activation of molecular signaling pathways contributes to initiation and progression of liver cancer (Chen and Wang, 2015).
The TGF-β signaling pathways play essential roles in regulating cell growth, differentiation, extracellular matrix (ECM) production, angiogenesis, immune response, apoptosis, motility and invasion (Wakefield and Hill, 2013). Dysregulated TGF-β signaling pathways play crucial roles in malignant tumor development and metastasis. There are growing evidence pointing to the role of TGF-β signaling in HCC initiation and promotion. The TGF-β signaling occurs via a canonical and a non-canonical pathway. The canonical TGF-β signaling pathway activation leads to downstream SMADs signaling cascade initiation resulting in nuclear translocation and gene transcription for a wide range of tumor-promoting genes (Heldin and Moustakas, 2012). The less-known non-canonical activation pathway is associated with several intracellular phosphorylation of proteins, such as jun N-terminal kinase (JNK), p38 MAPK, ERK, or MEKK. MEK, ERK, AKT, mTOR and PTEN (Fransvea et al., 2011). This suggests that TGFβ signaling has several mechanisms to activate either the tumor cell or cells of the microenvironment.
Regarding MSCs, several studies reported that MSCs have both stimulating and inhibiting effects on tumor progression. The outcome of the intricate signaling network and crosstalk between MSCs and tumor micro-environmental cells determine whether MSCs will undergo stimulating or inhibiting effects on tumor progression. Barcellos-de-Souza et al., (2013) attributed the anti-neoplastic properties of MSCs due to AKT inactivation. Yulyana et al., (2015) reported similar findings in HCC cell lines where the authors stated that MSCs conditioned medium inhibited insulin like growth factor (IGF) signaling cascade and subsequent disruption of the downstream phosphatidylinositol 3-kinase (PI3K)/Akt signaling events.
Moreover, BM-MSCs inhibit the in vivo tumor growth and in vitro proliferation, migration, and invasion of lung adenocarcinoma cells through the secretion of oncostatin-M, a differentiation-promoting cytokine, that exerts anti-proliferative effects against several types of cancers (Wang et al., 2012).
On the other hand, Vitamin D has significant anti-proliferative, anti-angiogenic and pro-differentiative effects in a broad range of malignant tumors (Deeb et al., 2007). These effects are mediated through affecting several signaling pathways mediated through genomic and epigenomic mechanisms. The effects of 1α,25(OH)2D3 and its metabolites have been shown to function through regulation of proliferation, apoptosis and angiogenesis (Wang and Studzinski, 2001). Vitamin D3 potentiates the anti-tumour effects of many chemotherapeutic drugs, and several clinical trials showed that the administration of high-dose vitamin D3 and its analogues is feasible, safe and has significant therapeutic potentials.
The present study was conducted to evaluate the effects of BM-MSCs with or without use of vitamin D3 on TGF-β signaling in experimental HCC in rats.
Materials and Methods
The present study was conducted in the Unit of Biochemistry and Molecular Biology at the Medical Biochemistry Department, Faculty of Medicine, Cairo University, Egypt.
Preparation of experimental animal model
This study included fifty female adult albino rats, inbred strain (Cux1: HEL1) of matched age and weight (6 months-1 year and 120-150gm) (Abdel Aziz et al., 2011). Rats were maintained according to the standard guidelines of Institutional Animal Care and Use Committee and after Institutional Review Board approval. Animals were maintained in an air conditioned animal house with specific pathogen free conditions. They were divided into 5 groups Table 1.
Table 1.
Classification of Studied Groups (10 rats/group)
| Group | |
|---|---|
| Group 1 | Negative control group (normal healthy rats). |
| Group 2 | Experimental HCC (pathological control). |
| Group 3 | Rats injected with MSCs (3 × 10⁶ cells intravenously, once) then sacrifaction was done after 4 weeks (Abdel Aziz et al., 2011a). |
| Group 4 | HCC rats injected with vitamin D (100 nM twice/week) for 3 weeks (Guo et al., 2013). |
| Group 5 | HCC rats received both MSCs and Vitamin D. |
Experimental HCC was induced by injection of a single intraperitoneal dose of DENA at a dose of 200 mg/kg body weight followed by subcutaneous injections of CCl4 at a dose of 3 mL/kg body weight (twice/week) for 6 months (Sundaresan and Subramanian, 2003; Dakshayani et al., 2005). Then, HCC was confirmed after histopathological examination of two sacrificed rats. Thereafter we started intervention with treatment at the age of 18 months for all treated groups.
At the planned time at the end of the study, animals were sacrificed by cervical dislocation, venous blood was collected from the retro-orbital veins from rats of all groups and liver tissues were harvested for assessment of the following: TGF-β protein level by ELISA, quantitative measurement of gene expression of Smad3, Smad7, snail, HNF4α and MMP-2 by quantitative real time-polymerase chain reaction (QRT-PCR), estimation of Smad2 protein level by western blot technique, estimation of serum levels of AFP by ELISA, and ALT and albumin by colorimetric methods. Histopathological examination of liver tissues was also done.
Isolation and identification of BM-derived MSCs from rats
BM-MSCs were isolated from bone marrow of the tibiae and femurs of 6 weeks old male rats according to Alhadlaq and Mao (2004). Briefly, cells were incubated at 37° C in 5% humidified CO2 for 12-14 days as primary culture media was changed every 2-3 days. On day 14, the adherent colonies of cells were trypsinized, and counted. Cells were identified as being MSCs by their morphology, adherence, and CD surface markers.
Labeling of MSCs with PKH26
MSCs were labeled with PKH26 according to the manufacturer’s recommendations (Sigma, Saint Louis, Missouri, USA). Cells were injected intravenously into rat tail veins. After one month, detection of homing of injected cells in the liver tissue was examined with a fluorescence microscope to detect the PKH26 stained cells.
Quantitative real time (QRT) PCR gene expression of Smad3, Smad7, Snail, HNF4α and MMP-2 in rat liver tissues
Total RNA was extracted by mincing tumour part mainly but may be non-tumour part was taken as well. Homogenization was done by the RNeasy Purification Reagent (Qiagen, Valencia, CA, USA) according to the manufacturer’s protocol. The extracted RNA was quantified by spectrophotometry (JENWAY, USA) at 260 nm.
The extracted RNA was reverse-transcribed into cDNA by a Reverse Transcription System Kit (Cat. no. A3500; Promega, Madison, WI, USA). The cDNA was generated from 5 μg of total RNA extracted with 1 μL (20 pmol) of antisense primer and 0.8 μL of superscript AMV reverse transcriptase for 60 min at 37°C.
The relative abundances of the mRNA species were assessed by the SYBR® Green method and an ABI Prism7500 Sequence Detector System (Applied Biosystems, Foster City, CA, USA). The PCR primers used were designed with Gene Runner Software (Hastings Software Inc., Hastings, NY, USA) from RNA sequences in GenBank Table 2.
Table 2.
Primers Sequences of Smad3, Smad7, Snail, HNF4α and MMP-2
| Parameter | Forward and Reverse Primers | Gene bank accession number |
|---|---|---|
| Smad 3 | Forward primer: 5′CGCATGAGCTTCGTCAAAGG 3′ | NM: 013095.3 |
| Reverse primer: 5′ CCGATCCCTTTACTCCCAGTG 3′ | ||
| Smad 7 | Forward primer: 5′ ACCCCGATACAAAAACGGGAA 3′ | NM: 030858.1 |
| Reverse primer: 5′ GCTGATCCAAAGGGGAAGGT 3′ | ||
| Snail | Forward primer: 5′CCGGAACCGAAACGTGACTA3′ | NM: 057384.4 |
| Reverse primer: 5′ TTTCGGTGGGCAGGTAATCC 3′ | ||
| HNF4α | Forward primer:5′ TGGCATGGCCAAGATTGACA 3′ | NM: 022180.2 |
| Reverse primer: 5′ TGCCGTGACTAAGTTACACCC 3′ | ||
| MMP-2 | Forward primer: 5′ TGCCCGACTCTGGTGATTTC 3′ | NM: 022221.1 |
| Reverse primer: 5′ TCAGGGTTGATGGCACACTC 3′ | ||
| GAPDH | Forward primer: 5′ GATGCTGGTGCTGAGTATGTCG 3′ | XR: 598347.1 |
| (House keeping) | Reverse primer: 5′ GTGGTGCAGGATGCATTGCTGA3 ′ |
All of the primer sets had a calculated annealing temperature of 60°C. Quantitative RT-PCR analysis was performed in duplicate in a 25-μL reaction volume consisting of 2× SYBR Green PCR Master Mix (Applied Biosystems, USA), 900 nM of each primer, and 2–3 μL of cDNA. The amplification conditions were 2 min at 50 °C, 10 min at 95 °C, and 40 cycles of denaturation at 95 °C for 15 s and annealing/extension at 60 °C for 10 min. Data from the real-time assays were calculated by Sequence Detection Software version 1.7 (PE Biosystems, Foster City, CA, USA). The relative expression levels of Smad3, Smad7, Snail, HNF4α and MMP-2 were calculated by the comparative Ct method as stated by the manufacturer recommendations (Applied Biosystems, USA).
Estimation of Smad2 Protein by Western Blot Technique (usingV3 Western Workflow™ Complete System, Bio-Rad® Hercules, CA, USA)
Briefly, 5 mg of liver tissue was homogenized in RIPA buffer, then centrifugation at 12,000 rpm for 20 minutes. The protein concentration for each cell lysate was determined using Bradford assay. Equal amounts of protein (20-30 µg of total protein from cell lysate) were separated by SDS-PAGE and then transferred to a polyvinylidene difluoride membrane. The membrane was blocked in TBS buffer containing 5% skim milk and 0.1% Tween 20 at room temperature for 1h and incubated with Smad2 primary antibody supplied by Thermoscientific overnight at pH 7.6 at 4°C with gentle shaking. After washing, peroxidase-labeled secondary antibodies were added, and the membranes were incubated at 37°C for 1h. Band intensity was analyzed by ChemiDocTM imaging system with Image LabTM software version 5.1 (Bio-Rad Laboratories Inc., Hercules, CA, USA). Beta actin were used to normalize the Smad2 protein levels.
Estimation of TGF-β Level in rat liver tissue by ELISA (eBioscience, San Diego, CA, USA)
According to the manufacturer`s recommendations.
Estimation of Alpha fetoprotein serum levels by ELISA (Uscn, Life science Inc, UK)
According to the manufacturer`s recommendations.
Estimation of serum ALT and albumin levels
By the routine laboratory colorimetric method.
Statistical Analysis
The data were coded and entered using the statistical package SPSS version 22. Data were summarized using mean ± SD for quantitative variables. Comparisons between groups were done using analysis of variance (ANOVA) with multiple comparisons post hoc test (Chan, 2003). P-values less than 0.05 were considered as statistically significant.
Results
MSCs Isolation, propagation, identification and labeling
Isolated and cultured MSCs were identified by surface markers CD90 and CD105 (+ve) and CD34 (-ve) detected by flow cytometry Figure 1. MSCs labeled with PKH26 fluorescent dye was detected in the liver tissues confirming that these cells homed into liver tissue Figure 2.
Figure 1.
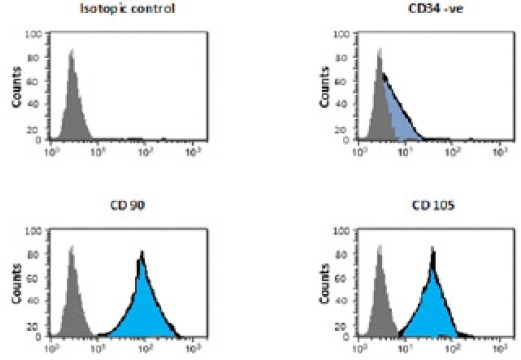
Flow Cytometric Characterization Analysis of BM-MSCs [CD90 &CD105 (+ve) and CD34 (-ve)].
Figure 2.
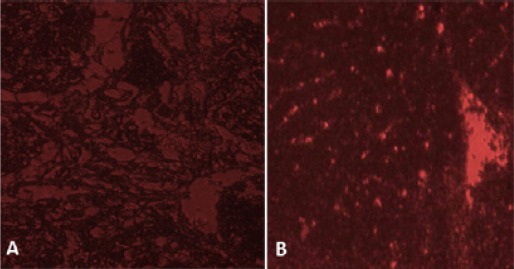
SectionsTaken by Fluorescence Microscope for Liver Tissue of (A) Control Rats and (B) Recipient Rats 30 Days Following Administration of Labeled Cells Revealed Homing of BM-MSCs Labeled with PKH26 Fluorescent Dye (red fluorescence).
Stem cells and vitamin D decreased AFP and improved liver functions
A significant increase was found in AFP serum levels in HCC group compared to the control group, while there was a significant decrease in all treated groups compared to the HCC group.
As regards the serum levels of ALT, there was a significant increase in HCC group, HCC+MSCs and HCC+vitamin D compared to the control group. However, there was a significant decreased levels in HCC+MSCs group and HCC+MSCs+vitamin D group compared to the HCC group. Furthermore, there were significant decreased levels in HCC+MSCs+vitamin D group compared to HCC groups treated with either MSCs or vitamin D only.
As forth serum albumin levels, there was a significant decrease in HCC group and all treated groups compared to the control group. Whereas, there was a significant increase in its levels in all treated groups compared to the HCC group, with a significant increased levels in HCC+MSCs+vitamin D group compared to HCC groups treated with either MSCs or vitamin D only Table 3.
Table 3.
Comparison Between Serum Levels of AFP, ALT and Albumin in All studied Groups
| Group | |||||
|---|---|---|---|---|---|
| Control | HCC | HCC+ MSCs | HCC+ Vitamin D | HCC+MSCs+ Vitamin D | |
| AFP (ng/mL) | 0.40±0.13 | 1.70±0.35 * | 0.65±0.20 # | 0.84±0.16 # | 0.55±0.21 # |
| ALT (U/L) | 19.24±2.12 | 71.74±7.94 * | 53.02±10.54 *# | 59.34±11.34 * | 29.94±8.54 #$@ |
| Albumin (g/dL) | 5.20±0.34 | 2.21±0.75 * | 3.24±0.30 *# | 3.16±0.40 *# | 4.26±0.40 *#$@ |
Values are presented as mean ± SD; Statistically significant compared to corresponding value in, control group (*); HCC group (#; HCC+MSCs group; HCC+Vitamin D group (@). (P<0.05).
Stem cells and vitamin D modulated TGF-β and its downstream effectors
There was a significant increase in TGF-β protein levels in HCC group and HCC+vitamin D group compared to the control group. However, there was a significant decrease in TGF-β levels in all treated groups compared to the HCC group Figure 3. A significant elevation in Smad3 and Snail gene expressions in all HCC rat groups in comparison to control except HCC rat group that received both Vitamin D and MSCs. Moreover, there was a significant decrease in Smad3 and Snail gene expressions in all treated groups as compared to untreated HCC rat group Figure 4.
Figure 3.
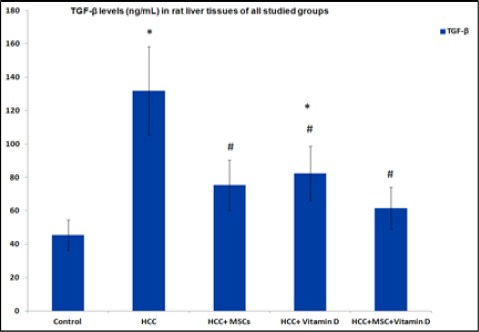
TGF-β levels (ng/mL) in rat liver tissues in all studied groups. Results are expressed by mean ± SD. Statistically significant compared to corresponding value in: control group (*), HCC group (#), (P<0.05).
Figure 4.
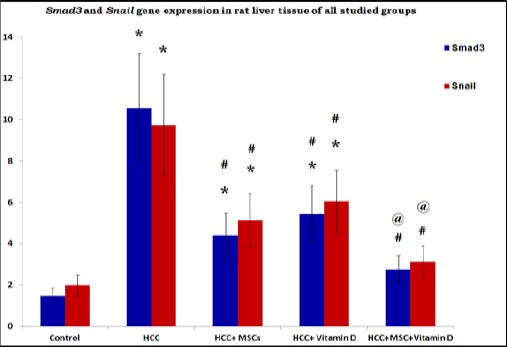
Gene Expression of Smad3 and Snail in Rat Liver Tissues of the Studied Group. Results are expressed by mean ± SD as relative gene expression to the house keeping gene. Statistically significant compared to corresponding value in: control group (*), HCC group (#), HCC+MSCs group, HCC+Vitamin D group (@). (P<0.05).
Estimation of Smad2 protein levels by western blot technique showed a significant increase in HCC group and HCC+vitamin D group compared to the control group. Whereas, there was a significant decrease in Smad2 levels in HCC+MSCs group and HCC+MSCs+vitamin D group compared to the HCC group Figure 5.
Figure 5.
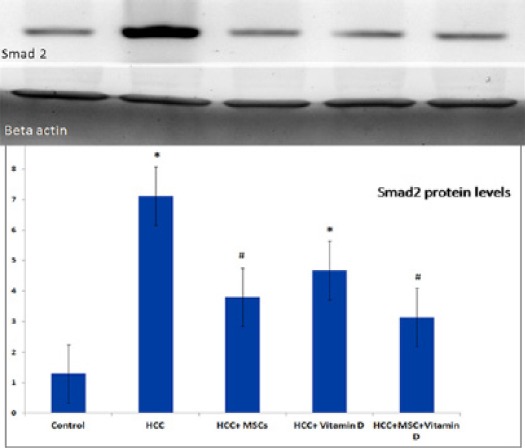
Smad2 Protein Levels in Rat Liver Tissues of the Studied Group. Results are expressed by mean ± SD as relative expression by normalization to the loading control protein. Statistically significant compared to corresponding value in: control group (*), HCC group (#), (P<0.05).
Stem cells and vitamin D increased the inhibitory Smad7 gene expression
There was a significant decrease in Smad7 gene expression in HCC group and in all treated groups as compared to the control group. While there was a significant increase in all treated groups compared to the HCC group. Moreover, there was a significant increase in Smad7 gene expression in HCC rats treated with both MSCs and vitamin D as compared to the other HCC treated rat groups Figure 6.
Figure 6.
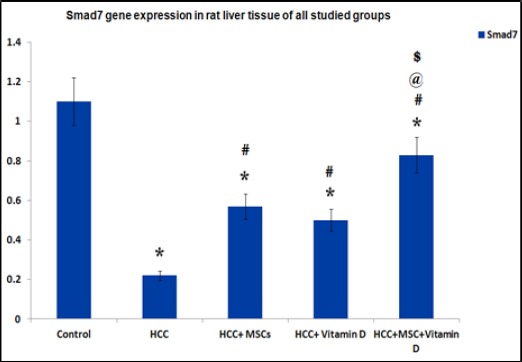
Gene Expression of Smad7 in Rat Liver Tissues of the Studied Group. Results are expressed by mean ± SD as relative gene expression to the house keeping gene. Statistically significant compared to corresponding value in: control group (*), HCC group (#), HCC+MSCs group, HCC+Vitamin D group (@). (P<0.05).
Stem cells and vitamin D affected MMP-2 and HNF4α gene expressions
Gene expression of MMP-2 showed significant increase in the HCC group, HCC group treated with MSCs and HCC group treated with vitamin D compared to the control group. Whereas, there was a significant decrease in the gene expression of MMP-2 in all treated groups compared to the HCC group Figure 7.
Figure 7.
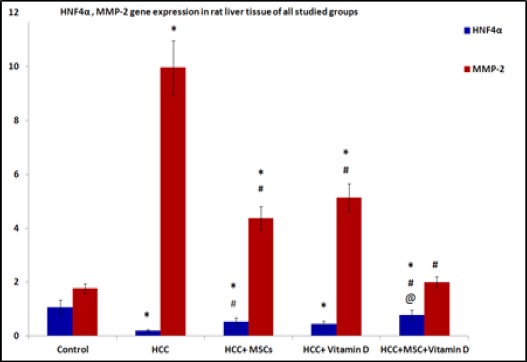
Gene Expression of HNF4α and MMP-2 in Rat Liver Tissues of the Studied Group. Results are expressed by mean ± SD as relative gene expression to the house keeping gene Statistically significant compared to corresponding value in: control group (*), HCC group (#), HCC+MSCs group, HCC+Vitamin D group (@). (P<0.05).
There was a significant decrease HNF4α gene expression in HCC group and all treated groups compared to the control group. Whereas, there was a significant increase in the expression of this gene in HCC+MSCs group and HCC+MSCs+vitamin D compared to the HCC group. Furthermore, there was a significant increased expression in HCC+MSCs+vitamin D group compared to HCC group treated with vitamin D alone Figure 7.
Histopathological picture of liver tissues
Figure 8 showed that administration of MSCs or vitamin D into HCC rat group improved the histopathological picture with residual tumor pathology, while administration of both MSCs and vitamin D showed restoration of liver parenchyma and near normal liver cell plates with intervening markedly narrowed sinusoids and normal portal tracts. This suggests that the administration of MSCs and vitamin D together causes more improvement of the pathological features which agrees with the molecular findings of gene expression of TGF-β signaling pathway.
Figure 8.
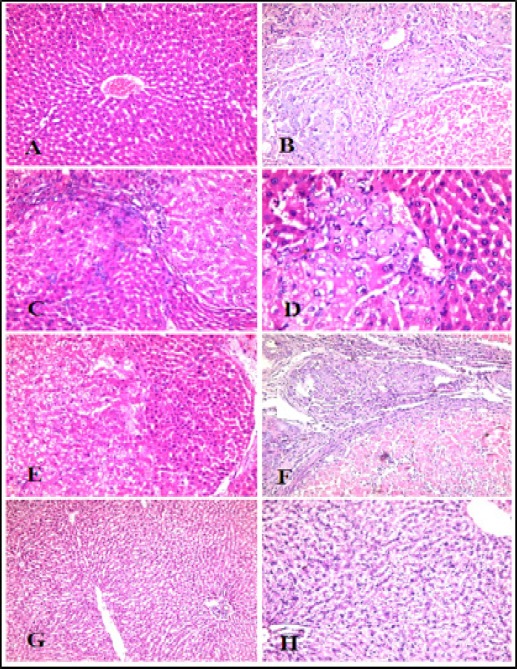
Histopathological Examination of Rat Liver Tissues. (A) Control group: Normal liver cell plates with intervening regular sinusoids and normal central veins and portal tracts, (B) HCC group: lost liver architecture with dysplastic cirrhotic nodules. Hepatocytes showed solid areas with neoplasia and foci of necrosis. (C and D) HCC+MSCs group and (E and F) HCC+Vitamin D group show improved the histopathological picture with residual tumor pathology, (G and H) HCC+MSCs+vitamin D group shows restoration of liver parenchyma and near normal liver cell plates with intervening markedly narrowed sinusoids and normal portal tracts.
Discussion
Aberrant activation of molecular signaling pathways contributes to initiation and progression of liver cancer (Chen and Wang, 2015). TGF-β signaling has been increasingly recognized as a key driver in cancer. The present study was conducted to evaluate the effects of BM-MSCs and/or vitamin D on TGF-β signaling in experimental hepatocellular carcinoma (HCC) in rats.
Results of the present study showed that there was a significant elevation in TGF-β protein level and its downstream target gene expressions (Smad3 and Snail) in HCC rat group. There was also a significant elevation in Smad2 protein levels in the rat liver tissues in HCC rat group as compared to the control group. Gianluigi et al., (2014) reported similar findings. The authors stated that TGF-β plays an important role in orchestrating a favorable microenvironment for tumor cell growth and promoting epithelial–mesenchymal transition (EMT). TGF-β signaling promotes hepatocellular carcinoma progression by two mechanisms: first, via an intrinsic activity as an autocrine or paracrine growth factor and, second, via an extrinsic activity by inducing microenvironment changes, including cancer-associated fibroblasts, T regulatory cells, and inflammatory mediators. Also, Moon et al., (2017) found that TGF-β signaling activated transcription of the Snail gene in liver tumors declaring that Snail is the TGF-β target that is required for hepatic tumorigenesis. As regards Smad3, Millet and Zhang, (2007) confirmed the pro-oncogenic activities of Smad3 during the late stages of carcinogenesis. Smad3 is essential for TGF-β–mediated immune suppression, and it regulates transcriptional responses that are favorable to EMT and enhancing cell migration and transcription of factors favorable to metastasis.
On the other hand, Zhang et al., (2017) demonstrated that TGF-β1 inhibits the growth and development of HCC cells by targeting the Hippo signaling pathway through the regulation of a series of key proteins. The Hippo pathway inhibited the HCC cells growth and the inhibitory effect was stronger than the enhancing effect of TGF-β/smad2/3 signaling pathway.
HCC rat group treated with either MSCs only or treated with vitamin D only showed a significant decrease in the TGF-β levels and the gene expression of both Smad3 and Snail as compared to the untreated HCC rat group. Whereas Smad2 protein level exhibited a significant decrease in the HCC group treated with MSCs only as compared to the untreated HCC group.
As regards MSCs effects on TGF-β signaling, our findings coincided with those reported by Zhang et al., (2015) who stated that BM-MSCs inhibit the proliferation of hepatic stellate cells by inhibiting the TGF-β signaling pathway in advanced liver disease. Moreover, Li et al., (2010) stated that MSCs enhanced tumor growth but significantly inhibited the invasiveness and metastasis of HCC, possibly through downregulation of TGF-β1. On the contrary, Tang et al., (2015) stated that although MSCs secrete TGF-β in experimental colorectal cancer model, this effect is beneficial by inhibiting the chronic inflammatory state in malignant neoplasms because of the induction of differentiation of the regulatory T cells (Treg cells) with significant potential anti-inflammatory effect. Also Li et al., (2016) found that MSCs were able to enhance the expression of TGFβ1 mRNA, however, inhibited the expression of Smad7 mRNA. Moreover, TGFβ1 mRNA expression levels correlated with the microvessel density (MVD) of the HCC suggesting that MSCs may promote tumor angiogenesis via the TGFβ1/Smad signaling pathway.
As regards Smad7 there was a significant decrease in gene expression in HCC group as compared to control. While there was a significant increase in all treated groups compared to the untreated HCC group. Moreover, there was a significant increase in Smad7 gene expression in HCC rat treated with both MSCs and vitamin D as compared to both HCC treated rat groups that received either MSCs or Vitamin D only. Stolfi et al., (2013) stated that Smad7 was initially identified as an inhibitor of TGF-β due mainly to its ability to bind TGF-β receptor type I and prevent TGF-β-associated Smads signaling. Moreover, Wang et al., (2013) proved the role of Smad7 in hepatocarcinogenesis in mice and in vitro. These studies could explain our findings of the decreased Smad7 levels in HCC rat group. Whereas Li et al, (2016) demonstrated that MSCs inhibited the expression of Smad7 mRNA.
Chen et al., (2015) proved that 1,25(OH)2D3 inhibited TGF-β1/β2 in SW-480 and HT-29 cancer cell lines. TGF-β1/β2-induced increased expression of EMT-related transcription factors was also inhibited by 1,25(OH)2D3. These findings agree with our results that demonstrate the suppressor effect of Vitamin D on TGF-β and its downstream target genes.
As regards effect of combined administration of vitamin D and MSCs on HCC model, Artaza et al., (2009), stated that exposing mesenchymal stem cells to the active form of vitamin D led to the decreased expression of TGF-B1 and plasminogen activator inhibitor (SERPINE1) which are considered as two well-known pro-fibrotic factors. These data could explain our findings of the significant inhibitory effect on TGF-β signaling by the combined use of Vitamin D and MSCs in HCC group than the use of either Vitamin D or MSCs separately.
As regards, MMP-2, our results demonstrated that the expression of MMP-2 was significantly increased in the HCC group of animal model compared to control group. Whereas, there was a significant decrease in the gene expression of MMP-2 in all treated groups compared to the HCC group. These findings agreed with those reported by Li et al., (2015) who indicated a positive feedback loop between activation of TGF-β1 and MMP-2. MMP-2 and MMP-9 proteolytically cleave latent TGF-β, providing a potentially important mechanism for TGF-β activation. Conversely, TGF-β can induce expression of MMP-2 through the TGFβ/Smad pathway. The results of the present study also agreed with Luong and Nguyen (2013) who demonstrated that calcitriol inhibited endometrial cancer cell growth and was associated with decreased MMP-2 and MMP-9 expression. Vitamin D analogs have also been shown to decrease MMP-2 and MMP-9 activities and inhibit prostate cancer cell invasion (Iglesias-gato et al., 2011; Stio et al., 2011).
The current study revealed that HNF4α expression was significantly decreased in the HCC group compared to the control group. Whereas, there was a significant increase in the expression of this gene in HCC group that received MSCs only and HCC group that received both MSCs and vitamin D compared to the HCC group. These results agreed with findings reported by Cozzolino et al., (2013) who stated that TGF-β overrides HNF4α tumor suppressing activity through GSK3β inactivation with subsequent potentiation of tumor dedifferentiation, induction of EMT and acquisition of metastatic properties.
In conclusion downregulation of TGF-β signaling could be achieved by administration of MSCs or vitamin D in chemically induced HCC rats. Administration of both MSCs and vitamin D showed more significant suppressive effect on TGF-β signaling and more improvement of pathological picture. These data suggest that TGF-β signaling pathway could be used as a therapeutic target in HCC.
Conflict of Interest:
The authors declared no conflict of interest.
References
- 1.Abdel Aziz MT, El Asmar MF, Atta HM, et al. Efficacy of mesenchymal stem cells in suppression of hepatocarcinorigenesis in rats:Possible role of Wnt signaling. J Exp Clin Cancer Res. 2011;30:49. doi: 10.1186/1756-9966-30-49. [DOI] [PMC free article] [PubMed] [Google Scholar]
- 2.Alhadlaq A, Mao JJ. Mesenchymal stem cells:isolation and therapeutics. Stem Cells Dev. 2004;13:436–48. doi: 10.1089/scd.2004.13.436. [DOI] [PubMed] [Google Scholar]
- 3.Artaza JN, Mehrotra R, Norris KC. Vitamin D and the cardiovascular system. Clin J Am Soc Nephrol. 2009;4:1515–22. doi: 10.2215/CJN.02260409. [DOI] [PubMed] [Google Scholar]
- 4.Barcellos-de-Souzaa P, Gori V, Bambic F, Chiarugia P. Tumor microenvironment:Bone marrow-mesenchymal stem cells as key players. Biochim Biophys Acta. 2013;1836:321–35. doi: 10.1016/j.bbcan.2013.10.004. [DOI] [PubMed] [Google Scholar]
- 5.Chan YH. Biostatistics102:Quantitative data –parametric and non-parametric tests. Singapore Med J. 2003;44:391–6. [PubMed] [Google Scholar]
- 6.Chen C, Wang G. Mechanisms of hepatocellular carcinoma and challenges and opportunities for molecular targeted therapy. World J Hepatol. 2015;7:1964–70. doi: 10.4254/wjh.v7.i15.1964. [DOI] [PMC free article] [PubMed] [Google Scholar]
- 7.Chen S, Zhu J, Liu Y, Wang P. 1,25(OH)2D3attenuates TGF-β1/β2-induced increased migration and invasion via inhibiting epithelial-mesenchymal transition in colon cancer cells. Biochem Biophys Res Commun. 2015;468:130–5. doi: 10.1016/j.bbrc.2015.10.146. [DOI] [PubMed] [Google Scholar]
- 8.Cozzolino AM, Alonzi T, Santangelo L, et al. TGFβoverrides HNF4αtumor suppressing activity through GSK3βinactivation:Implication for hepatocellular carcinoma gene therapy. J Hepatol. 2013;58:65–72. doi: 10.1016/j.jhep.2012.08.023. [DOI] [PubMed] [Google Scholar]
- 9.Dakshayani KB, Subramanian P, Manivasagam T, et al. Melatonin modulates the oxidant-antioxidant imbalance during N-nitrosodiethylamine induced hepatocarcinogenesis in rats. J Pharm Sci. 2005;8:316–21. [PubMed] [Google Scholar]
- 10.Deeb KK, Trump DL, Johnson CS. Vitamin D signalling pathways in cancer:potential for anticancer therapeutics. Nature Rev Cancer. 2007;7:684–700. doi: 10.1038/nrc2196. [DOI] [PubMed] [Google Scholar]
- 11.Fransvea E, Mazzocca A, Santamato A, et al. Kinase activation profile associated with TGF-beta-dependent migration of HCC cells:a preclinical study. Cancer Chemother Pharmacol. 2011;68:79–86. doi: 10.1007/s00280-010-1459-x. [DOI] [PubMed] [Google Scholar]
- 12.Giannelli G, Villa E, Lahn M. Transforming growth factor-βas a therapeutic target in hepatocellular carcinoma. Cancer Res. 2014;74:1890. doi: 10.1158/0008-5472.CAN-14-0243. [DOI] [PubMed] [Google Scholar]
- 13.Guo J, Ma Z, Ma Q, et al. 1,25(OH)2D3 Inhibits hepatocellular carcinoma development through reducing secretion of inflammatory cytokines from immunocytes. Curr Med Chem. 2013;20:4131–41. doi: 10.2174/09298673113209990248. [DOI] [PMC free article] [PubMed] [Google Scholar]
- 14.Heldin CH, Moustakas A. Role of Smads in TGF-beta signaling. Cell Tissue Res. 2012;347:21–36. doi: 10.1007/s00441-011-1190-x. [DOI] [PubMed] [Google Scholar]
- 15.Iglesias-gato D, Zheng S, Flanagan JN, et al. Substitution at carbon 2 of nor-1α,25-dihydroxyvitamin D3 with 3-hydroxypropyl group generates an analogue with enhanced chemotherapeutic potency in PC-3 prostate cancer cells. J Steroid Biochem Mol Biol. 2011;127:269–75. doi: 10.1016/j.jsbmb.2011.08.010. [DOI] [PubMed] [Google Scholar]
- 16.Li GC, Ye QH, Xue YH, et al. Human mesenchymal stem cells inhibit metastasis of a hepatocellular carcinoma model using the mhcc97-h cell line. Cancer Sci. 2010;101:2546–53. doi: 10.1111/j.1349-7006.2010.01738.x. [DOI] [PMC free article] [PubMed] [Google Scholar]
- 17.Li GC, Zhang HW, Zhao QC, et al. Mesenchymal stem cells promote tumor angiogenesis via the action of transforming growth factor β1. Oncol Lett. 2016;11:1089–94. doi: 10.3892/ol.2015.3997. [DOI] [PMC free article] [PubMed] [Google Scholar]
- 18.Li HY, Ju D, Zhang DW, et al. Activation of TGF-β1-CD147 positive feedback loop in hepatic stellate cells promotes liver fibrosis. Sci Rep. 2015;5:16552. doi: 10.1038/srep16552. [DOI] [PMC free article] [PubMed] [Google Scholar]
- 19.Luong KV, Nguyen LT. Cancer treatment - conventional and innovative approaches. The impact of vitamin D in cancer. InTech, Ed Rangel L. open access article:doi 10.5772. 2013 [Google Scholar]
- 20.Millet C, Zhang YE. Roles of Smad3 in TGF-βsignaling during carcinogenesis. Crit Rev Eukaryot Gene Expr. 2007;17:281–93. doi: 10.1615/critreveukargeneexpr.v17.i4.30. [DOI] [PMC free article] [PubMed] [Google Scholar]
- 21.Moon H, Ju HL, Chung SI, et al. Transforming growth factor beta promotes liver tumorigenesis in mice via upregulation of snail. J gastro. 2017;10 doi: 10.1053/j.gastro.2017.07.014. 1053/2017.07.014. [DOI] [PubMed] [Google Scholar]
- 22.Stio M, Martinesi M, Simonim A, et al. The novel vitamin D analog ZK191784 inhibits prostate cancer cell invasion. Anticancer Res. 2011;31:4091–8. [PubMed] [Google Scholar]
- 23.Stolfi C, Marafini I, De Simone V, et al. The dual role of Smad7 in the control of cancer growth and metastasis. Int J Mol Sci. 2013;14:23774–90. doi: 10.3390/ijms141223774. [DOI] [PMC free article] [PubMed] [Google Scholar]
- 24.Sundaresan S, Subramanian P. S-Allylcysteine inhibits circulatory lipid peroxidation and promotes antioxidants in N-nitrosodiethylamineinduced carcinogenesis. Pol J Pharmacol. 2003;55:37–42. [PubMed] [Google Scholar]
- 25.Tang RJ, Shen S, Zhao X, et al. Mesenchymal stem cells-regulated Treg cells suppress colitis-associated colorectal cancer. Stem Cell Res Ther. 2015;6:71. doi: 10.1186/s13287-015-0055-8. [DOI] [PMC free article] [PubMed] [Google Scholar]
- 26.Wakefield LM, Hill CS. Beyond TGFβ:roles of other TGFβsuperfamily members in cancer. Nat Rev Cancer. 2013;13:328–41. doi: 10.1038/nrc3500. [DOI] [PMC free article] [PubMed] [Google Scholar]
- 27.Wang JB, Abnet CC, Chen W, et al. Association between serum 25(OH) vitamin D, incident liver cancer and chronic liver disease mortality in the Linxian Nutrition Intervention Trials:a nested case–control study. Br J Cancer. 2013;109:1997–2004. doi: 10.1038/bjc.2013.546. [DOI] [PMC free article] [PubMed] [Google Scholar]
- 28.Wang ML, Pan CM, Chiou SH, et al. Oncostatin m modulates the mesenchymal-epithelial transition of lung adenocarcinoma cells by a mesenchymal stem cell-mediated paracrine effect. Cancer Res. 2012;72:6051–64. doi: 10.1158/0008-5472.CAN-12-1568. [DOI] [PubMed] [Google Scholar]
- 29.Wang X, Studzinski GP. Activation of extracellular signal-regulated kinases (ERKs) defines the first phase of 1α25-dihydroxyvitamin D3-induced differentiation of HL60 cells. J Cell Biochem. 2001;80:471–82. doi: 10.1002/1097-4644(20010315)80:4<471::aid-jcb1001>3.0.co;2-j. [DOI] [PubMed] [Google Scholar]
- 30.Yulyana Y, Ho IA, Sia KC, et al. Paracrine factors of human fetal MSCs inhibit liver cancer growth through reduced activation of IGF-1R/PI3K/Akt signaling. Mol Ther. 2015;23:746–56. doi: 10.1038/mt.2015.13. [DOI] [PMC free article] [PubMed] [Google Scholar]
- 31.Zhang LT, Fang XQ, Chen QF, et al. Bone marrow-derived mesenchymal stem cells inhibit the proliferation of hepatic stellate cells by inhibiting the transforming growth factor βpathway. Mol Med Rep. 2015;12:7227–32. doi: 10.3892/mmr.2015.4362. [DOI] [PMC free article] [PubMed] [Google Scholar]
- 32.Zhang X, Fan Q, Li Y, et al. Transforming growth factor-beta1 suppresses hepatocellular carcinoma proliferation via activation of Hippo signaling. Oncotarget. 2017;8:29785–94. doi: 10.18632/oncotarget.14523. [DOI] [PMC free article] [PubMed] [Google Scholar]