

Abstract
Background:
Primary cytoreduction surgery followed by chemotherapy is the cornerstone treatment for epithelial ovarian cancer (EOC). In patients with a low probability of optimal primary surgical debulking, neoadjuvant chemotherapy (NACT) followed by interval debulking increases the chance of optimal surgery. The aim of this study was to develop a model to identify preoperative predictors for suboptimal cytoreduction.
Methods:
Medical records of patients with EOC who underwent primary cytoreductive surgery in a referral tertiary gyneco-oncology center were reviewed from 2007 to 2017. Data were collected on a range of characteristics including demographic features, comorbidities, serum tumor markers, hematologic markers, preoperative imaging, surgical procedures, and pathologic reports. Univariate and multivariate analyses were performed to clarify the ability of preoperative factors to predict suboptimal primary surgery.
Results:
The majority of patients (71.3%) who underwent primary cytoreductive surgery were optimally debulked. Based on the Youden index, the best cut-off point for the serum CA125 level to distinguish suboptimal debulking was 420U/ml with 0.730 (95%CI:0.559 to 0.862) sensitivity and 0.783 (0.684 to 0.862) specificity. Multiple logistic regression results showed that serum CA125 level >420 U/ ml (p value <0.001), the presence of liver metastasis on preoperative imaging (p value: 0.041) and ascites (p value: 0.032) or massive ascites (p value:0.010) significantly increased the risk of suboptimal debulking (logit p = 2.36 CA125 level +1.85 Liverinvolvement +1.68 presence of Ascites+ 2.28 Massive Ascites).
Conclusion:
The present study suggests that a serum CA125 level >420 U/ml, the presence of ascites or massive ascites and liver metastasis are strong predictors of suboptimal primary surgery in cases of EOC. Based on the constructed model, with any of these 4 factors, the probability of suboptimal debulking in EOC is more than 80%.
Keywords: Optimal debulking, neoadjuant chemotherapy, CA125, prediction model
Introduction
Ovarian cancer as a common and most fatal genital cancer, is the second gynecologic malignancy in some areas of the world and the most common one in Iran (Siegel et al., 2013; Arab et al., 2013). Primary surgical cytoreduction followed by chemotherapy is the standard management of epithelial ovarian cancer (EOC) (Chi et al., 2009b; Salani et al., 2008; Karlsen et al., 2016).
Many studies have confirmed the significant impact of post-operative residual disease size on patient survival (Bristow et al., 2002; Chi et al., 2006; Eisenhaueret al., 2006; Wimberger et al., 2007; Winter III et al., 2007; Chi et al., 2009a; du Bois et al., 2009; Rutten et al., 2015; Wright et al., 2016). The optimal debulking is defined as a residual tumor less than 1 cm after cytoreductivesurgery (Salani et al., 2008). The suboptimal surgery results in surgical complications and delay in chemotherapy which are against survival (Chi et al., 2009b; Fagotti et al., 2006). If the optimal debulkingis impossible, interval debulking surgery after neoadjuvant chemotherapy (NACT) is a good alternative (Wright et al.,2014; Brockbank et al., 2004; Vergote et al., 2010).
In most cases, if the optimal debulking is feasible, it is preferable to undergo primary surgery, but with the probability of sub-optimal debulking, primary surgery should be avoided (Hacker et al., 2013; Rutten et al., 2016). Therefore, it is important to predict patients who are not able to achieve optimal debulking. There are no precise and generally accepted indications for NACT in guidelines and recommendations (Karlsen et al., 2016; Stuartet al., 2011). In various studies, tumor markers, imaging, andlaparoscopy findings have been used to predict optimal tumor resection probability. In several studies, the high level of tumor markers including HE4 and CA125 and hematologic markers have been used as the predictors of suboptimal debulking (Karlsen et al., 2016; Kang et al., 2010; Chi et al., 2000; Gemer et al., 2001; Saygili et al., 2002; Obeidat et al., 2004; Eoet al., 2016; Vorgias et al., 2009; Ashrafganjoei et al., 2016). In some studies, CT scan findings such as massive ascites, liver parenchymal involvement, suprarenal lymphadenopathy, porta-hepatisinvolvement, intestinal involvement, extensive omental involvement, and diaphragmatic disease have been used for the prediction of suboptimal debulking(Axtell et al., 2007; Salani et al., 2008; Janco et al., 2015; Suidan et al., 2017). Diagnostic laparoscopy might be used for direct detection of tumor extension and more accurate prediction of tumor resect ability (Salani and Bristow, 2012).
It is recommended that any decision on primary surgery versus NACT should be carried out by a team including gyneco-oncologist. Despite the above-mentioned trials, a number of patients still face sub-optimal debulking. This study aimed to determine the predictors of suboptimal debulking for the selection of EOC cases for NACT or primary surgery.
Materials and Methods
Study population
In this study,we reviewed the medical records of the patients with EOC, who underwent primary cytoreductive surgery at Imam-Hossein hospital (the tertiary referral center of gyneco-oncology) in Tehran, Iran from 2007 to 2017. The exclusion criteria were: fertility sparing surgery, surgery for tumor recurrence, insufficient medical history and non-epithelial ovarian tumors. The data were collected using a questionnaire containing a range of questions related to demographic features, comorbidities, serum tumor markerslevel, preoperative imaging (sonography and CT scan), surgical procedures, and complete blood count with differentials, pathologic report, stage and surgical optimal /suboptimal outcome. The optimal debulkingsurgery was defined as the size of each foci of residual disease was <1cm after surgery. The last CBC test result and tumor markers were used for statistical analysis.
Statistical analysis
Continuous data were presented as mean and standard deviation, and categorical data were presented as number and percent. To compare two groups, independent sample t-test, Mann-Whitney test, and chi-squared test were applied. Significant variables resulted from univariate analysis were inserted into the logistic regression model. Hosmer-Lemeshow test was used to assess the goodness of fit. After creating the model, the sensitivity and specificity of the model in predictingthesub-optimal debulking surgery in EOC was evaluated. Area under the ROC curve (AUC) was calculated in order to calculate predictive accuracy of the model in distinguishing optimal and sub-optimal patients. Cut points of CA125 were obtained using Youden Index. Predictive accuracy of cut point was assessed by calculating sensitivity, specificity, positive predictive value(PPV), and negative predictive value(NPV). Significance level was set at 0.05. The statistical analysis wasperformed using R statistical software (version 3.0.1).The study was approved by the University of ShahidBeheshti Medical Research Ethics committee.
Results
From the total of 129 patients subjected to the primary cytoreductive surgery, 91 (72.3%) were optimally debulked. In the studied papulation, 34.4% of patients were stage I, 4.7% were stage II, 54.7% stage were III, and 6.3% were stage IV. The mean age of patients was 50.92±12.65 years, and the age of patients ranged from 20 to 80 years. The comparison of different variables in two groups of optimal and suboptimal cytoreductive patients in univariate analysis revealed the significant impact of serum CA125, platelet count (PLT), absolute lymphocyte count, platelet-lymphocyte ratio (PLR), white blood cell (WBC) count, ascites and omental cake presence, liver parenchymal involvement, tumor stage, tumor histology, and tumor grade in the predicting suboptimal primary cytoreductive surgery (Tables 1 and 2).
Table 1.
Comparison of Clinical and Para-clinical Quantitative Characteristics of Patients Based on Surgical Outcomes
| Total | Optimal | Sub-Optimal | P value | |
|---|---|---|---|---|
| Quantity | ||||
| Parity | 3.03±2.65 | 2.93±2.70 | 3.29±2.53 | 0.070 |
| Age | 50.92±12.65 | 51.20±12.86 | 50.24±12.26 | 0.700 |
| Serum CA125 level | 233 (475.4) | 170.5 (332.5) | 537.7 (1438.5) | <0.001 |
| Serum CEA level | 1.10 (2.51) | 1.10 (2.38) | 1.10 (2.94) | 0.871 |
| Serum Alb | 3.84±0.588 | 3.93±0.543 | 3.67±0.653 | 0.152 |
| Hemoglobin | 11.53±1.39 | 11.50±1.37 | 11.59±1.45 | 0.735 |
| Platelet count | 322 (151) | 309.5(138.5) | 345 (145.5) | 0.014 |
| WBC | 7200 (2900) | 7450(2275) | 6900 (3100) | 0.055 |
| PMN | 5160 (1441) | 5161 (1371) | 4914 (1524) | 0.494 |
| LYMP | 1829.4±626.1 | 1922.9±647.1 | 1597±507.4 | 0.007 |
| Tumor Size (Cm) | 11 (7) | 12 (6) | 11 (9.5) | 0.120 |
| PLR | 176.4 (122.5) | 160 (107.1) | 210.1 (151.8) | 0.001 |
| NLR | 2.87 (1.64) | 2.81(1.39) | 2.87 (2.31) | 0.086 |
Data are represented as mean±SD or median(IQR).platelet-lymphocyte ratio (PLR); white blood cell count (WBC).neutrophil-lymphocyte ratio (NLR); Absolut neutrophil count(PMN); Absolut Lymphocyte count (LYMP)
Table 2.
Description and Comparison of Clinical and Para-clinical Qualitative Characteristics of Patients Based on Surgical Outcomes
| Quantity | Optimal Debulking | P value | |||
|---|---|---|---|---|---|
| Total | Optimal | Sub optimal | |||
| N (%) | N (%) | N (%) | |||
| co morbidity | yes | 53 (41.1) | 39 (42.4) | 14 (37.8) | 0.634 |
| Ascites | absence | 53 (41.4) | 50 (54.3) | 3 (8.1) | <0.001 |
| presence | 43 (33.3) | 28 (30.4) | 15 (40.5) | ||
| massive | 33 (25.6) | 14 (15.2) | 19 (51.4) | ||
| Omental involvement | no | 91 (70.5) | 74 (80.4) | 17 (45.9) | <0.001 |
| Omental cake | 22 (17.1) | 8 (8.7) | 14 (37.8) | ||
| focal | 16 (12.4) | 10 (10.9) | 6 (16.2) | ||
| Plural Effusion | yes | 7 (5.4) | 4 (4.3) | 3 (8.1) | 0.408 |
| Liver involvement | yes | 12 (9.3) | 4 (4.3) | 8 (21.6) | 0.005 |
| Tumor grade | well | 41 (36.6) | 38 (48.1) | 3 (9.1) | <0.001 |
| mod | 25 (22.3) | 16 (20.3) | 9 (27.3) | ||
| poor | 46 (41.1) | 25 (31.6) | 21 (63.6) | ||
| Stage | I | 44 (34.4) | 44 (48.4) | 0 (0) | <0.001 |
| II | 6 (4.7) | 6 (6.6) | 0 (0) | ||
| III | 70 (54.7) | 38 (41.8) | 32 (86.5) | ||
| IV | 8 (6.3) | 3 (3.3) | 5 (13.5) | ||
| Histology | serous papillary | 84 (65.1) | 55 (59.8) | 29 (78.4) | 0.004 |
| mucinous | 19 (14.7) | 16 (17.4) | 3 (8.1) | ||
| endometrioid | 19 (14.7) | 18 (19.6) | 1 (2.7) | ||
| clear cell | 5 (3.9) | 1 (1.1) | 4 (10.8) | ||
| un diff | 2 (1.6) | 2 (2.2) | 0 (0) | ||
The multiple logistic regression results showed that serum CA125 level >420U/ml (OR=10.63, 95%CI (3.36-33.59)), the presence of liver metastasis in preoperative CT scan (OR=6.33, 95%CI (1.08-37.01)), and ascites in preoperative sonography, significantly increased the risk of suboptimal debulking Table3. Suboptimal debulkingAUC (as a function of predictive factors resulted from logistic model) was 0.874 with 95%CI (0.815-0.934); P<0.001. The related logistic regression is as follows:
logit p = 2.36 CA125 level +1.85 Liverinvolvement +1.68 presence of Ascites+ 2.28 Massive Ascites
To investigate the diagnostic accuracy of CA-125 level (as a predictor for suboptimal debulking) the receiver operating characteristics (ROC) curve of CA-125 was calculated. The related AUC was 0.754 (95%CI (0.671 to 0.826); p<0.001). Using the youden index, the best cut-off point of CA125 level was determined at 420 to distinguish suboptimal debulking with the sensitivity of 0.730(95%CI:0.559 to 0.862) and specificity of 0.783 (0.684 to 0.862). The classification of CA125 cut-off point based on optimal debulking status is presented in Table 4.
Table 4.
Diagnostic Accuracy of CA125 for Distinguishing Sub-optimal Debulking
| Debulking | Sensitivity (95%CI) | Specificity | PPV | NPV | Accuracy | |||
|---|---|---|---|---|---|---|---|---|
| level | Optimal (n) | Suboptimal (n) | (95%CI) | (95%CI) | (95%CI) | (95%CI) | ||
| Serum | <=420 | 72 | 10 | 0.730 | 0.783 | 0.575 | 0.878 | 0.767 |
| CA125 | >420 | 20 | 27 | (0.559 -0.862) | (0.684-0.862) | (0.422-0.717) | (0.787-0.940) | (0.683-0.835) |
Table 3.
Logistic Regression Result of Sub-optimal Debulking
| B | S.E. | P value | OR | 95% CI for OR | ||
|---|---|---|---|---|---|---|
| Lower | Upper | |||||
| Serum CA125 level (>420 vs. <420 U/mL) | 2.36 | 0.587 | <0.001 | 10.63 | 3.36 | 33.59 |
| Liver involvement | 1.85 | 0.902 | 0.041 | 6.33 | 1.08 | 37.01 |
| Ascites (Absence or presence) | 1.68 | 0.781 | 0.032 | 5.36 | 1.16 | 24.78 |
| Massive Ascites | 2.28 | 0.890 | 0.010 | 9.79 | 1.71 | 56.03 |
According to the constructed model, the probability of suboptimal primary surgery based on the presence of factors is presented in Table 5.
Table 5.
Probability of Suboptimal Debulking in Primary Surgery of EOC Based on Constructed Model
| Presence of factor | Model score | Probability (%) |
|---|---|---|
| None | 0 | 0 |
| CA125 * | 2.36 | 91 |
| Ascites** | 1.68 | 84 |
| Massive ascites∞ | 2.28 | 90 |
| Liver metastasis ∞∞ | 1.85 | 86 |
| CA125+Acites | 4.04 | 98 |
| Ascites+ Liver metastasis | 3.53 | 97 |
| CA125+ Liver metastasis | 4.21 | 98 |
| Massive ascites+ Liver metastasis | 4.13 | 98 |
| CA125+ Massive Ascites | 4.64 | 99 |
| CA125+Acites+ Liver metastasis | 5.89 | 99 |
| CA125+Massive Ascites+ Liver metastasis | 6.49 | 99 |
CA125, Serum CA125 level more than 420 U/ml;
Ascites: presence or absence of ascites based on sonography;
Massive ascites: presence of massive ascites based on sonography;
liver metastasis: liver involvement in CT scan
Figure 1.
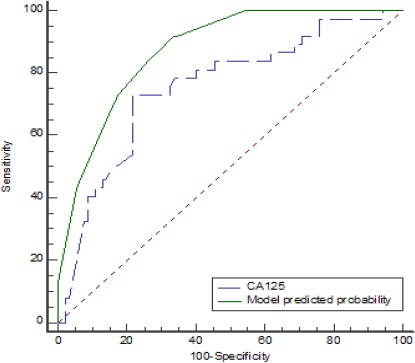
ROC Curves of Predicted Probability of Present Model and Serum CA125 Level for Sub-optimal Surgery.
Discussion
In the present study, Serum CA125 level, massive ascites and liver metastasis are shown assignificantfactors in any decision-making regarding the proper selection of EOC cases for primary surgery or NACT. In the constructed model, the AUC of the suboptimal debulking prediction was 0.874 with 95% CI (0.815-0.934); P<0.001.
Serum CA125 test is widely available and comparably cheap. In the present study, serum CA125 cut-off level of 420 U/ ml resulted in a 10.63 fold-increased risk of suboptimal debulking. With the serum CA125 level of more than 420 U/ml, the risk of suboptimal debulking was 91%. The power of serum CA125 level in prediction of suboptimal operation has already been confirmedin many studies (Chi et al., 2000; Gemer et al., 2001; Saygili et al., 2002; Obeidat et al., 2004; Vorgias et al., 2009; Brockbank et al., 2004; Kang et al., 2010). Brockbank et al., (2004)evaluated the data on 97 advanced ovarian cancers, showed that serum CA125 level is the best predictor of suboptimal operation (OR22.76, 95% CI7.13-72.69) with cut-off value of 586 IU (sensitivity 80.0%, specificity 88.5%, PPV 85. 7%). In a meta-analysis by Skang et al., 2010, serum CA125 level had a strong correlation with suboptimal operation with cut-off value of 500 U/ml. This cut-off value revealed the sensitivity of 68.9% [(95% confidence interval (CI) 62.0–75.1%)] and specificity of 63.2% (95% CI 53.7–71.7%). The positive and negative likelihood ratios were 1.87 (95% CI 1.40–2.50) and 0.49 (95% CI 0.37–0.66), respectively. No doubt, serum CA125 at different levels (420, 500 and 586 U/ml) is a strong predictor of suboptimal debulking (Brockbank et al., 2004; Kang et al., 2010).
In the present study, thepresence of ascites or massive ascites in preoperative sonography increased the risk of suboptimal debulking 5.36 and 9.79 times, respectively. Regarding the presence of ascites or massive ascites, the risk of suboptimal debulkingwas estimated to be 84% and 90%, respectively.Geresteinet al., (2011) predicted suboptimal cytoreductionin 115 advanced ovarian cancers by massive ascites in preoperative CT images (OR=2.29, P=0.039). Brock bank et al., (2004) regarded ascites as one of the predictors of suboptimal debulking in ovarian cancer (OR 3.30, 95% CI1.03-10.62). Furthermore, Jancoet al., (2015) reported that ascites was significantly correlated to suboptimal debulking (P<0.05) (Janco et al., 2015).
Our results showed that liver metastasis in preoperative CT scan, increased the risk of suboptimal debulking6.33 times. In the cases of just liver involvement, the risk of suboptimal debulking was 86%. Parenchymal liver disease which is the stage 4 of ovarian cancer is regarded as a guide to NACT selection (Nelson et al., 1993). In a study by Janco et al. (2015), liver metastasis was reported to be significantly correlated with suboptimal debulking (P<0.001).
In the study of Karlsen et al., (2016) on the creation of a model for suboptimal resection prediction, serum CA125 with the AUC of 0.678 was a predictor of suboptimal resection surgery. While in our study, CA125 AUC was 0.754 in the prediction of suboptimal debulking and the model AUC was 0.874. Rudy S. Suidan et al., (2017) described 3 clinical and 8 radiologic criteria as the predictors of surgery outcomes. They reported that in the multivariate model, age (≥ 60 years), serum CA-125 (≥ 600 U/mL), American Society of Anesthesiologists class (ASA: 3-4), lesions in the root of the superior mesenteric artery, splenic hilum/ligaments, lesser sac N1 cm, gastrohepatic ligament/porta hepatis, fossa/intersegmental fissure, suprarenal lymphadenopathy, small bowel adhesions/thickening and moderate-severe ascites were significantly associated withresidual disease after cytoreductive surgery (Suidan et al., 2017). Wefound that the presence of one of the four factors (ascites, massive ascites, liver metastasis or serum CA125 level more than 420 U/ml) in patients with EOC increases the risk of suboptimal debulking to more than 80% and in the presence of two factors, the risk would be more than 90%. Therefore, each of them might be a guide to select patients for NACT.
Limitations
First, the study was retrospective which was based on the data from a referral tertiary center of gynco-oncology. Second, based on sample size limitation, we were not able to validate our model. In future studies, this model should be validated in different patient groups with larger sample sizes.
In conclusion, in the present study, the model of suboptimal reduction prediction isas follow:
logit p = 2.36 CA125 level +1.85 Liverinvolvement +1.68 presence of Ascites + 2.28 Massive Ascites.
The presence of one of the factors (serum CA125 levels, massive ascites and liver involvement) in patients is the predicator of suboptimal surgery with a probability of more than 80%, while the presence of two of the factors is the predicator of suboptimal surgery with a probability of more than 90%. In this study, we were able to concurrently evaluate the variables affecting the primary surgical outcomes in patients with EOC, which can be used in clinical decision making to select a treatment strategy.
Acknowledgements
We would like to thank the nursing, the administrative and secretarial staff of the obstetrics and gynecology department and clinic at Imam Hossein hospital for their contribution to the maintenance of our patient record without which this project would have been impossible.
References
- 1.Arab M, Noghabaei G. Ovarian cancer incidence in Iran and the world. Rep Pract Oncol Radiother. 2013;1:67–72. [Google Scholar]
- 2.Ashrafganjoei T, Mohamadianamiri M, Farzaneh F, et al. Investigating preoperative hematologic markers for prediction of ovarian cancer surgical outcome. Asian Pac J Cancer Prev. 2016;17:1445–8. doi: 10.7314/apjcp.2016.17.3.1445. [DOI] [PubMed] [Google Scholar]
- 3.Axtell AE, Lee MH, Bristow RE, et al. Multi-institutional reciprocal validation study of computed tomography predictors of suboptimal primary cytoreduction in patients with advanced ovarian cancer. J Clin Oncol. 2007;25:384–9. doi: 10.1200/JCO.2006.07.7800. [DOI] [PubMed] [Google Scholar]
- 4.Bristow RE, Tomacruz RS, Armstrong DK, et al. Survival effect of maximal cytoreductive surgery for advanced ovarian carcinoma during the platinum era:a meta-analysis. J Clin Oncol. 2002;20:1248–59. doi: 10.1200/JCO.2002.20.5.1248. [DOI] [PubMed] [Google Scholar]
- 5.Brockbank E, Ind T, Barton D, et al. Preoperative predictors of suboptimal primary surgical cytoreduction in women with clinical evidence of advanced primary epithelial ovarian cancer. Int J Gynecol Cancer. 2004;14:42–50. doi: 10.1111/j.1048-891x.2004.14065.x. [DOI] [PubMed] [Google Scholar]
- 6.Chi D, Eisenhauer E, Lang J, et al. What is the optimal goal of primary cytoreductive surgery for bulky stage IIIC epithelial ovarian carcinoma (EOC)? Gynecol Oncol. 2006;103:559–64. doi: 10.1016/j.ygyno.2006.03.051. [DOI] [PubMed] [Google Scholar]
- 7.Chi DS, Eisenhauer EL, Zivanovic O, et al. Improved progression-free and overall survival in advanced ovarian cancer as a result of a change in surgical paradigm. Gynecol Oncol. 2009a;114:26–31. doi: 10.1016/j.ygyno.2009.03.018. [DOI] [PubMed] [Google Scholar]
- 8.Chi DS, Venkatraman ES, Masson V, et al. The ability of preoperative serum CA-125 to predict optimal primary tumor cytoreduction in stage III epithelial ovarian carcinoma. Gynecol Oncol. 2000;77:227–31. doi: 10.1006/gyno.2000.5749. [DOI] [PubMed] [Google Scholar]
- 9.Chi DS, Zivanovic O, Palayekar MJ, et al. A contemporary analysis of the ability of preoperative serum CA-125 to predict primary cytoreductive outcome in patients with advanced ovarian, tubal and peritoneal carcinoma. Gynecol Oncol. 2009b;112:6–10. doi: 10.1016/j.ygyno.2008.10.010. [DOI] [PubMed] [Google Scholar]
- 10.du Bois A, Reuss A, Pujade-Lauraine E, et al. Role of surgical outcome as prognostic factor in advanced epithelial ovarian cancer:a combined exploratory analysis of 3 prospectively randomized phase 3 multicenter trials. Cancer. 2009;115:1234–44. doi: 10.1002/cncr.24149. [DOI] [PubMed] [Google Scholar]
- 11.Eisenhauer EL, Abu-Rustum NR, Sonoda Y, et al. The addition of extensive upper abdominal surgery to achieve optimal cytoreduction improves survival in patients with stages IIIC–IV epithelial ovarian cancer. Gynecol Oncol. 2006;103:1083–90. doi: 10.1016/j.ygyno.2006.06.028. [DOI] [PubMed] [Google Scholar]
- 12.Eo W, Kim H-B, Lee YJ, et al. Preoperative lymphocyte-monocyte ratio is a predictor of suboptimal cytoreduction in stage III-IV epithelial ovarian cancer. J Cancer. 2016;7:1772–9. doi: 10.7150/jca.15724. [DOI] [PMC free article] [PubMed] [Google Scholar]
- 13.Fagotti A, Ferrandina G, Fanfani F, et al. A laparoscopy-based score to predict surgical outcome in patients with advanced ovarian carcinoma:a pilot study. Ann Sur Oncol. 2006;13:1156–61. doi: 10.1245/ASO.2006.08.021. [DOI] [PubMed] [Google Scholar]
- 14.Gemer O, Segal S, Kopmar A. Preoperative CA-125 level as a predictor of non optimal cytoreduction of advanced epithelial ovarian cancer. Acta Obstet Gynecol Scand. 2001;80:583–5. [PubMed] [Google Scholar]
- 15.Gerestein CG, Eijkemans MJ, Bakker J, et al. Nomogram for suboptimal cytoreduction at primary surgery for advanced stage ovarian cancer. Anticancer Res. 2011;31:4043–9. [PubMed] [Google Scholar]
- 16.Hacker N. State of the art of surgery in advanced epithelial ovarian cancer. Ann Oncol. 2013;24:27–32. doi: 10.1093/annonc/mdt465. [DOI] [PubMed] [Google Scholar]
- 17.Janco JMT, Glaser G, Kim B, et al. Development of a prediction model for residual disease in newly diagnosed advanced ovarian cancer. Gynecol Oncol. 2015;138:70–7. doi: 10.1016/j.ygyno.2015.04.013. [DOI] [PubMed] [Google Scholar]
- 18.Kang S, Kim TJ, Nam BH, et al. Preoperative serum CA-125 levels and risk of suboptimal cytoreduction in ovarian cancer:A meta-analysis. J Surg Oncol. 2010;101:13–7. doi: 10.1002/jso.21398. [DOI] [PubMed] [Google Scholar]
- 19.Karlsen MA, Fagö-Olsen C, Høgdall E, et al. A novel index for preoperative, non-invasive prediction of macro-radical primary surgery in patients with stage IIIC–IV ovarian cancer-a part of the Danish prospective pelvic mass study. Tumor Biol. 2016;37:12619–26. doi: 10.1007/s13277-016-5166-z. [DOI] [PubMed] [Google Scholar]
- 20.Nelson BE, Rosenfield AT, Schwartz PE. Preoperative abdominopelvic computed tomographic prediction of optimal cytoreduction in epithelial ovarian carcinoma. J Clin Oncol. 1993;11:166–72. doi: 10.1200/JCO.1993.11.1.166. [DOI] [PubMed] [Google Scholar]
- 21.Obeidat B, Latimer J, Crawford R. Can optimal primary cytoreduction be predicted in advanced stage epithelial ovarian cancer?Role of preoperative serum CA-125 level. Gynecol Obstet Invest. 2004;57:153–6. doi: 10.1159/000076236. [DOI] [PubMed] [Google Scholar]
- 22.Rutten IJ, van de Laar R, Kruitwagen RF, et al. Prediction of incomplete primary debulking surgery in patients with advanced ovarian cancer:An external validation study of three models using computed tomography. Gynecol Oncol. 2016;140:22–8. doi: 10.1016/j.ygyno.2015.11.022. [DOI] [PubMed] [Google Scholar]
- 23.Rutten MJ, van de Vrie R, Bruining A, et al. Predicting surgical outcome in patients with International Federation of Gynecology and Obstetrics stage III or IV ovarian cancer using computed tomography:a systematic review of prediction models. Int J Gynecol Cancer. 2015;25:407–15. doi: 10.1097/IGC.0000000000000368. [DOI] [PubMed] [Google Scholar]
- 24.Salani R, Axtell A, Gerardi M, et al. Limited utility of conventional criteria for predicting unresectable disease in patients with advanced stage epithelial ovarian cancer. Gynecol Oncol. 2008;108:271–5. doi: 10.1016/j.ygyno.2007.11.004. [DOI] [PubMed] [Google Scholar]
- 25.Salani R, Bristow RE. Surgical management of epithelial ovarian cancer. Clin Obstet Gynecol. 2012;55:75–95. doi: 10.1097/GRF.0b013e31824b4629. [DOI] [PubMed] [Google Scholar]
- 26.Saygili U, Guclu S, Uslu T, et al. Can serum CA-125 levels predict the optimal primary cytoreduction in patients with advanced ovarian carcinoma? Gynecol Oncol. 2002;86:57–61. doi: 10.1006/gyno.2002.6719. [DOI] [PubMed] [Google Scholar]
- 27.Siegel R, Naishadham D, Jemal A, et al. Epithelial carcinoma of the ovary, fallopian tube, and peritoneum:Epidemiology and risk factors. CA Cancer J Clin. 2013;63:11–30. [Google Scholar]
- 28.Stuart GC, Kitchener H, Bacon M, et al. 2010 Gynecologic cancer inter group (GCIG) consensus statement on clinical trials in ovarian cancer:report from the fourth ovarian cancer consensus conference. Int J Gynecol Cancer. 2011;21:750–5. doi: 10.1097/IGC.0b013e31821b2568. [DOI] [PubMed] [Google Scholar]
- 29.Suidan RS, Ramirez PT, Sarasohn DM, et al. A multicenter assessment of the ability of preoperative computed tomography scan and CA-125 to predict gross residual disease at primary debulking for advanced epithelial ovarian cancer. Gynecol Oncol. 2017;145:27–31. doi: 10.1016/j.ygyno.2017.02.020. [DOI] [PMC free article] [PubMed] [Google Scholar]
- 30.Vergote I, Tropé CG, Amant F, et al. Neoadjuvant chemotherapy or primary surgery in stage IIIC or IV ovarian cancer. N Engl J Med. 2010;363:943–53. doi: 10.1056/NEJMoa0908806. [DOI] [PubMed] [Google Scholar]
- 31.Vorgias G, Iavazzo C, Savvopoulos P, et al. Can the preoperative Ca-125 level predict optimal cytoreduction in patients with advanced ovarian carcinoma?A single institution cohort study. Gynecol Oncol. 2009;112:11–5. doi: 10.1016/j.ygyno.2008.09.020. [DOI] [PubMed] [Google Scholar]
- 32.Wimberger P, Lehmann N, Kimmig R, et al. Prognostic factors for complete debulking in advanced ovarian cancer and its impact on survival. An exploratory analysis of a prospectively randomized phase III study of the Arbeitsgemeinschaft Gynaekologische Onkologie Ovarian Cancer Study Group (AGO-OVAR) Gynecol Oncol. 2007;106:69–74. doi: 10.1016/j.ygyno.2007.02.026. [DOI] [PubMed] [Google Scholar]
- 33.Winter III WE, Maxwell GL, Tian C, et al. Prognostic factors for stage III epithelial ovarian cancer:a gynecologic oncology group study. J Clin Oncol. 2007;25:3621–7. doi: 10.1200/JCO.2006.10.2517. [DOI] [PubMed] [Google Scholar]
- 34.Wright AA, Bohlke K, Armstrong DK, et al. Neoadjuvant chemotherapy for newly diagnosed, advanced ovarian cancer:Society of gynecologic oncology and American society of clinical oncology clinical practice guideline. J Clin Oncol. 2016;34:3460–73. doi: 10.1200/JCO.2016.68.6907. [DOI] [PMC free article] [PubMed] [Google Scholar]
- 35.Wright JD, Ananth CV, Tsui J, et al. Comparative effectiveness of upfront treatment strategies in elderly women with ovarian cancer. Cancer. 2014;120:1246–54. doi: 10.1002/cncr.28508. [DOI] [PMC free article] [PubMed] [Google Scholar]