Abstract
The origin of the unusually high stability of the sialic acid (SA) and phenylboronic acid (PBA) complex was investigated by a combined nuclear magnetic resonance (NMR) spectroscopy and density functional theory (DFT) study. SA is a glycan‐terminating monosaccharide, and its importance as a clinical target has long been recognized. Inspired by the fact that the binding properties of SA–PBA complexation are anomalously high relative to those of typical monosaccharides, great effort has been made to build a clinical platform with the use of PBA as a SA‐selective receptor. Although a number of applications have been reported in recent years, the ability of PBA to recognize SA‐terminating surface glycans selectively is still unclear, because high‐affinity SA–PBA complexation might not occur in a physiological environment. In particular, different forms of SA (α‐ and β‐pyranose) were not considered in detail. To answer this question, the combined NMR spectroscopy/DFT study revealed that the advantageous binding properties of the SA–PBA complex arise from ester bonding involving the α‐carboxylate moieties (C1 and C2) of β‐SA but not α‐SA. Moreover, the facts that the C2 atom is blocked by a glycoside bond in a physiological environment and that α‐SA basically exists on membrane‐bound glycans in a physiological environment lead to the conclusion that PBA cannot selectively recognize the SA unit to discriminate specific types of cells. Our results have a significant impact on the field of SA‐based cell recognition.
Keywords: binding properties, cell recognition, density functional calculations, NMR spectroscopy, structure elucidation
1. Introduction
Sialic acid (SA) is a naturally occurring monosaccharide that refers to a group of N‐ and O‐substituted neuraminic acids.1 The most important SA is N‐acetylneuraminic acid (Neu5Ac), which is typically found at the termini of membrane‐bound glycan motifs of various organisms,2, 3 and its expression level was proven to correlate strongly with various important diseases such as cardiovascular and neurological diseases and cancer metastasis.4, 5, 6 Whereas the importance of SA as a biomarker has long been recognized, it remains challenging to build a clinical platform due to the limited availability of lectins and glycan‐specific antibodies.7, 8
Among the various artificial receptors, phenylboronic acid (PBA) has attracted much attention for its ability to reversibly form stable esters with 1,2‐ and 1,3‐cis‐diol/polyol‐containing molecules in aqueous media.9 Moreover, PBA shows anomalously high binding affinity towards SA relative to other typical sugars, enabling selective recognition.10 For instance, PBA has been incorporated with polymers11 and self‐assembled monolayers12 to target SA. More recently, SA recognition by using PBA was successfully applied to recognize specific types of cells and viruses.13, 14, 15, 16, 17, 18, 19, 20, 21 Despite reports of such applications, the ability of PBA to discriminate specific cells by binding of SA remains questionable, because there is a possibility that SA–PBA complexation may not occur in a physiological environment, as we discuss in the following.
The molecular structure of SA, in particular that of Neu5Ac, is shown in Figure 1. Similar to most monosaccharides, SA forms an equilibrium involving cyclic and acyclic forms in aqueous media with the ratio of these isomers shown in the figure (the equilibrium also involves the keto–enol forms, which are not included because their existence is negligible in complexation).22 According to previous investigations of SA–PBA complexation, C1C2, C7C8, C8C9, and C7C9 (the label of each distinct carbon atom is also shown in Figure 1) were proposed as possible binding sites.23, 24 The first detailed investigation of the structure of the SA–PBA complex was reported by using 1H NMR and 13C NMR spectroscopy, by which it was concluded that the high stability of the SA–PBA complex originated from C7C8 binding.23 Moreover, another report based on a study in which PBA and borates were used as models suggested that the molecular structure of the SA–PBA complex was pH dependent; at pH<8, C1C2 binding was favored, and at pH>8, C8C9 or C7C9 binding was favored.24 Thus, there are at least two possibilities for the origin of the anomalously high binding profile for SA–PBA complexation: C1C2 including the α‐carboxylate functionality and two of C7, C8, and C9 on the distinctive carbon chain end. If the latter is the case, PBA may be able to recognize and distinguish SA from other saccharide functionalities on the surface glycan. However, if the former is the case, PBA may not be able to discriminate, or even recognize, SA on glycan motifs, because the C2 atom is blocked by glycoside bonding. Furthermore, in both studies, different forms of SA (α‐ and β‐pyranose) were not considered in detail. Such a consideration is important, however, because only α‐SA exists on membrane‐bound glycans in a physiological environment.25, 26 Though the properties of SA–PBA complexation are not fully agreed upon, no further studies have been reported. Therefore, it is important to identify the most stable structure of the complex.
Figure 1.
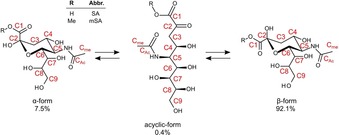
Schematic illustration of the cyclic/acyclic forms of sialic acid in equilibrium. For comparative analysis, SA (R=H) and mSA (R=Me) were used. Each carbon atom is distinguished by numbers. The percentage represents the relative ratio of each form existing in solution.
In this study, we adopt an approach in which 11B/13C NMR spectroscopy and density functional theory (DFT) simulations are combined to elucidate the origin of the high‐affinity binding properties of α‐ or β‐SA–PBA, considering some of the advantages of NMR spectroscopy and DFT generally mentioned in previous work (also see Section S1 in the Supporting Information). Also, 4‐vinylphenylboronic acid (VPBA) was utilized as a model of PBA in the investigation, because it is one of the most commonly used agents in an application incorporating polymers.11, 14, 27, 28
2. Results and Discussion
2.1. NMR Spectra of the SA–PBA Complex
Prior to the investigation, we defined a total of 16 possible SA–PBA complex structures on the basis of the following considerations: the aqueous equilibrium of SA and VPBA (Figures 1 and 2) and previous studies.23, 24 As previously indicated, the α (7.5 %) and β (92.1 %) forms have different stabilities in aqueous media; thus, complexation of both forms must be taken into consideration (the amount of the acyclic form is negligible). Likewise, PBA forms a pH‐dependent equilibrium between a nonionic, trigonal form [VPB(OH)2] and an anionic, tetrahedral form [VPB(OH)3 −]. Thus, for each α or β form of SA and for each nonionic or anionic form of VPBA, C1C2, C7C8, C8C9, and C7C9 bindings can be considered (giving a total of 16 structures, as shown in Figure 2). The binding affinity of PBA to the diol is pH dependent, and it is generally understood that the VPB(OH)3 − complex is considerably more stable than the VPB(OH)2 complex.29
Figure 2.
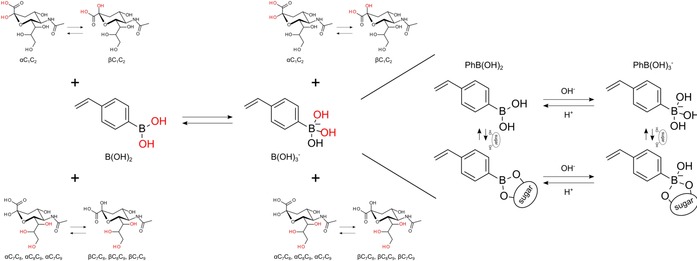
A total of 16 possible SA–VPBA complex structures is illustrated. The OH groups colored in red correspond to the binding diols. For C7, C8, and C9, the possible bindings are C7C8, C8C9, and C7C9. In particular, 4VPBA is shown in the below drawing. Boron in a nonionic, trigonal state is favored at low pH (<8.5), whereas boron in an anionic, tetrahedral state is favored at high pH (>8.5).
First, the 11B NMR spectra were recorded to define the carbon atoms involved in complexation. The NMR spectra of an equimolar mixture of SA/VPBA in an aqueous buffer (pH 5) and in DMSO are shown in Figure 3 a, b. A pH value of 5 was chosen because complexation reaches a maximum at this pH point.23 Two distinct signals were observed in both cases, indicating the existence of both free and complexed VPBA in both systems. The formation of the SA–PBA complex could be further quantified by using the conditional formation constant (K). As explained in Section S2, K indicates the affinity of complexation and can be determined by integrating the signals in the 11B NMR spectra. The values of K for a SA–VPBA complex in aqueous buffer and DMSO were estimated to be 36.1 and 26.7 m −1, respectively (see Table S1). The former is in good agreement with the value reported previously for aqueous systems.23 Note that the values are slightly different because of the differences in the para substituents (vinyl group). Interestingly, although the amount of complexation was slightly smaller, SA–VPBA complexation still occurred in an organic solvent with a comparably high conditional formation constant. This result will be further discussed below together with the DFT calculations.
Figure 3.
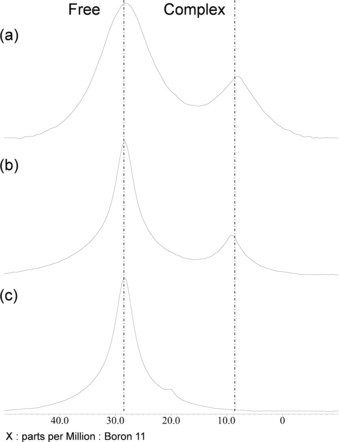
Experimental 11B NMR spectra: a) SA and VPBA in phosphate buffer (pH controlled to 5), b) SA and VPBA in DMSO, and c) mSA and VPBA in DMSO. Concentrations of SA, mSA, and VPBA were all set to 10 mm.
The similarity of the chemical shifts of the signals for the free species and the complex in aqueous and organic solutions also suggests that the structural characteristics are identical regardless of the solution type. With this assumption, the results were compared with the 11B NMR spectrum obtained for a 1 equivalent mixture of mSA/VPBA in DMSO (Figure 3 c). Only a single resonance at δ=28.3 ppm was observed. Thus, no complexation occurred in this case. Therefore, the C1 atom is likely to be incorporated by esterification of the SA–VPBA complex, because in mSA, the hydroxy group of the carboxy C1 atom is blocked by the methyl group (Figure 1). Also, a small shoulder signal at about δ=20 ppm can be observed in Figure 3 c. From the above and following considerations, the lack of binding of diol SA to PBA corresponds to the small shoulder signal at about δ=20 ppm in Figure 3 c; thus, this unclear small resonance does not substantially change our conclusions in this paper.
Next, the 11B NMR spectra of butanediols (BDs) [i.e. 1,2‐butanediol (12BD), 1,3‐butanediol (13BD), and 2,3‐butanediol (23BD)] and VPBA were obtained to clarify the possibility of complexation occurring at C7C8, C8C9, or C7C9. BDs were chosen for comparison with SA because their structures are identical to the carbon‐chain end of SA (12BD, 13BD, and 23BD correspond to C7C8, C8C9, and C7C9, respectively). The results are summarized in Figure 4. The NMR spectra were measured both in DMSO (Figure 4 a–c) and in aqueous media (Figure 4 d–f) at pH 10 because esterification at C8C9 and C7C9 at a high pH (>8) was previously reported.24 Accordingly, only a single resonance was observed in all of the measurements; thus, no complexation was likely to have occurred between BD and VPBA, even at a high pH value. It is commonly understood that the conditional formation constant of PBA and diol/polyols on a carbon chain is lower than that of diol/polyols on a ring (such as sugar), so the result is reasonable.30 Thus, even if the complexation occurred at the carbon chain end of SA, it was less likely to be at the origin of the high‐affinity binding properties. From the 11B NMR spectra, we conclude that the C1C2 diol, the one involving the α‐carboxylate, and not C7, C8, or C9 is important in high‐affinity SA–PBA binding.
Figure 4.
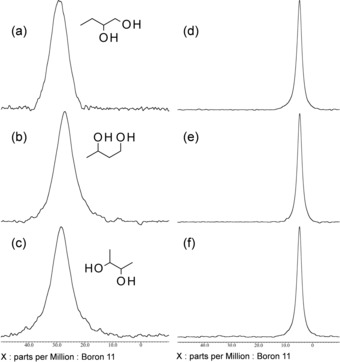
Experimental 11B NMR spectra of mixtures of butanediols and VPBA: a, d) 1,2‐Butanediol and VPBA, b, e) 1,3‐butanediol and VPBA, and c, f) 2,3‐butanediol and VPBA. The spectra in panels a–c were measured in DMSO, whereas the spectra in panels d–f were measured in carbonate buffer (pH 10). All chemicals were measured at 10 mm. Notably, there is a slight shift in the free PBA signals in the spectra recorded in DMSO and aqueous solution, because most PBA is in a nonionic (electron‐deficient) state in DMSO and in an anionic (electron‐rich) state in an aqueous solution of high pH (>8.5).
To take α‐ and β‐SA further into consideration, the 13C NMR of SA and SA–VPBA (1 m in DMSO) were recorded, and the results are shown in Figure 5. Moreover, the detailed spectra of each region are shown in Figure S1. The 13C NMR spectra were recorded in DMSO to achieve signal resolution so that the distinct signals could be clearly distinguished. α‐ and β‐SA can be discriminated in the 13C NMR spectra by calculating the ratio of the signals integrals, as they are proportional to the molar quantity of each distinct molecule. In a solution of SA (Figure 5 a and Figure S1 a), the integral ratio of the two signals at chemical shifts of approximately δ=19.5 and 23.6 ppm is 8:92; this is very close to the ratio of the amounts of α‐ and β‐SA (7.5:92.1). The profiles of the 13C NMR chemical shifts are also shown in Table S2. Thus, these two signals correspond to α‐Cme and β‐Cme, respectively (the label of each distinct carbon atom is also shown in Figure 1). However, C3 could not be determined because the signal was hidden by the signal of DMSO.23 Also, the ratio of the acyclic form was too low (<1 %) for it to be distinguished.
Figure 5.
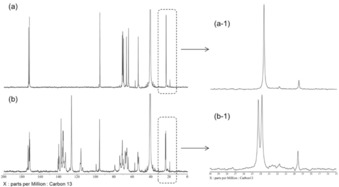
Experimental 13C NMR spectra: a) 1 m SA in DMSO and b) mixture of 1 m SA and 1 m VPBA in DMSO. Magnification of the Cme signals in the 13C NMR spectra of a‐1) 1 m SA and b‐1) 1 m SA–VPBA in DMSO are also shown.
Then, the results were compared with a mixture of SA and PBA in DMSO. Accordingly, in a mixture of SA and VPBA (Figure 5 b), only three signals at δ=19.6, 23.8, and 24.3 ppm were observed in the corresponding region (Figure S1 a). If both α‐ and β‐SA formed a complex with VPBA, four distinct signals would have been observed (free α‐Cme, free β‐Cme, complex α‐Cme, and complex β‐Cme). However, calculation of the signal integral ratio indicated that only β‐SA, and not α‐SA, formed a complex with VPBA; thus, only three signals (free α‐Cme, free β‐Cme, and complex β‐Cme) were observed. The same trend was found for C5 and C2 (Figure S1 b, d). For example, the signals at δ=57.6, 54.3, and 53.4 ppm correspond to free α‐C5, free β‐C5, and complex β‐C5, respectively (Figure S1 b). Therefore, together with the 11B NMR spectroscopy results previously given, we hypothesize that the most favorable structure of the SA–PBA complex is achieved through β‐C1C2 binding. The signals of the complex at around δ=60 to 80 ppm (Figure S1 c) are related to hydroxy‐substituted carbon atoms (C‐OH: C4, C6, C7, C8, and C9). These signals, as well as the ones corresponding to the carbonyl‐substituted carbon atoms (Figure S1 e) at around δ=170 to 180 ppm, are densely packed, which makes it difficult to distinguish the corresponding carbon atoms. Nonetheless, the number of signals does not contradict our hypothesis.
2.2. DFT Calculations for the SA–PBA Complex and Comparison with Experimental Results
To examine the validity of the experimental hypothesis, the 11B NMR and 13C NMR chemical shifts were also determined by DFT calculations. The calculated 11B NMR chemical shifts are listed in Table 1 (DFT calculations for the 13C NMR chemical shifts are listed in Figure S2). As expected from the experimental results, the two resonances at δ=28.2 and 8.60 ppm observed in Figure 3 a, b agree with the values for free VPB(OH)2 and the C1C2‐bound SA–VPBA complex [C1C2–VPB(OH)3 −] calculated by DFT (δ=28.8 ppm for free VPBA, δ=8.68 and 8.91 ppm for the α‐ and β‐C1C2 complexes, respectively), although correspondence of the experimental signal at δ=8.60 ppm with either the α‐ or β‐C1C2 complex could not be determined from these results alone. The calculation was in good agreement with the experimental results; thus, the calculation could be used to further analyze the experimental data. However, complexation in DMSO was unexpected, as also mentioned in the previous section. The results indicate that PBA in the complex structure is in an anionic state even in the organic solvent, in which water molecules do not exist (Figure 3 b). To explain this phenomenon, we propose a mechanism by which water molecules formed by SA–PBA esterification may be utilized in the ionization of PBA.
Table 1.
DFT calculation of the 11B NMR chemical shifts of the SA–VPBA complex. The chemical shifts of boron for 16 possible complex structures are shown.[a]
| Binding site | Isomer | δ(11B) [ppm] | |
|---|---|---|---|
| VPB(OH)2 | VPB(OH)3 ‐ | ||
| 1–2 | α | 32.8 | 8.68 |
| β | 33.0 | 8.91 | |
| 7–8 | α | 29.3 | 7.12 |
| β | 29.3 | 7.30 | |
| 7–9 | α | 24.8 | 3.71 |
| β | 26.1 | 3.41 | |
| 8–9 | α | 30.6 | 9.75 |
| β | 30.4 | 9.65 | |
[a] The chemical shift of free VPB(OH)2 was calculated by DFT to be δ=28.8 ppm.
Finally, the energy of each atomistic structure was calculated by DFT simulations to examine the experimental hypothesis and to elucidate the stable conformation. The calculations determined the optimized conformation of each tested complex structure, and this enabled comparison of their relative stabilities. Notably, in the calculations, only structures with the same molecular formula could be compared. Therefore, for the SA–VPB(OH)2 and SA–VPB(OH)3 − complexes, each atomistic energy difference was calculated relative to β‐C1C2–VPB(OH)2 and β‐C1C2–VPB(OH)3 −, respectively, for which the results are listed in Table 2 (thus, ΔE shows the relative stability of the complex with the optimized conformation). First, the relative stabilities of C1C2–PBA and C7C8C9–PBA (C7C8–PBA, C8C9–PBA, or C7C9–PBA) were compared. For the SA–VPB(OH)2 complexes, there were few differences in the stabilities of each structure. The energy deviations were less than 10 kcal mol−1 from the values of the β‐C1C2–PBA formations. On the other hand, for the SA–VPB(OH)3 − complexes, C1C2–PBA was about 10 to 30 kcal mol−1 more stable than C7C8C9–PBA. Therefore, the calculation strongly supports our hypothesis that C1C2 binding to VPB(OH)3 − but not VPB(OH)2 is responsible for the high‐affinity complexation. Next, the relative stabilities of the α and β complexes were also investigated. For both the C1C2–VPB(OH)2 and C1C2–VPB(OH)3 − complexes, the β complex was more stable than the α complex (Table 2), even if a small error may occur in the DFT simulation.31 The results can be explained by the steric effect caused by interaction of the oxygen atom (=O) of the carboxy group and the other oxygen atoms in the SA ring (Figure S3). Thus, the β complex becomes significantly more stable than the α complex. This explains why only the signal for the β complex is observed in the 13C NMR spectra (Figure S1). Thus, the most likely stable conformation of β‐C1C2–VPB(OH)3 − was obtained by DFT simulations, as shown in Figure 6. Together with the experimental hypothesis and DFT calculations, we conclude that the β‐C1C2–VPB(OH)3 − structure has the highest affinity of the SA and PBA complexation.
Table 2.
DFT calculation of the stability energy of 16 possible complex structures relative to that of β‐SA‐C1C2–PBA‐VPB(OH)3 −.
| Binding site | Isomer | ΔE [kcal mol−1] | |
|---|---|---|---|
| SA‐VPB(OH)2 | SA‐VPB(OH)3 − | ||
| 1–2 | α | 8.6 | 2.9 |
| β | 0 | 0 | |
| 7–8 | α | −8.3 | 13.8 |
| β | −6.0 | 14.0 | |
| 7–9 | α | −2.2 | 22.6 |
| β | 0.5 | 22.1 | |
| 8–9 | α | −4.8 | 24.9 |
| β | −2.5 | 25.6 | |
Figure 6.
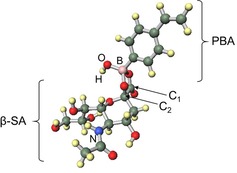
Optimized structure of β‐1,2‐VPB(OH)3 − derived from DFT calculations.
In addition, Otsuka et al. reported, by assuming that complexation occurred at C7C8, C8C9, or C7C9, that the complexation behavior of 3‐(propionamido)phenylboronic acid (PAPBA) with Neu5Ac was stabilized through the coordination of the amide NH or CO group located at the C5 position of Neu5Ac to form a B−N or B−O linkage.23 However, the optimal length for a typical B−N bond is 1.6–1.7 Å, but the calculated length for the B−N bond in the β‐C7C9–VPB(OH)3 − complex was about 4 Å in this study, which is in good agreement with that calculated in another previous paper.24 Consequently, the B−N bond is not very strong, because the length of a B−N bond calculated in this study is twice as large as that of a typical B−N bond, that is, C7C8, C8C9, or C7C9 binding to PBA, as supported by coordination of the amide NH group located at the C5 position of SA, and this would not be assumed as the main site of the SA–VPB(OH)3 − complex in this study.
3. Conclusions
In the present study, through a combined NMR spectroscopy and DFT calculations study, we investigated the origin of the formation of a highly stable α‐ or β‐sialic acid (SA)–phenylboronic acid (PBA) complex to determine whether PBA could be used as a SA‐specific receptor for clinical applications. As a result, we clarified that the advantageous binding properties of SA and PBA complex arose from ester bonding involving the α‐carboxylate moieties (C1 and C2) of β‐SA but not α‐SA. Therefore, we conclude that PBA cannot selectively recognize SA at the termini of cell‐surface glycans or discriminate specific types of cells, because the binding site responsible for high‐affinity binding is blocked by a glycoside bond and because α‐SA mostly exists on membrane‐bound glycans in a physiological environment.25, 26 Consequently, the sialic acids of membrane‐bound glycans do not include the most selective binding site to PBA, whereas isolated sialic acids in blood are targeted for the SA–PBA complex‐based biosensor.32 However, the structural conversion of phenyl boronate species contributes to a decrease in the pK a value, and this results in the favorable interaction of SA and PBA at physiological pH levels;33, 34, 35 furthermore, the crystal structure data for the SA‐trisaccharide derivative with the active site of the serum protein complement factor H assumes interaction of the 2,3‐hydroxy groups of the glycerol moiety and the amide carbonyl oxygen atom in such SA derivatives with PBA.36 Therefore, we need to correctly consider the structure of the SA–PBA complex to recognize specific types of cells and viruses selectively.
Experimental Section
Chemicals
4‐Vinylphenylboronic acid (VPBA), N‐acetylneuraminic acid (Neu5Ac), and N‐acetylneuraminic acid methyl ester were purchased from Tokyo Chemical Industry Co., Ltd. (Tokyo, Japan). Deionized water, dimethyl sulfoxide (DMSO), 1 m sodium hydroxide (NaOH), 1 m hydrochloric acid (HCl), 1,2‐butanediol (12BD), 1,3‐butanediol (13BD), and 2,3‐butanediol (23BD) were purchased from Wako Pure Chemical Industry Co., Ltd. (Osaka, Japan).
NMR Spectroscopy
11B NMR and 13C NMR spectra were measured by using a JEOL ECX‐400 Fourier‐transform spectrometer operating at 128.3 and 100.5 MHz, respectively, without a field frequency lock. To avoid broadening of the signals, a quartz glass tube was purchased from Shigemi Ltd. (Tokyo, Japan) for 11B NMR measurements. For 13C NMR measurements, a Duran (borosilicate) glass tube, also purchased from Shigemi, was used. Sample tubes with diameters of 10 mm were used, and the temperature was controlled at 25 °C for all measurements. Chemical shifts were referenced to external BF3 ⋅OEt2 and Si(CH3)4 for 11B NMR and 13C NMR, respectively. The signal integrals were calculated by Delta NMR integration software (JEOL, Ltd.). The integrals of overlapping signals were calculated by fitting each curve with a Lorentzian function by using the same software.
The measurement samples for aqueous 11B NMR spectroscopy were prepared by following a general procedure. 20 mm VPBA and 100 mm SA in deionized water were prepared. VPBA (500 μL), SA (100 μL), NaOH (10 μL), and stock buffer solution (390 μL) with a favorable pH were mixed to form a 1 mL mixture of 10 mm SA and 10 mm VPBA. The pH was modified by adding a small amount of HCl or NaOH and was measured by using a pH meter. For the 11B NMR and 13C NMR spectra in DMSO, the samples were prepared simply by taking appropriate amounts of SA and VPBA in a 1.5 mL Eppendorf tube and adding DMSO up to a total volume of 1 mL. The sample solution (600 μL) was moved to the sample tube, and the NMR spectra were recorded.
DFT Calculations
The initial configurations of sialic acid (SA), vinylphenylboronic acid (VPBA), and their complex were generated by using Winmostar software.37, 38 Each chemical structure was minimized by using B3LYP/6–31+G(d,p).39, 40 Achieved minima were confirmed by the execution of the frequency calculations for the optimized structures. We performed geometric optimizations from another initial condition and confirmed that a similar molecular conformation was yielded. The gauge‐independent atomic orbital (GIAO) method41, 42 was used to estimate the 11B and 13C isotropic nuclear shielding constants for each minimized structure. We tried some functional combinations in the GIAO calculations and chose those that were most comparable to the experimental NMR spectroscopy data. The NMR chemical shifts shown in this paper were obtained by use of PBEPBE/6–31+G(d,p).43 The11B NMR chemical shifts were calculated by taking the difference from optimized BF3 and compensating the difference between the BF3 and BF3 ⋅OEt2 isotropic shielding constants, which was 12.91 ppm in the experiments.44 The reference molecule of 13C NMR was optimized Si(CH3)4. The energy of each complex of SA and VPBA was calculated by using MP2/6–31+G(d,p).45 All calculations were performed by using Gaussian 09 software.46 This research was conducted by using the HITACHI SR16000 system (Yayoi) in the Information Technology Center, The University of Tokyo.
Conflict of interest
The authors declare no conflict of interest.
Supporting information
As a service to our authors and readers, this journal provides supporting information supplied by the authors. Such materials are peer reviewed and may be re‐organized for online delivery, but are not copy‐edited or typeset. Technical support issues arising from supporting information (other than missing files) should be addressed to the authors.
Supplementary
Acknowledgements
This work was partly supported by the CREST project, Japan Science and Technology Agency (JST).
S. Nishitani, Y. Maekawa, T. Sakata, ChemistryOpen 2018, 7, 513.
References
- 1. Nadano D., Iwasaki M., Endo S., Kitajima K., Inoue S., Inoue Y., J. Biol. Chem. 1986, 261, 11550–11557. [PubMed] [Google Scholar]
- 2. Mammen M., Choi S.-K., Whitesides G. M., Angew. Chem. Int. Ed. 1998, 37, 2754–2794; [DOI] [PubMed] [Google Scholar]; Angew. Chem. 1998, 110, 2908–2953. [Google Scholar]
- 3. Hood D. W., Makepeace K., Deadman M. E., Rest R. F., Thibault P., Martin A., Richards J. C., Moxon E. R., Mol. Microbiol. 1999, 33, 679–692. [DOI] [PubMed] [Google Scholar]
- 4. Schauer R., Glycoconjugate J. 2000, 17, 485–499. [DOI] [PMC free article] [PubMed] [Google Scholar]
- 5. Adamczyk B., Tharmalingam T., Rudd P. M., Biochim. Biophys. Acta Gen. Subj. 2012, 1820, 1347–1353. [DOI] [PubMed] [Google Scholar]
- 6. Fuster M. M., Esko J. D., Nat. Rev. Cancer 2005, 5, 526–542. [DOI] [PubMed] [Google Scholar]
- 7. Fujitani N., Furukawa J., Araki K., Fujioka T., Takegawa Y., Piao J., Nishioka T., Tamura T., Nikaido T., Ito M., Nakamura Y., Shinohara Y., Proc. Natl. Acad. Sci. USA 2013, 110, 2105–2110. [DOI] [PMC free article] [PubMed] [Google Scholar]
- 8. Cummings R. D., Etzler M. E. in Essentials of Glycobiology, 2nd ed., (Eds.: A. Varki, R. D. Cummings, J. D. Esko, H. H. Freeze, P. Stanely), CSH Press, New York, 2009, pp. 633–648. [PubMed] [Google Scholar]
- 9. Yang W., Gao X., Wang B., Med. Res. Rev. 2003, 23, 346–368. [DOI] [PubMed] [Google Scholar]
- 10. Ferrier R. J., Hannaford A. J., Overend W. G., Smith B. C., Carbohydr. Res. 1965, 1, 38–43. [Google Scholar]
- 11. Kugimiya A., Matsui J., Takeuchi T., Yano K., Muguruma H., Elgersma A. V., Karube I., Anal. Lett. 1995, 28, 2317–2323. [Google Scholar]
- 12. Matsumoto A., Sato N., Kataoka K., Miyahara Y., J. Am. Chem. Soc. 2009, 131, 12022–12023. [DOI] [PubMed] [Google Scholar]
- 13. Xu X.-D., Cheng H., Chen W.-H., Cheng S.-X., Zhuo R.-X., Zhang X.-Z., Sci. Rep. 2013, 3, 2679. [DOI] [PMC free article] [PubMed] [Google Scholar]
- 14. Shinde S., El-Schich Z., Malakpour A., Wan W., Dizeyi N., Mohammadi R., Rurack K., Gjörloff Wingren A., Sellergren B., J. Am. Chem. Soc. 2015, 137, 13908–13912. [DOI] [PubMed] [Google Scholar]
- 15. Matsumoto A., Cabral H., Sato N., Kataoka K., Miyahara Y., Angew. Chem. Int. Ed. 2010, 49, 5494–5497; [DOI] [PubMed] [Google Scholar]; Angew. Chem. 2010, 122, 5626–5629. [Google Scholar]
- 16. Liu H., Li Y., Sun K., Fan J., Zhang P., Meng J., Wang S., Jiang L., J. Am. Chem. Soc. 2013, 135, 7603–7609. [DOI] [PubMed] [Google Scholar]
- 17. Liu A., Peng S., Soo J. C., Kuang M., Chen P., Duan H., Anal. Chem. 2011, 83, 1124–1130. [DOI] [PubMed] [Google Scholar]
- 18. Huang L. L., Jin Y. J., Zhao D., Yu C., Hao J., Xie H. Y., Anal. Bioanal. Chem. 2014, 406, 2687–2693. [DOI] [PubMed] [Google Scholar]
- 19. Geninatti Crich S., Alberti D., Szabo I., Aime S., Djanashvili K., Angew. Chem. Int. Ed. 2013, 52, 1161–1164; [DOI] [PubMed] [Google Scholar]; Angew. Chem. 2013, 125, 1199–1202. [Google Scholar]
- 20. Deshayes S., Cabral H., Ishii T., Miura Y., Kobayashi S., Yamashita T., Matsumoto A., Miyahara Y., Nishiyama N., Kataoka K., J. Am. Chem. Soc. 2013, 135, 15501–15507. [DOI] [PubMed] [Google Scholar]
- 21. Wang S., Yin D., Wang W., Shen X., Zhu J.-J., Chen H.-Y., Liu Z., Sci. Rep. 2016, 6, 22757. [DOI] [PMC free article] [PubMed] [Google Scholar]
- 22. Klepach T., Carmichael I., Serianni A. S., J. Am. Chem. Soc. 2008, 130, 11892–11900. [DOI] [PubMed] [Google Scholar]
- 23. Otsuka H., Uchimura E., Koshino H., Okano T., Kataoka K., J. Am. Chem. Soc. 2003, 125, 3493–3502. [DOI] [PubMed] [Google Scholar]
- 24. Djanashvili K., Frullano L., Peters J. A., Chem. Eur. J. 2005, 11, 4010–4018. [DOI] [PubMed] [Google Scholar]
- 25. Schauer R., Trends Biochem. Sci. 1985, 10, 357–360. [Google Scholar]
- 26. Vlahov I. R., Vlahova P. I., Linhardt R. J., J. Am. Chem. Soc. 1997, 119, 1480–1481. [DOI] [PMC free article] [PubMed] [Google Scholar]
- 27. Matsumoto A., Sato N., Sakata T., Kataoka K., Miyahara Y., Adv. Mater. 2009, 21, 4372–4378. [DOI] [PubMed] [Google Scholar]
- 28. Oda H., Konno T., Ishihara K., Biomaterials 2015, 56, 86–91. [DOI] [PubMed] [Google Scholar]
- 29. Furikado Y., Nagahata T., Okamoto T., Sugaya T., Iwatsuki S., Inamo M., Takagi H. D., Odani A., Ishihara K., Chem. Eur. J. 2014, 20, 13194–13202. [DOI] [PubMed] [Google Scholar]
- 30. Springsteen G., Wang B., Tetrahedron 2002, 58, 5291–5300. [Google Scholar]
- 31. Mezei P. D., Csonka G. I., Kallay M., J. Chem. Theory Comput. 2017, 13, 4753–4764. [DOI] [PubMed] [Google Scholar]
- 32. Krolikowski F. J., Reuter K., Waalkes T. P., Sieber S. M., Adamson R. H., Pharmacology 1976, 14, 47–51. [DOI] [PubMed] [Google Scholar]
- 33. Wulff G., Pure Appl. Chem. 1982, 54, 2093–2102. [Google Scholar]
- 34. Burgemeister T., Grobe-Einsler R., Grotstollen R., Mannschreck A., Wulff G., Chem. Ber. 1981, 114, 3403–3411. [Google Scholar]
- 35. Frullano L., Rohovec J., Amie S., Maschmeyer T., Prata M. I., de Lima J. J. P., Geraldes C. F. G. C., Peters J. A., Chem. Eur. J. 2004, 10, 5205–5217. [DOI] [PubMed] [Google Scholar]
- 36. Neil E. R., Parker D., RSC Adv. 2017, 7, 4531–4540. [Google Scholar]
- 37.Winmostar JP home, https://winmostar.com/jp/.
- 38. Nagao T., Hakodate Kogyo Koto Senmon Gakko Kiyo 1993, 27, 111–120. [Google Scholar]
- 39. Becke A. D., J. Chem. Phys. 1993, 98, 5648–5652. [Google Scholar]
- 40. Lee C., Yang W., Parr R. G., Phys. Rev. B 1988, 37, 785–789. [DOI] [PubMed] [Google Scholar]
- 41. Kupka T., Ruscic B., Botto R. E., J. Phys. Chem. A 2002, 106, 10396–10407. [Google Scholar]
- 42. Kupka T., Stachów M., Nieradka M., Kaminsky J., Pluta T., J. Chem. Theory Comput. 2010, 6, 1580–1589. [DOI] [PubMed] [Google Scholar]
- 43. Perdew J., Burke K., Ernzerhof M., Phys. Rev. Lett. 1996, 77, 3865–3868. [DOI] [PubMed] [Google Scholar]
- 44. Jackowski K., Makulski W., Szyprowska A., Antušek A., Jaszuński M., Jusélius J., J. Chem. Phys. 2009, 130, 44309. [DOI] [PubMed] [Google Scholar]
- 45. Head-Gordon M., Pople J. A., Frisch M. J., Chem. Phys. Lett. 1988, 153, 503–506. [Google Scholar]
- 46.Gaussian 09, Revision A.02, M. J. Frisch, G. W. Trucks, H. B. Schlegel, G. E. Scuseria, M. A. Robb, J. R. Cheeseman, G. Scalmani, V. Barone, G. A. Petersson, H. Nakatsuji, X. Li, M. Caricato, A. Marenich, J. Bloino, B. G. Janesko, R. Gomperts, B. Mennucci, H. P. Hratchian, J. V. Ortiz, A. F. Izmaylov, J. L. Sonnenberg, D. Williams-Young, F. Ding, F. Lipparini, F. Egidi, J. Goings, B. Peng, A. Petrone, T. Henderson, D. Ranasinghe, V. G. Zakrzewski, J. Gao, N. Rega, G. Zheng, W. Liang, M. Hada, M. Ehara, K. Toyota, R. Fukuda, J. Hasegawa, M. Ishida, T. Nakajima, Y. Honda, O. Kitao, H. Nakai, T. Vreven, K. Throssell, J. A. Montgomery, Jr., J. E. Peralta, F. Ogliaro, M. Bearpark, J. J. Heyd, E. Brothers, K. N. Kudin, V. N. Staroverov, T. Keith, R. Kobayashi, J. Normand, K. Raghavachari, A. Rendell, J. C. Burant, S. S. Iyengar, J. Tomasi, M. Cossi, J. M. Millam, M. Klene, C. Adamo, R. Cammi, J. W. Ochterski, R. L. Martin, K. Morokuma, O. Farkas, J. B. Foresman, D. J. Fox, Gaussian, Inc., Wallingford, CT, 2016.
Associated Data
This section collects any data citations, data availability statements, or supplementary materials included in this article.
Supplementary Materials
As a service to our authors and readers, this journal provides supporting information supplied by the authors. Such materials are peer reviewed and may be re‐organized for online delivery, but are not copy‐edited or typeset. Technical support issues arising from supporting information (other than missing files) should be addressed to the authors.
Supplementary


