

Abstract
Chronic kidney disease (CKD) is a major health issue in the US. The typical five-sixths nephrectomy (typical 5/6 NX) is a widely used experimental CKD model. However, the typical 5/6 NX model is hypertensive in rats but strain dependent in mice. In particular, C57BL/6 mice with the typical 5/6 NX exhibits normal blood pressure and well-preserved renal function. The goal of the present study was to create a new hypertensive CKD model in C57BL/6 mice. We first characterized the vascular architecture originated from each renal artery branch by confocal laser-scanning microscopy with fluorescent lectin. Then, a novel 5/6 NX-BL model was generated by uninephrectomy combined with 2/3 renal infarction via a ligation of upper renal artery branch on the contralateral kidney. Compared with 5/6 NX-C, the 5/6 NX-BL model exhibited elevated mean arterial pressure (137.6 ± 13.9 vs. 104.7 ± 8.2 mmHg), decreased glomerular filtration rate (82.9 ± 19.2 vs. 125.0 ± 13.9 µl/min) with a reciprocal increase in plasma creatinine (0.31 ± 0.03 vs. 0.19 ± 0.04 mg/dl), and significant renal injury as assessed by proteinuria, histology with light, and transmission electron microscopy. In addition, inflammatory status, as indicated by the level of proinflammatory cytokine TNFα and the leukocyte counts, was significantly upregulated in 5/6 NX-BL compared with the 5/6 NX-C. In summary, we developed a new hypertensive CKD model in C57BL/6 mice with 5/6 renal mass reduction by uninephrectomy and upper renal artery branch ligation on the contralateral kidney. This 5/6 NX-BL model exhibits an infarction zone-dependent hypertension and progressive deterioration of the renal function accompanied by enhanced inflammatory response.
Keywords: chronic kidney disease
INTRODUCTION
Chronic kidney disease (CKD) is characterized by a progressive decline in kidney function that eventually may develop to end-stage renal disease (ESRD). CKD is a major health issue in the US, with increasing incidence and significant cost. Based on the National Kidney Foundation (NKF) and Kidney Disease Outcome Quality Initiative clinical practice guidelines for CKD, the prevalence of CKD in the US is approximately 13.1%, and the estimated population of ESRD reached more than 0.7 million by 2015 (10, 14). The risk factors for CKD are diverse, and the epidemiology is usually multiplicity. Currently, diabetes mellitus and hypertension have been recognized as the two primary causes of CKD (23, 32). Despite extensive investigation, the pathophysiological mechanisms of CKD have not been completely elucidated yet. A better understanding of the underlying mechanisms of CKD might provide new insights into the potential therapeutic targets for treatment in the clinical strategies.
Various experimental animal models have been developed to study CKD. The typical five-sixths nephrectomy model (5/6 NX) is the most widely used experimental model in rats, dogs, and rabbits to mimic the features of CKD, including the progressive decrease in glomerular filtration rate (GFR), elevation in blood pressure, and development of albuminuria and glomerulosclerosis (43, 52, 61). Whereas the mouse typical 5/6 NX model is highly strain dependent, C57BL/6 mouse, one of the most commonly used laboratory animals, is relatively resistant to hypertension and decline in renal function (30). Angiotensin II administration is the typical strategy to increase blood pressure and overcome the resistance to CKD in C57BL/6 mice (30).
In Sprague-Dawley rats, the model of 5/6 renal mass reduction, which was produced by uninephrectomy plus 2/3 renal infarction via ligation in two of three renal artery branches on the contralateral kidney, resulted in higher blood pressure and more severe renal injury compared with typical 5/6 nephrectomy exclusively via ablative surgery (15). However, the mouse model of 5/6 renal mass reduction induced by a combination of uninephrectomy and contralateral renal artery branch ligation has not been established, which may be due to the technical difficulty in isolation of renal artery branches (2, 23, 28). In addition, the anatomy and blood supply of the renal arterial branches have not been examined.
Thus, in the present study, we first characterized the vascular architecture originated from each branch of renal artery by confocal laser-scanning microscopy with fluorescent lectin. Then, we developed a 5/6 renal mass reduction combined with 2/3 renal infarction via a ligation of upper renal artery branch on the contralateral kidney with the infarction section left in place. Blood pressure, kidney function, renal injury, and inflammatory status were assessed.
METHODS
Animals.
The C57BL/6 mice (25–30 g) were purchased from The Jackson Laboratory (Bar Harbor, ME). The mice were provided free access to food and water in our animal facility. All procedures for this study were approved by the Institutional Animal Care and Use Committee of the University of South Florida.
Fluorescence imaging.
Dylight 488- and Dylight 594-labeled tomato lectin (DL-1174 and DL-1177; Vector Laboratories, Burlingame, CA) were used to mark vasculature. The mice were anesthetized with pentobarbital sodium (50 mg/ml ip). The left kidney, aorta, and inferior vena were exposed after an abdominal incision was made. Two branches of the left renal artery were carefully separated from the left renal vein. We marked kidney vasculature with the following steps: 1) the vena cava and the aorta below the left renal artery were clamped with one microvascular miniclip (FE690K; Aesculap, Center Valley, PA), and then the aorta above the left renal arteries was clamped with another clip; 2) an opening was cut on the left renal vein, and the blood was flushed out from the left kidney by injecting 1–1.5 ml of 0.9% saline through the aorta; 3) the upper branch of the renal artery was clamped, and 1 ml of Dylight 488-labeled tomato lectin solution was injected to the kidney through the aorta; 4) 1 ml of 0.9% saline was injected to the kidney again to flush out Dylight 488-labeled tomato lectin solution; 5) the lower branch of the renal artery was clamped after the clip on the upper branch was removed, and 1 ml of Dylight 594-labeled tomato lectin solution was then injected to the kidney through the aorta; and 6) the clip on the lower branch was removed, and 1–1.5 ml of 10% buffered formalin (Sigma-Aldrich, St. Louis, MO) was injected to the kidney through the aorta to fix the kidney. The left kidney was removed immediately and fixed in 10% buffered formalin. Kidney slices were then sectioned at 100 µm with vibratome (HM 650V; Thermo Fisher Scientific, Waltham, MA). Vibratome sections were placed in Mounting Medium with DAPI (Vector Laboratories) on glass slides with glass coverslips. The renal vasculature was examined using a Nikon Eclipse E600FN microscope under a ×4 working distance objective (Nikon, Tokyo, Japan) equipped with a Cascade 512F digital camera (Photometrics, Tucson, AZ). Data sets were collected as Z-series of 25 images with a spacing of 2 μm.
Measurement of mean arterial pressure.
Mean arterial pressure (MAP) was measured with a telemetry system in conscious mice, as described previously (54, 62). Mice were anesthetized with inhaled isoflurane. The left carotid artery was exposed by a small incision in the middle of the neck. The pressure catheter was implanted in the left carotid artery, and the telemetric device was placed subcutaneously in the right ventral flank of the mice. Seven days after the transmitter implantation, MAP were measured and recorded for 10 s every 2 min, starting from 1 to 4 PM as baseline.
Animal groups.
The mice transplanted with transmitters were anesthetized with pentobarbital sodium (50 mg/ml ip). A midline abdominal incision was performed to expose two kidneys, and the right kidney was removed. In 5/6 NX-BL group, the two branches of renal artery in the left kidney were carefully separated from the renal vein (Fig. 1A), and the upper branch of renal artery (Fig. 1, B and C) was ligated using a 7-0 braided silk suture (07C1500160; Teleflex Medical OEM, Gurnee, IL). The ischemic portion of the left kidney induced by upper branch ligation was left in place. The wound was sutured, and the mouse was kept in the recovery cage for 24 h. In the 5/6 NX-C group, the upper branch of renal artery was ligated as described above, but the ischemic portion was removed from the remnant kidney. The uninephrectomy (right kidney) mice without ligation or resection of the left kidney served as UX group. All animals were anesthetized again with inhaled isoflurane, and kidneys were harvested for measurements of inflammatory factors and histology at 12 wk after surgery.
Fig. 1.

Surgical images of legation of renal arterial branches. A: a representative image for upper (black arrow) and lower (white arrow) renal artery branches. B and C: ischemic part (dark red) in top portion of the kidney following upper branch ligation.
Measurements of glomerular filtration rate in conscious mice.
Glomerular filtration rate (GFR) was measured by the plasma FITC-sinistrin clearance with a single bolus injection in conscious mice every 2 wk after surgery, as we described previously, with modifications (50, 59). Briefly, mice were injected with FITC-sinistrin solution (5.6 mg/100 g body wt) through the retro-orbital venous sinus. Blood (<10 µl) was collected into heparinized capillary tubes through the tail vein at 3, 7, 10, 15, 35, 55, and 75 min after sinistrin injection. The blood samples were centrifuged at 8,000 rpm for 5 min at 4°C. Plasma (1 µl) was collected from each sample. FITC-sinistrin concentration of the plasma was measured using a plate reader (Cytation3; BioTek, Winooski, VT) with 485-nm excitation and 538-nm emission. GFR was calculated with a GraphPad Prism 6 (GraphPad Software, La Jolla, CA) by using a two-phase exponential decay model of plasma FITC-sinistrin concentration.
Measurement of plasma creatinine.
The mice were anesthetized with isoflurane every week after the right kidney was removed. The blood samples (40 µl) were collected through the retro-orbital venous sinus and centrifuged at 8,000 rpm for 5 min at 4°C. The plasma (25 µl/each) was obtained for creatinine measurement. Creatinine concentration was measured by HPLC at the O’Brien Center Core of the University of Alabama at Birmingham.
Measurement of urine albumin/creatinine ratio.
Mice were placed in metabolic cages for 24 h to collect urine every 4 wk after surgery. To calculate urine albumin/creatinine ratio (ACR), urine albumin concentration was measured by using a mouse albumin ELISA kit (ab108792; Abcam, Cambridge, MA), and urine creatinine concentration was measured by HPLC at the O’Brien Center Core of the University of Alabama at Birmingham.
Measurement of plasma renin concentration.
About 20 µl of blood from the tail vein was collected into a 50-µl heparinized microhematocrit capillary tube (22-362-566; Fisher) for 24 h and once/wk after renal infarction was induced. Plasma was collected by centrifugation (8,000 rpm, 4°C) for 5 min. All of plasma samples were stored at −80°C for renin measurement. Plasma renin concentration (PRC) was measured by using an angiotensin I (Ang I) enzyme immunoassay (EIA) kit (S-1188; Bachem, Bubendorf, Switzerland), as we reported previously (58). Briefly, 2 μl plasma was thawed at room temperature and added into 28 µl of EIA buffer to make a 15-fold dilution. The diluted plasma (10 µl) was incubated for 20 min with 0.4 μmol/l rat angiotensinogen, 50 mmol/l sodium acetate (pH 6.5), 2 mmol/l AEBSF (A8456; Sigma-Aldrich, St. Louis, MO), 5 mmol/l EDTA (pH 8), and 1 mmol/l 8-hydoxoyquinoline (252565; Sigma-Aldrich) in an Eppendorf tube. The total volume of this master mix was 50 µl. The amount of Ang I was measured using an EIA kit. PRC was expressed as the amount of Ang I generated per hour per microliter of plasma. To get angiotensinogen, plasma sample was collected at 72 h after two kidneys were removed in the rat.
Real-time PCR.
We measured the mRNA levels of inflammatory-related gene: tumor necrosis factor-α (TNFα), interferon-γ (IFNγ), interleukin-17 (IL-17) and interleukin-6 (IL-6), and intrarenal renin in the UX, 5/6 NX-BL, and 5/6 NX-C groups at 12 wk after surgery. Total RNAs were extracted from the left kidney and digested with RNase-free DNase (Promega, Fitchburg, WI). Reverse transcription was performed to synthesize cDNA templates as we described previously (35). Real-time PCR analysis was performed using iQ SYBR Green Supermix (Bio-Rad, Hercules, CA) and CFX96 Real-Time Detection System (Bio-Rad, Hercules, CA) according to the manufacturer’s protocol. The reaction conditions were 95°C for 1 min, followed by 40 cycles of 95°C for 15 s and 60°C for 30 s. The comparative CT method () was used to analyze data and calculate the relative mRNA expression levels. The primer sequences and accession numbers are listed in Table 1.
Table 1.
Primer sequences and accession numbers
| Sequences | Accession No. | |
|---|---|---|
| β-Actin | ||
| Forward | 5′-GTCCCTCACCCTCCCAAAAG-3 | NM_007393 |
| Reverse | 5′-GCTGCCTCAACACCTCAACCC-3′ | |
| TNFα | ||
| Forward | 5′-ATGAGAAGTTCCCAAATGGC-3′ | NM_013693 |
| Reverse | 5′-CTCCACTTGGTGGTTTGCTA-3′ | |
| IFNγ | ||
| Forward | 5′-CGCTACACACTGCATCTTGG-3′ | NM_008337 |
| Reverse | 5′-GGCTGGATTCCGGCAACA-3′ | |
| IL-17 | ||
| Forward | 5′-ATCAGGACGCGCAAACATG-3′ | NM_010552 |
| Reverse | 5′-TGATCGCTGCTGCCTTCAC-3′ | |
| IL-6 | ||
| Forward | 5′-CTCTGGGAAATCGTGGAAAT-3′ | NM_031168 |
| Reverse | 5′-CCAGTTTGGTAGCATCCATC-3′ | |
| Renin | ||
| Forward | 5′-TCTGGGCACTCTTGTTGCTC-3′ | NM_031192 |
| Reverse | 5′-GGGGGAGGTAAGATTGGTCAA-3′ |
Western blot.
Renal protein extracts (50 μg/lane) were separated on a 7.5% SDS-PAGE gel (35). After blocking for 1 h at room temperature with 5% skim milk, the membranes were incubated overnight at 4°C with a COOH-terminal NOS1 antibody (mouse polyclonal IgG, 1:3,000; BD Biosciences, San Jose, CA). After incubation of the membranes with horseradish peroxidase-conjugated secondary antibody (goat anti-mouse, IgG; 1:300,000; Bio-Rad), the immunoreactive bands were revealed by enhanced chemiluminescence detection on Hyperfilm (Amersham Pharmacia Biotech, Piscataway, NJ).
Enzyme-linked immunosorbent assay.
The plasma levels of TNFα were measured with an ELISA kit (Abcam, Cambridge, MA), following the manufacturer’s instructions.
Light microscopy.
The kidneys were harvested and fixed in 4% paraformaldehyde solution. Fixed kidney tissues were embedded in paraffin, and 2-µm kidney tissue slices were cut and stained with periodic acid Schiff (PAS) and Masson’s trichrome staining. Ten randomly chosen fields were captured under ×1,000 magnification, and the fibrotic area (%) was calculated as the ratio of the total fibrosis area to the whole kidney sectional area in trichrome-stained slices (60). In PAS-stained slices, the level of tissue inflammation was evaluated by counting kidney inflammatory cells in high-power fields from each selected field (37), and the degree of glomerular injury was quantified from the percentage of mesangial expansion (<25, 25–50, 50–80, and >80%) (55). All morphometric analyses after PAS and Masson’s trichrome staining were performed in blinded manner.
Transmission electron microscopy.
The kidneys were harvested to evaluate kidney injury under transmission electron microscope at 12 wk after surgery. Briefly, with an incision to the right atrium of the heart, 1 M phosphate-buffered saline (PBS) solution with 0.8 U/ml heparin was perfused via the left ventricle to flush the blood. Small tissue pieces (∼1 mm3) of renal cortex were cut and fixed in 2% glutaraldehyde in 0.1 M sodium cacodylate buffer (pH 7.4) overnight at room temperature. The tissue pieces were rinsed with 0.1 M sodium cacodylate buffer (pH 7.4) and treated with 1% osmium tetroxide for 2 h. Then, the tissue pieces were dehydrated with a series of graded ethanol, sequentially infiltrated with 2:1, 1:1, and 1:2 mixtures of acetone and resin, and embedded in 100% resin. Thin sections (∼90–100 nm) were cut and examined with transmission electron microscope (JEM-1400 Plus) at USF Health Lisa Muma Weitz Laboratory. The thickness of glomerular basement membrane (GBM) was defined by the shortest distance between the endothelial plasma membrane and the plasma membrane of the podocyte foot processes. The mean GBM thickness of each glomerulus was calculated as described (17, 44). The podocyte foot process was detected and the average width of foot process in each glomerulus determined as described (13, 56). The kidney injuries under transmission electron microscopy (TEM) were scored in a blinded manner.
Statistical analysis.
Data were presented as means ± SE (62). Changes were considered to be significant if P < 0.05. Statistical differences were determined using ANOVA for repeated measures and a Student’s paired t-test. The difference was considered to be significant for a P value of <0.05.
RESULTS
Vascular architecture of renal artery branches.
To characterize the vascular architecture originated from renal artery branches, tomato lectin with different conjugated fluorophores was perfused via each branch, respectively. The fluorescence images of the whole kidney slices showed a clear border between green and red fluorescence signals. The approximate two-thirds of the upper portion of the kidney slices only displayed the green fluorescence, whereas the red fluorescence signal existed exclusively in approximately one-third of the lower part (Fig. 2A). The diameters of the upper and lower branches and the percentage of the area supplied by each branch are summarized in Table 2. The high magnification of the fluorescence images showed the detailed vascular architecture in the border zone. Some peritubular capillaries exhibited both green and red fluorescence; however, no glomeruli exhibited either green or red fluorescence (Fig. 2B).
Fig. 2.

Vascular architecture of the kidney. A: fluorescence images of the whole kidney slice show a clear border between green (Dylight 488-labeled tomato lectin) and red (Dylight 594-labeled tomato lectin) signals (image a). DAPI is in blue. The approximately two-thirds upper portion of the kidney slice displays only the green florescence (image b), whereas red fluorescence signal exists exclusively in the lower part (image c). B: some peritubular capillaries exhibited both green and red color in the border zone (image a). DAPI is in blue (image b). Either green (image d) or red (image c) fluorescence signal is displayed only on individual glomerulus.
Table 2.
Morphometric data of renal arterial branches
| Diameter, mm | %Supplied Area | |
|---|---|---|
| Renal artery | 0.38 ± 0.11 | 100 |
| Upper branch | 0.27 ± 0.09 | 62 ± 10.3 |
| Lower branch | 0.18 ± 0.07 | 38 ± 6.1 |
Values are means ± SE; n = 18.
Mean arterial pressure.
MAP was measured with a telemetry system in the UX, 5/6 NX-BL, and 5/6 NX-C groups after surgery. Baseline MAP was similar in all groups of animals. MAP increased by 40.6 ± 6.2% from 97.8 ± 5.3 to 139.1 ± 8.9 mmHg in the 5/6 NX-BL group at 12 wk after surgery (P < 0.01 vs baseline) but had no increase in the 5/6 NX-C or UX groups (Fig. 3).
Fig. 3.
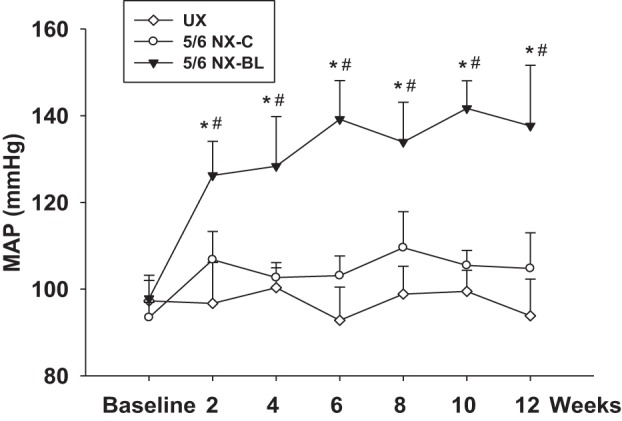
Mean arteriole pressure (MAP) after surgery. MAP was measured with the telemetry system in all of groups after surgery. At 12 wk after surgery, MAP increased by 40.6 ± 6.9%, from 97.8 ± 5.3 to 137.64 ± 13.97 mmHg in the 5/6 NX-BL group but had no increase in UX and 5/6 NX-C groups. (n = 8). *P < 0.05 vs. UX; #P < 0.05 vs. 5/6 NX-C.
Kidney function.
Kidney function of these mice was evaluated by measuring GFR and plasma creatinine concentration after surgery. Baseline GFR was similar in all groups of mice. GFR in the UX group was decreased by ∼30% due to uninephrectomy. GFR decreased by 50.3 ± 2.2% from 249.5 ± 12.7 to 118.4 ± 11.9 µl/min in the 5/6 NX-BL group (P < 0.01 vs. baseline) and 41.5 ± 4.4% from 221.5 ± 9.1 to 129.5 ± 15.6 µl/min in 5/6 NX-C group (P < 0.01 vs. baseline) 2 wk after surgery. Twelve weeks after surgery, the GFR further decreased to 82.9 ± 19.2 µl/min in the 5/6 NX-BL group (P < 0.01 vs. baseline), but stabilized in the 5/6 NX-C group (Fig. 4).
Fig. 4.
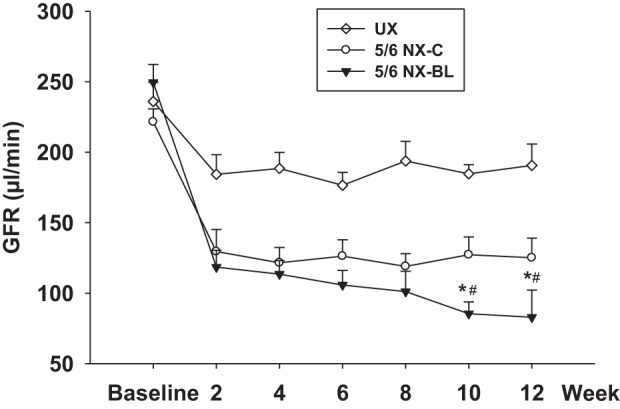
Glomerular filtration rate (GFR) after surgery. GFR was measured in all of the groups every 2 wk after surgery. In the 5/6 NX-BL group, GFR decreased by 66.7 ± 6.3%, from 249.5 ± 12.7 to 82.9 ± 19.2 µl/min at 12 wk after surgery. GFR decreased by 41.5 ± 4.6% in 5/6 NX-C group at 2 wk after surgery and then stabilized. (n = 7). *P < 0.01 vs. UX; #P < 0.05 vs. 5/6 NX-C.
The plasma creatinine increased from 0.11 ± 0.02 to 0.31 ± 0.03 mg/dl in the 5/6 NX-BL group at 12 wk after surgery (P < 0.01 vs. baseline) but had no significant change in the UX and 5/6 NX-C groups (Fig. 5).
Fig. 5.
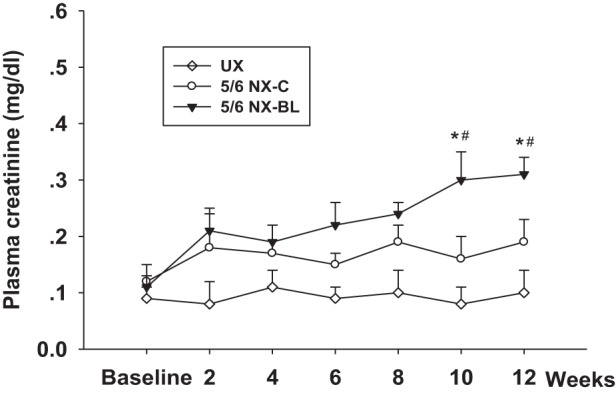
Plasma creatinine. Plasma creatinine was measured in all of the groups every 2 wk after surgery. The plasma creatinine increased from 0.11 ± 0.02 to 0.31 ± 0.03 mg/dl in the 5/6 NX-BL group at 12 wk after surgery but had no significant change in the UX and 5/6 NX-C groups (n = 7). *P < 0.01 vs. UX; #P < 0.05 vs. 5/6 NX-C.
Urine ACR.
Urine ACR were measured in the UX, 5/6 NX-BL, and 5/6 NX-C groups after surgery. Urine ACR increased from 21 ± 11 to 2841 ± 375 μg/g in 5/6 NX-BL group after surgery (P < 0.01 vs. baseline). In contrast, the ACR had no significant increase in UX and 5/6 NX-C groups (Fig. 6).
Fig. 6.
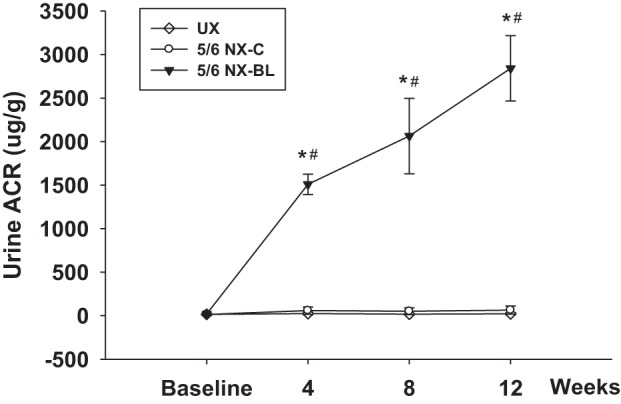
Urine albumin/creatinine ratio (ACR). Urine ACR was measured in all of the groups after surgery. Urine ACR increased from 21 ± 11 to 2,841 ± 375 μg/g in the 5/6 NX-BL group at 12 wk after surgery but had no change in the UX or 5/6 NX-C group (n = 5). *P < 0.01 vs. UX; #P < 0.01 vs. 5/6 NX-C.
PRC and intrarenal renin.
PRCs were measured before surgery at baseline and every 4 wk after surgery. Baseline PRC was similar in all three groups. PRC was similar at baseline and had no significant change during 12 wk after surgery in any of the groups (Fig. 7A). The mRNA level of intrarenal renin was measured at 12 wk after surgery. There was no significant difference among UX, 5/6 NX-BL, and 5/6 NX-C groups (Fig. 7B).
Fig. 7.
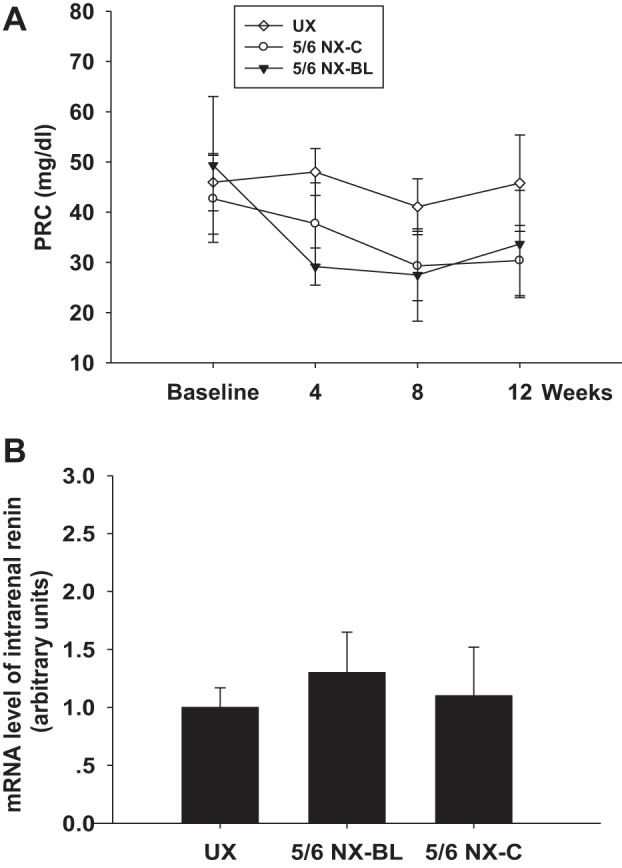
Plasma renin concentration (PRC) and intrarenal renin mRNA level. A: PRC was similar at baseline and had no significant change during 12 wk after surgery in any of the groups. B: mRNA level of intrarenal renin had no significant difference at 12 wk after surgery in any of the groups.
Inflammatory response.
The mice in the 5/6 NX-BL group exhibited significant elevations in the mRNA levels of TNFα, IFNγ, IL-17, and IL-6 compared with the UX group (P < 0.01 vs. UX, Fig. 8, A–D). In the 5/6 NX-C group, TNFα, IFNγ, IL-17, and IL-6 mRNA levels had no significant increase compared with the UX group.
Fig. 8.

mRNA levels of inflammatory factors. The mRNA levels of inflammatory factors were measured and compared among the UX, 5/6 NX-BL, and 5/6 NX-C groups at 12 wk after surgery. A: TNFα mRNA level increased 3.8 ± 0.24-fold in the 5/6 NX-BL group but had no significant increase in the 5/6 NX-C group compared with the UX group. B: IFNγ mRNA level increased 5.2 ± 0.84-fold in the 5/6 NX-BL group but had no significant increase in the 5/6 NX-C group compared with the UX group. C: IL-17 mRNA level increased 2.6 ± 0.53-fold in the 5/6 NX-BL group but had no significant increase in 5/6 NX-C group compared with the UX group. D: IL-6 mRNA level increased 4.1 ± 0.57-fold in 5/6 NX-BL group but had no significant increase in the 5/6 NX-C group compared with the UX group (n = 5). *P < 0.01 vs. UX; #P < 0.01 vs. 5/6 NX-C.
The protein level of TNFα was significantly higher in 5/6 NX-BL group compared with the UX group (P < 0.01 vs. UX; Fig. 9, A and B) but had no significant change in 5/6 NX-C group.
Fig. 9.
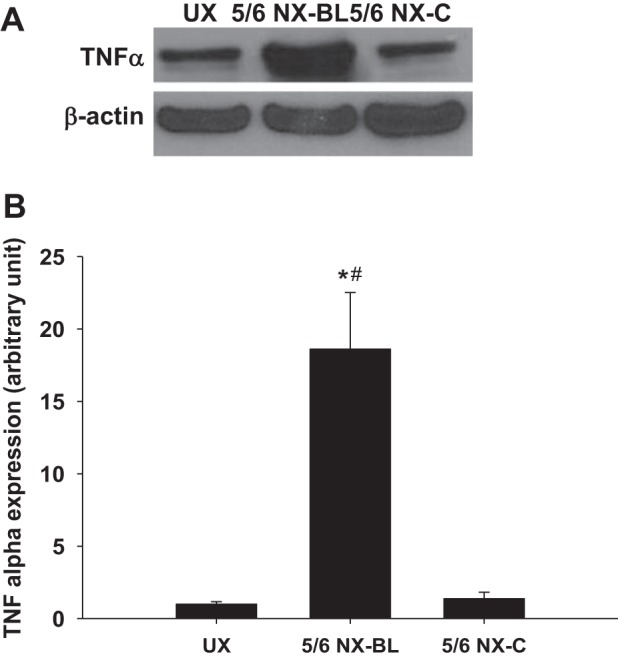
Protein level of inflammatory factor. The protein level of TNFα in kidney homogeneous was measured and compared among the UX, 5/6 NX-BL, and 5/6 NX-C groups at 12 wk after surgery. TNFα mRNA level increased ∼18-fold in the 5/6 NX-BL group but had no significant increase in the 5/6 NX-C group compared with the UX group. (n = 5). *P < 0.01 vs. UX; #P < 0.01 vs. 5/6 NX-C.
Plasma TNFα level was measured after surgery. Baseline plasma TNFα was similar in all groups. In the 5/6 NX-BL group, plasma TNFα gradually increased approximately fivefold from 13.5 ± 6.62 to 82.3 ± 13.6 pg/ml (P < 0.01 vs. baseline). However, the plasma TNFα level had no significant increase in the UX or 5/6 NX-C group (Fig. 10).
Fig. 10.
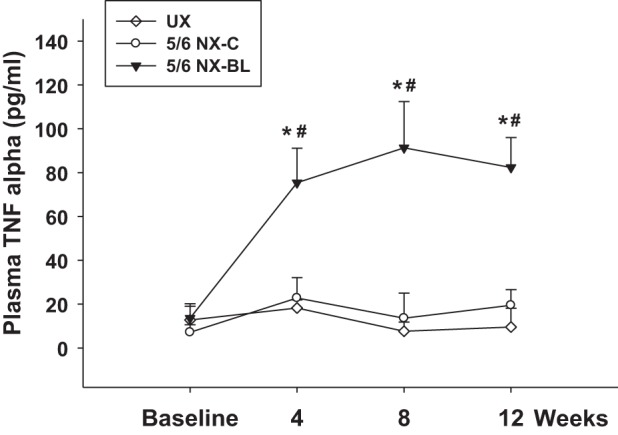
Plasma inflammatory factor. Plasma TNFα level was measured in all of the groups after surgery. Plasma TNFα increased ∼5-fold from 13.5 ± 6.62 to 82.3 ± 13.6 pg/ml in the 5/6 NX-BL group but had no increase in the UX and 5/6 NX-C groups (n = 7). *P < 0.01 vs. UX; #P < 0.01 vs. 5/6 NX-C.
Light microscopy and TEM.
The kidney fibrosis was evaluated using Masson’s trichrome staining at 12 wk after surgery (Fig. 11A). The fibrotic area ratio was significantly increased in the 5/6 NX-BL group (22.9 ± 5.3%) compared with the UX group (0%, P < 0.01 vs. UX). The fibrosis area was markedly decreased in the 5/6 NX-C group compared with the 5/6 NX-BL group (P < 0.01 vs. 5/6 NX-BL; Fig. 11B).
Fig. 11.

Light microscopy and transmission electron microscopy (TEM). A: fibrosis was evaluated in Masson’s trichrome-stained kidney slices at 12 wk after surgery. Representative Mason’s trichrome staining images showed whole kidney and fibrotic region, which displayed renal collagen deposition (yellow arrowhead), from left kidney in all groups. The lipid vacuole (green arrowhead) was observed in the fibrotic region. B: the left kidney fibrosis area ratio was significantly increased in the 5/6 NX-BL group compared with the UX and 5/6 NX-C groups. C: inflammatory response was evaluated by inflammatory cell infiltration in periodic acid Schiff (PAS)-stained kidney slices at 12 wk after surgery. Representative PAS staining images showed whole kidney, infarction zone and inflammatory cells (yellow arrowhead) from left kidney in all groups. D: left kidney in the 5/6 NX-BL group showed significant infiltration of inflammatory cells compared with the UX and 5/6 NX-C groups. E–H: kidney injury in the noninfarction zone was evaluated by PAS staining and TEM. Representative PAS staining and TEM images showed noninfarction zone, glomerulus, and glomerular filtration barrier from left kidney in all groups. The left kidney in the 5/6 NX-BL group had severe mesangial expansion (yellow arrowhead) compared with the UX and 5/6 NX-BL groups. Foot process width (red arrowhead) and glomerular basement membrane (GBM) thickness (green arrowhead) were increased in the 5/6 NX-BL groups compared with the UX and 5/6 NX-C groups (n = 5). *P < 0.01 vs. UX; #P < 0.01 vs. 5/6 NX-C.
Fig. 11.

Contiuned.
The kidney inflammation, evaluated by PAS staining, was significantly enhanced with an increased inflammatory cell infiltration in the 5/6 NX-BL group (409 ± 73 inflammatory cells/HPF) compared with the UX group (16 ± 8 inflammatory cells/HPF, P < 0.01 vs. UX). The inflammatory cell infiltration was decreased in the 5/6 NX-C group compared with the 5/6 NX-BL group (P < 0.01 vs. 5/6 NX-BL) (Fig. 11, C and D).
The kidney injury was also evaluated by PAS staining and TEM (Fig. 11E). The percentage of glomeruli with mild (25–50%), moderate (50–80%), and severe mesangial expansion (> 80%) was significantly higher in 5/6 NX-BL group compared with the UX group (P < 0.01 vs. UX). However, glomeruli in 5/6 NX-C group increased mild mesangial expansion (25–50%) and had no moderate or severe mesangial expansion (Fig. 11, E and F).
Widened foot process width and GBM thickness were observed in the 5/6 NX-BL group (Fig. 11E). Foot process width was increased by ∼1.8-folds in the 5/6 NX-BL group (395 ± 98 nm, P < 0.05 vs. UX) compared with UX group (136 ± 42 nm) (Fig. 11G). GBM thickness was also increased onefold in the 5/6 NX-BL group (319 ± 49 nm, P < 0.01 vs. UX) compared with UX group (156 ± 32 nm) (Fig. 11H). However, there was no significant increase in foot process width or GBM thickness in the 5/6 NX-C group.
DISCUSSION
In the present study, we characterized the intrarenal vasculature originated from each renal arterial branch in C57BL/6 mice. A novel 5/6 NX-BL mouse model was generated by uninephrectomy combined with 2/3 renal infarction via a ligation of the upper renal artery branch on the contralateral kidney. We found that, unlike the 5/6 NX-C exclusively via surgical excision, the 5/6 NX-BL model exhibited elevated MAP and progressive deterioration of renal function accompanied with renal injury and enhanced inflammatory response.
The typical 5/6 NX model, produced by uninephrectomy and surgical removal of 2/3 of contralateral kidney without any ligation, is a well-established and widely used CKD model in several laboratory animals, including dogs (7, 9, 48), rabbits (11, 27), and rats (15, 29, 52) with progressive decline in kidney clearance function, gradual development of renal injury, and elevated blood pressure. However, the typical 5/6 NX model is strain or genetic background dependent in mice. The typical 5/6 NX induced hypertension in CD-1 and 129S3 mice (32). However, the typical 5/6 NX in C57BL/6 mice exhibited normal blood pressure and well-preserved renal function (30). C57BL/6 is the first mouse strain with the genome completely sequenced and the most utilized strain in the generation of genetically modified strain. Thus, development of a CKD model in C57BL/6 mouse is of greater significance.
Besides ablative surgery, other approaches, such as ligation of kidney pole (40) or blockade in the subset of renal arterial branches (15, 61), have also been utilized to achieve subtotal renal mass reduction in rats. Moreover, in Sprague-Dawley rats, compared with 5/6 nephrectomy via surgical excision, 5/6 renal mass reduction, produced by uninephrectomy and 2/3 renal parenchyma infarction via ligation in two of the three renal artery branches on contralateral kidney, resulted in higher blood pressure and more severe renal injury (15). However, to our knowledge, the 5/6 renal mass reduction by a combination of uninephrectomy and ligation in a subset of renal artery branches on contralateral kidney has not been reported, which may be due to technical difficulty in the mouse (2, 12, 28). In addition, the anatomy and blood supply of the renal arterial branches have not been examined.
Based on our observation, the C57BL/6 mouse has its renal artery bifurcated ahead of renal hilum with a diameter of the upper branch larger than the lower one. Blockade of the blood flow via upper branch resulted in ischemia of approximately two-thirds of renal parenchyma in the upper portion of kidney; shutting off the blood flow via the lower branch led to ischemia of approximately one-third of kidney in the lower portion. To further determine the intrarenal blood supply from each branch of renal artery, tomato lectin with different conjugated fluorophores, which is able to attach to the glycocalyx of vascular endothelium, was perfused through either the upper or lower branch. The confocal microscopy images of the whole kidney slice showed green fluorescent signal in approximately two-thirds of the kidney slice in the upper portion and red fluorescent signal in approximately one-third of the kidney slice in the lower portion with a distinguished border, which indicates that the blood supply to either the upper or the lower portion of renal parenchyma is originated exclusively from its corresponding branch of renal artery. Moreover, although some peritubular capillaries in the border zone exhibited both fluorescent signals for each specific glomerulus, either red or green fluorescent signal was solely displayed, suggesting that there is no overlap in blood supplies from two branches for a single glomerulus. Thus, in the present study, a novel 5/6 NX-BL model in the C57BL/6 mouse was generated by uninephrectomy combined with two-thirds renal infarction via a ligation of upper renal artery branch on the contralateral kidney; as the control group, the 5/6 NX-C model was produced by uninephrectomy, and surgical removal of the ischemic 2/3 renal parenchyma was induced by upper renal artery branch ligation on the contralateral kidney. The difference between these two groups is whether the ischemic portion of renal parenchyma induced by upper branch ligation is left in place or surgically resected.
To determine the outcomes of the 5/6 NX-BL model in C57BL/6 mice, blood pressure, kidney clearance function, and renal injury were compared in 5/6 NX-BL, 5/6 NX-C, and UX mice. We found that the MAP of the 5/6 NX-BL mice was significantly increased, whereas it was not significantly changed in 5/6 NX-C and UX mice. The GFR of the 5/6 NX-BL mice progressively declined, accompanied with a reciprocal elevations in plasma creatinine level, whereas the GFR and plasma creatinine level remained stable in 5/6 NX-C and UX mice. The urine ACR of the 5/6 NX-BL mice progressively increased, whereas it was not significantly altered in 5/6 NX-C or UX mice. Additionally, the degree of glomerular mesangial expansion, width of podocyte foot processes, and thickness of glomerular basement membrane were significantly larger in 5/6 NX-BL mice than in 5/6 NX-C mice. Taken together with all of the above results, our findings demonstrated that the 5/6 NX-BL model induced hypertension with progressive decline in renal function and progress in kidney injury in C57BL/6 mice.
Renin angiotensin aldosterone system (RAAS) has been considered an important factor in the regulation of blood pressure and progression in kidney injury in experimental animal models and patients with CKD (15, 30). To determine the role of RAAS in the 5/6 NX-BL model, we measured the level of plasma renin concentration in 5/6 NX-BL, 5/6 NX-C, and UX mice. Unexpectedly, there was no significant difference in plasma renin or intrarenal renin expression among these three groups, which suggests that the development of hypertension and progressive CKD in 5/6 NX-BL mice might be independent with RAAS. This finding is consistent with the results of previous studies in rats that the 5/6 renal mass reduction model by uninephrectomy combined with ligation in two out of three renal artery branches on the contralateral kidney exhibited comparable or even lower plasma renin concentration than the uninephrectomy group in Sprague-Dawley rats (42) and Munich-Wistar rats (3). In addition, the intrarenal renin expression in the remnant kidney parenchyma, including the infarcted tissue, was significantly decreased compared with that in uninephrectomized rats (42). Renin is generated and released from granular cells in juxtaglomerular apparatus (JGA), and its secretion is controlled by the blood flow in JGA. The fluorescent images of renal vascular architecture showed that for each specific glomerulus, either the red or green fluorescent signal was solely displayed, which indicates that the blood supply for each specific glomerulus was originated from only one of the two renal artery branches without any overlap. Thus, ligation of the upper branch of renal artery would not induce ischemia in a JGA that stimulates renin release. Therefore, these results suggested RAAS activity is unlikely to be involved in the development of hypertension in the 5/6 NX-BL model.
The inflammatory response has been recognized to play an essential role in the development of hypertension, including in renal infarction (15, 20, 39). In clinical studies, the elevated C-reactive protein (CRP) level (6, 16, 38) and the increase in white blood cell count (4, 6, 31) in blood tests indicated an upregulated inflammatory status in patients with renal infarction. Moreover, surgical removal of the infarcted tissue rapidly ameliorated the elevated blood pressure along with a normalization in CRP level (38). It has also been known that inflammation stimulates oxidative stress (8, 47, 51), vasoconstriction (33, 46, 57), leukocyte adhesion (5, 21, 24), mesangial cell proliferation (34, 36, 49), and tubulointerstitial fibrosis (22, 26), which promotes the progression of CKD. Prospective cohort studies of CKD patients showed that the plasma levels of proinflammatory biomarkers, including IL-6 and TNFα, were strongly inversely correlated with kidney function, as assessed by estimated GFR and serum cystatin C, and positively associated with glomerular injury, as evaluated with albuminuria (53) or urine albumin to creatinine ratio (18). Additionally, anti-inflammatory treatment attenuated the decline in renal function and the deterioration in kidney injury in patients with CKD (1, 41). To determine the role of inflammation in the development of hypertension and CKD in the 5/6 NX-BL model, we compared plasma levels of proinflammatory cytokines and TNFα in 5/6 NX-BL, 5/6 NX-C, and UX mice. We found that these inflammatory biomarkers were significantly increased the in 5/6 NX-BL mice, whereas it was not significantly altered in 5/6 NX-C and UX mice. In addition, the levels of intrarenal proinflammatory cytokines, including TNFα, IFNγ, IL-17, and IL-6, were significant higher in 5/6 NX-BL mice compared with the 5/6 NX-C and UX mice. These results indicated that the 5/6 NX-BL model upregulates both renal and systemic inflammatory response.
Hypertension per se has been identified as one of the leading causes of CKD (19, 25, 45). In the present study, the progression of CKD in 5/6 NX-BL model is more severe compared with 5/6 NX-C and NX mice, in which hypertension may be one important factor. Our results indicated that the 5/6 NX-BL model upregulates renal and systemic inflammatory response, which likely promotes the development of hypertension. Therefore, further examination for the significance of the inflammation or individual inflammatory markers identified in the present study in the development of hypertension is essential in future studies.
In summary, in the present study, for the first time, we characterized the vasculature originated from each renal arterial branch by confocal laser-scanning microscopy with fluorescent lectin. Then, a novel 5/6 NX-BL model was generated by uninephrectomy combined with 2/3 renal infarction via upper renal artery branch ligation on the contralateral kidney. This new model exhibited elevated blood pressure, progressive deterioration of kidney function and development of renal injury, and enhanced inflammatory response, which were dependent on the infarcted zone in the remnant kidney.
GRANTS
This work was supported by AHA-15PRE2571306 (to J. Zhang) and National Institute of Diabetes and Digestive and Kidney Diseases Grants DK-099276 and DK-098582 (to R. Liu).
DISCLOSURES
No conflicts of interest, financial or otherwise, are declared by the authors.
AUTHOR CONTRIBUTIONS
J.W. and R.L. conceived and designed research; J.W., J.Z., B.C., and S.J. performed experiments; J.W. analyzed data; J.W. interpreted results of experiments; J.W. and J.Z. prepared figures; J.W., J.Z., and L.W. drafted manuscript; J.W., L.W., B.C., S.J., and R.L. edited and revised manuscript; J.W., J.Z., L.W., B.C., S.J., and R.L. approved final version of manuscript.
REFERENCES
- 1.Akchurin OM, Kaskel F. Update on inflammation in chronic kidney disease. Blood Purif 39: 84–92, 2015. doi: 10.1159/000368940. [DOI] [PubMed] [Google Scholar]
- 2.Al Banchaabouchi M, Marescau B, D’Hooge R, Van Marck E, Van Daele A, Levillain O, De Deyn PP. Biochemical and histopathological changes in nephrectomized mice. Metabolism 47: 355–361, 1998. doi: 10.1016/S0026-0495(98)90271-2. [DOI] [PubMed] [Google Scholar]
- 3.Anderson S, Rennke HG, Brenner BM. Therapeutic advantage of converting enzyme inhibitors in arresting progressive renal disease associated with systemic hypertension in the rat. J Clin Invest 77: 1993–2000, 1986. doi: 10.1172/JCI112528. [DOI] [PMC free article] [PubMed] [Google Scholar]
- 4.Antopolsky M, Simanovsky N, Stalnikowicz R, Salameh S, Hiller N. Renal infarction in the ED: 10-year experience and review of the literature. Am J Emerg Med 30: 1055–1060, 2012. doi: 10.1016/j.ajem.2011.06.041. [DOI] [PubMed] [Google Scholar]
- 5.Betjes MG. Immune cell dysfunction and inflammation in end-stage renal disease. Nat Rev Nephrol 9: 255–265, 2013. doi: 10.1038/nrneph.2013.44. [DOI] [PubMed] [Google Scholar]
- 6.Bourgault M, Grimbert P, Verret C, Pourrat J, Herody M, Halimi JM, Karras A, Amoura Z, Jourde-Chiche N, Izzedine H, François H, Boffa JJ, Hummel A, Bernadet-Monrozies P, Fouque D, Canouï-Poitrine F, Lang P, Daugas E, Audard V. Acute renal infarction: a case series. Clin J Am Soc Nephrol 8: 392–398, 2013. doi: 10.2215/CJN.05570612. [DOI] [PMC free article] [PubMed] [Google Scholar]
- 7.Bourgoignie JJ, Gavellas G, Martinez E, Pardo V. Glomerular function and morphology after renal mass reduction in dogs. J Lab Clin Med 109: 380–388, 1987. [PubMed] [Google Scholar]
- 8.Cachofeiro V, Goicochea M, de Vinuesa SG, Oubiña P, Lahera V, Luño J. Oxidative stress and inflammation, a link between chronic kidney disease and cardiovascular disease. Kidney Int Suppl 74, Suppl: S4–S9, 2008. doi: 10.1038/ki.2008.516. [DOI] [PubMed] [Google Scholar]
- 9.Coburn JW, Gonick HC, Rubini ME, Kleeman CR. Studies of experimental renal failure in dogs. I. Effect OF 5–6 nephrectomy on concentrating and diluting capacity of residual nephrons. J Clin Invest 44: 603–614, 1965. doi: 10.1172/JCI105173. [DOI] [PMC free article] [PubMed] [Google Scholar]
- 10.Coresh J, Selvin E, Stevens LA, Manzi J, Kusek JW, Eggers P, Van Lente F, Levey AS. Prevalence of chronic kidney disease in the United States. JAMA 298: 2038–2047, 2007. doi: 10.1001/jama.298.17.2038. [DOI] [PubMed] [Google Scholar]
- 11.Eddy AA, Falk RJ, Sibley RK, Hostetter TH. Subtotal nephrectomy in the rabbit: a model of chronic hypercalcemia, nephrolithiasis, and obstructive nephropathy. J Lab Clin Med 107: 508–516, 1986. [PubMed] [Google Scholar]
- 12.Fogo AB. Animal models of FSGS: lessons for pathogenesis and treatment. Semin Nephrol 23: 161–171, 2003. doi: 10.1053/snep.2003.50015. [DOI] [PubMed] [Google Scholar]
- 13.Gao Q, Shen W, Qin W, Zheng C, Zhang M, Zeng C, Wang S, Wang J, Zhu X, Liu Z. Treatment of db/db diabetic mice with triptolide: a novel therapy for diabetic nephropathy. Nephrol Dial Transplant 25: 3539–3547, 2010. doi: 10.1093/ndt/gfq245. [DOI] [PubMed] [Google Scholar]
- 14.Gilbertson DT, Liu J, Xue JL, Louis TA, Solid CA, Ebben JP, Collins AJ. Projecting the number of patients with end-stage renal disease in the United States to the year 2015. J Am Soc Nephrol 16: 3736–3741, 2005. doi: 10.1681/ASN.2005010112. [DOI] [PubMed] [Google Scholar]
- 15.Griffin KA, Picken M, Bidani AK. Method of renal mass reduction is a critical modulator of subsequent hypertension and glomerular injury. J Am Soc Nephrol 4: 2023–2031, 1994. [DOI] [PubMed] [Google Scholar]
- 16.Guasti L, Dentali F, Castiglioni L, Maroni L, Marino F, Squizzato A, Ageno W, Gianni M, Gaudio G, Grandi AM, Cosentino M, Venco A. Neutrophils and clinical outcomes in patients with acute coronary syndromes and/or cardiac revascularisation. A systematic review on more than 34,000 subjects. Thromb Haemost 106: 591–599, 2011. doi: 10.1160/TH11-02-0096. [DOI] [PubMed] [Google Scholar]
- 17.Guo M, Ricardo SD, Deane JA, Shi M, Cullen-McEwen L, Bertram JF. A stereological study of the renal glomerular vasculature in the db/db mouse model of diabetic nephropathy. J Anat 207: 813–821, 2005. doi: 10.1111/j.1469-7580.2005.00492.x. [DOI] [PMC free article] [PubMed] [Google Scholar]
- 18.Gupta J, Mitra N, Kanetsky PA, Devaney J, Wing MR, Reilly M, Shah VO, Balakrishnan VS, Guzman NJ, Girndt M, Periera BG, Feldman HI, Kusek JW, Joffe MM, Raj DS; CRIC Study Investigators . Association between albuminuria, kidney function, and inflammatory biomarker profile in CKD in CRIC. Clin J Am Soc Nephrol 7: 1938–1946, 2012. doi: 10.2215/CJN.03500412. [DOI] [PMC free article] [PubMed] [Google Scholar]
- 19.Haroun MK, Jaar BG, Hoffman SC, Comstock GW, Klag MJ, Coresh J. Risk factors for chronic kidney disease: a prospective study of 23,534 men and women in Washington County, Maryland. J Am Soc Nephrol 14: 2934–2941, 2003. doi: 10.1097/01.ASN.0000095249.99803.85. [DOI] [PubMed] [Google Scholar]
- 20.Harrison DG, Guzik TJ, Lob HE, Madhur MS, Marvar PJ, Thabet SR, Vinh A, Weyand CM. Inflammation, immunity, and hypertension. Hypertension 57: 132–140, 2011. doi: 10.1161/HYPERTENSIONAHA.110.163576. [DOI] [PMC free article] [PubMed] [Google Scholar]
- 21.Hill PA, Lan HY, Nikolic-Paterson DJ, Atkins RC. ICAM-1 directs migration and localization of interstitial leukocytes in experimental glomerulonephritis. Kidney Int 45: 32–42, 1994. doi: 10.1038/ki.1994.4. [DOI] [PubMed] [Google Scholar]
- 22.Hodgkins KS, Schnaper HW. Tubulointerstitial injury and the progression of chronic kidney disease. Pediatr Nephrol 27: 901–909, 2012. doi: 10.1007/s00467-011-1992-9. [DOI] [PMC free article] [PubMed] [Google Scholar]
- 23.Islam TM, Fox CS, Mann D, Muntner P. Age-related associations of hypertension and diabetes mellitus with chronic kidney disease. BMC Nephrol 10: 17, 2009. doi: 10.1186/1471-2369-10-17. [DOI] [PMC free article] [PubMed] [Google Scholar]
- 24.Kato S, Chmielewski M, Honda H, Pecoits-Filho R, Matsuo S, Yuzawa Y, Tranaeus A, Stenvinkel P, Lindholm B. Aspects of immune dysfunction in end-stage renal disease. Clin J Am Soc Nephrol 3: 1526–1533, 2008. doi: 10.2215/CJN.00950208. [DOI] [PMC free article] [PubMed] [Google Scholar]
- 25.Kazancioğlu R. Risk factors for chronic kidney disease: an update. Kidney Int Suppl (2011) 3: 368–371, 2013. doi: 10.1038/kisup.2013.79. [DOI] [PMC free article] [PubMed] [Google Scholar]
- 26.Ke Y, Tang H, Ye C, Lei CT, Wang YM, Su H, Zhang C, Jiang HJ. Role and Association of Inflammatory and Apoptotic Caspases in Renal Tubulointerstitial Fibrosis. Kidney Blood Press Res 41: 643–653, 2016. doi: 10.1159/000447933. [DOI] [PubMed] [Google Scholar]
- 27.Kilicarslan H, Yildirim S, Bagcivan I, Gokce G, Sarac B, Sarioglu Y. The effect of chronic renal failure on phosphodiesterase inhibitor-induced relaxation responses in rabbit cavernosal strips. Eur J Pharmacol 462: 155–160, 2003. doi: 10.1016/S0014-2999(03)01296-2. [DOI] [PubMed] [Google Scholar]
- 28.Kren S, Hostetter TH. The course of the remnant kidney model in mice. Kidney Int 56: 333–337, 1999. doi: 10.1046/j.1523-1755.1999.00527.x. [DOI] [PubMed] [Google Scholar]
- 29.Laouari D, Friedlander G, Burtin M, Silve C, Dechaux M, Garabedian M, Kleinknecht C. Subtotal nephrectomy alters tubular function: effect of phosphorus restriction. Kidney Int 52: 1550–1560, 1997. doi: 10.1038/ki.1997.485. [DOI] [PubMed] [Google Scholar]
- 30.Leelahavanichkul A, Yan Q, Hu X, Eisner C, Huang Y, Chen R, Mizel D, Zhou H, Wright EC, Kopp JB, Schnermann J, Yuen PS, Star RA. Angiotensin II overcomes strain-dependent resistance of rapid CKD progression in a new remnant kidney mouse model. Kidney Int 78: 1136–1153, 2010. doi: 10.1038/ki.2010.287. [DOI] [PMC free article] [PubMed] [Google Scholar]
- 31.Lessman RK, Johnson SF, Coburn JW, Kaufman JJ. Renal artery embolism: clinical features and long-term follow-up of 17 cases. Ann Intern Med 89: 477–482, 1978. doi: 10.7326/0003-4819-89-4-477. [DOI] [PubMed] [Google Scholar]
- 32.Levey AS, Astor BC, Stevens LA, Coresh J. Chronic kidney disease, diabetes, and hypertension: what’s in a name? Kidney Int 78: 19–22, 2010. doi: 10.1038/ki.2010.115. [DOI] [PubMed] [Google Scholar]
- 33.Linden E, Cai W, He JC, Xue C, Li Z, Winston J, Vlassara H, Uribarri J. Endothelial dysfunction in patients with chronic kidney disease results from advanced glycation end products (AGE)-mediated inhibition of endothelial nitric oxide synthase through RAGE activation. Clin J Am Soc Nephrol 3: 691–698, 2008. doi: 10.2215/CJN.04291007. [DOI] [PMC free article] [PubMed] [Google Scholar]
- 34.López-Novoa JM, Rodríguez-Peña AB, Ortiz A, Martínez-Salgado C, López Hernández FJ. Etiopathology of chronic tubular, glomerular and renovascular nephropathies: clinical implications. J Transl Med 9: 13, 2011. doi: 10.1186/1479-5876-9-13. [DOI] [PMC free article] [PubMed] [Google Scholar]
- 35.Lu Y, Wei J, Stec DE, Roman RJ, Ge Y, Cheng L, Liu EY, Zhang J, Hansen PB, Fan F, Juncos LA, Wang L, Pollock J, Huang PL, Fu Y, Wang S, Liu R. Macula Densa Nitric Oxide Synthase 1β Protects against Salt-Sensitive Hypertension. J Am Soc Nephrol 27: 2346–2356, 2016. doi: 10.1681/ASN.2015050515. [DOI] [PMC free article] [PubMed] [Google Scholar]
- 36.Migliorini A, Ebid R, Scherbaum CR, Anders HJ. The danger control concept in kidney disease: mesangial cells. J Nephrol 26: 437–449, 2013. doi: 10.5301/jn.5000247. [DOI] [PubMed] [Google Scholar]
- 37.Mulay SR, Desai J, Kumar SV, Eberhard JN, Thomasova D, Romoli S, Grigorescu M, Kulkarni OP, Popper B, Vielhauer V, Zuchtriegel G, Reichel C, Bräsen JH, Romagnani P, Bilyy R, Munoz LE, Herrmann M, Liapis H, Krautwald S, Linkermann A, Anders HJ. Cytotoxicity of crystals involves RIPK3-MLKL-mediated necroptosis. Nat Commun 7: 10274, 2016. doi: 10.1038/ncomms10274. [DOI] [PMC free article] [PubMed] [Google Scholar]
- 38.Paris B, Bobrie G, Rossignol P, Le Coz S, Chedid A, Plouin PF. Blood pressure and renal outcomes in patients with kidney infarction and hypertension. J Hypertens 24: 1649–1654, 2006. doi: 10.1097/01.hjh.0000239302.55754.1f. [DOI] [PubMed] [Google Scholar]
- 39.Pauletto P, Rattazzi M. Inflammation and hypertension: the search for a link. Nephrol Dial Transplant 21: 850–853, 2006. doi: 10.1093/ndt/gfl019. [DOI] [PubMed] [Google Scholar]
- 40.Perez-Ruiz L, Ros-Lopez S, Cardús A, Fernandez E, Valdivielso JM. A forgotten method to induce experimental chronic renal failure in the rat by ligation of the renal parenchyma. Nephron, Exp Nephrol 103: e126–e130, 2006. doi: 10.1159/000092198. [DOI] [PubMed] [Google Scholar]
- 41.Plantinga L, Grubbs V, Sarkar U, Hsu CY, Hedgeman E, Robinson B, Saran R, Geiss L, Burrows NR, Eberhardt M, Powe N; CDC CKD Surveillance Team . Nonsteroidal anti-inflammatory drug use among persons with chronic kidney disease in the United States. Ann Fam Med 9: 423–430, 2011. doi: 10.1370/afm.1302. [DOI] [PMC free article] [PubMed] [Google Scholar]
- 42.Pupilli C, Chevalier RL, Carey RM, Gomez RA. Distribution and content of renin and renin mRNA in remnant kidney of adult rat. Am J Physiol Renal Physiol 263: F731–F738, 1992. doi: 10.1152/ajprenal.1992.263.4.F731. [DOI] [PubMed] [Google Scholar]
- 43.Purkerson ML, Hoffsten PE, Klahr S. Pathogenesis of the glomerulopathy associated with renal infarction in rats. Kidney Int 9: 407–417, 1976. doi: 10.1038/ki.1976.50. [DOI] [PubMed] [Google Scholar]
- 44.Ramage IJ, Howatson AG, McColl JH, Maxwell H, Murphy AV, Beattie TJ, Ramage IJ. Glomerular basement membrane thickness in children: a stereologic assessment. Kidney Int 62: 895–900, 2002. doi: 10.1046/j.1523-1755.2002.00527.x. [DOI] [PubMed] [Google Scholar]
- 45.Ravera M, Re M, Deferrari L, Vettoretti S, Deferrari G. Importance of blood pressure control in chronic kidney disease. J Am Soc Nephrol 17, Suppl 2: S98–S103, 2006. doi: 10.1681/ASN.2005121319. [DOI] [PubMed] [Google Scholar]
- 46.Remuzzi G, Perico N, Macia M, Ruggenenti P. The role of renin-angiotensin-aldosterone system in the progression of chronic kidney disease. Kidney Int Suppl 68, Suppl: S57–S65, 2005. doi: 10.1111/j.1523-1755.2005.09911.x. [DOI] [PubMed] [Google Scholar]
- 47.Reuter S, Gupta SC, Chaturvedi MM, Aggarwal BB. Oxidative stress, inflammation, and cancer: how are they linked? Free Radic Biol Med 49: 1603–1616, 2010. doi: 10.1016/j.freeradbiomed.2010.09.006. [DOI] [PMC free article] [PubMed] [Google Scholar]
- 48.Robertson JL, Goldschmidt M, Kronfeld DS, Tomaszewski JE, Hill GS, Bovee KC. Long-term renal responses to high dietary protein in dogs with 75% nephrectomy. Kidney Int 29: 511–519, 1986. doi: 10.1038/ki.1986.29. [DOI] [PubMed] [Google Scholar]
- 49.Schlöndorff D, Banas B. The mesangial cell revisited: no cell is an island. J Am Soc Nephrol 20: 1179–1187, 2009. doi: 10.1681/ASN.2008050549. [DOI] [PubMed] [Google Scholar]
- 50.Schreiber A, Shulhevich Y, Geraci S, Hesser J, Stsepankou D, Neudecker S, Koenig S, Heinrich R, Hoecklin F, Pill J, Friedemann J, Schweda F, Gretz N, Schock-Kusch D. Transcutaneous measurement of renal function in conscious mice. Am J Physiol Renal Physiol 303: F783–F788, 2012. doi: 10.1152/ajprenal.00279.2012. [DOI] [PubMed] [Google Scholar]
- 51.Shah SV, Baliga R, Rajapurkar M, Fonseca VA. Oxidants in chronic kidney disease. J Am Soc Nephrol 18: 16–28, 2007. doi: 10.1681/ASN.2006050500. [DOI] [PubMed] [Google Scholar]
- 52.Shimamura T, Morrison AB. A progressive glomerulosclerosis occurring in partial five-sixths nephrectomized rats. Am J Pathol 79: 95–106, 1975. [PMC free article] [PubMed] [Google Scholar]
- 53.Silverstein DM. Inflammation in chronic kidney disease: role in the progression of renal and cardiovascular disease. Pediatr Nephrol 24: 1445–1452, 2009. doi: 10.1007/s00467-008-1046-0. [DOI] [PubMed] [Google Scholar]
- 54.Song J, Lu Y, Lai EY, Wei J, Wang L, Chandrashekar K, Wang S, Shen C, Juncos LA, Liu R. Oxidative status in the macula densa modulates tubuloglomerular feedback responsiveness in angiotensin II-induced hypertension. Acta Physiol (Oxf) 213: 249–258, 2015. doi: 10.1111/apha.12358. [DOI] [PMC free article] [PubMed] [Google Scholar]
- 55.Tervaert TW, Mooyaart AL, Amann K, Cohen AH, Cook HT, Drachenberg CB, Ferrario F, Fogo AB, Haas M, de Heer E, Joh K, Noël LH, Radhakrishnan J, Seshan SV, Bajema IM, Bruijn JA; Renal Pathology Society . Pathologic classification of diabetic nephropathy. J Am Soc Nephrol 21: 556–563, 2010. doi: 10.1681/ASN.2010010010. [DOI] [PubMed] [Google Scholar]
- 56.van den Berg JG, van den Bergh Weerman MA, Assmann KJ, Weening JJ, Florquin S. Podocyte foot process effacement is not correlated with the level of proteinuria in human glomerulopathies. Kidney Int 66: 1901–1906, 2004. doi: 10.1111/j.1523-1755.2004.00964.x. [DOI] [PubMed] [Google Scholar]
- 57.Vianna HR, Soares CM, Tavares MS, Teixeira MM, Silva AC. [Inflammation in chronic kidney disease: the role of cytokines]. J Bras Nefrol 33: 351–364, 2011. doi: 10.1590/S0101-28002011000300012. [DOI] [PubMed] [Google Scholar]
- 58.Wang L, Song J, Buggs J, Wei J, Wang S, Zhang J, Zhang G, Lu Y, Yip KP, Liu R. A new mouse model of hemorrhagic shock-induced acute kidney injury. Am J Physiol Renal Physiol 312: F134–F142, 2017. doi: 10.1152/ajprenal.00347.2016. [DOI] [PMC free article] [PubMed] [Google Scholar]
- 59.Wang X, Chandrashekar K, Wang L, Lai EY, Wei J, Zhang G, Wang S, Zhang J, Juncos LA, Liu R. Inhibition of nitric oxide synthase 1 induces salt-sensitive hypertension in nitric oxide synthase 1α knockout and wild-type mice. Hypertension 67: 792–799, 2016. doi: 10.1161/HYPERTENSIONAHA.115.07032. [DOI] [PMC free article] [PubMed] [Google Scholar]
- 60.Yamagami K, Oka T, Wang Q, Ishizu T, Lee JK, Miwa K, Akazawa H, Naito AT, Sakata Y, Komuro I. Pirfenidone exhibits cardioprotective effects by regulating myocardial fibrosis and vascular permeability in pressure-overloaded hearts. Am J Physiol Heart Circ Physiol 309: H512–H522, 2015. doi: 10.1152/ajpheart.00137.2015. [DOI] [PubMed] [Google Scholar]
- 61.Yang HC, Zuo Y, Fogo AB. Models of chronic kidney disease. Drug Discov Today Dis Models 7: 13–19, 2010. doi: 10.1016/j.ddmod.2010.08.002. [DOI] [PMC free article] [PubMed] [Google Scholar]
- 62.Zhang J, Chandrashekar K, Lu Y, Duan Y, Qu P, Wei J, Juncos LA, Liu R. Enhanced expression and activity of Nox2 and Nox4 in the macula densa in ANG II-induced hypertensive mice. Am J Physiol Renal Physiol 306: F344–F350, 2014. doi: 10.1152/ajprenal.00515.2013. [DOI] [PMC free article] [PubMed] [Google Scholar]