

Abstract
Glomerular fibrosis occurs in the early stages of multiple renal diseases, including hypertensive and diabetic nephropathy. Conventional assessment of glomerular fibrosis relies on kidney biopsy, which is invasive and does not reflect physiological aspects such as blood perfusion. In this study, we sought to assess potential changes of cortical perfusion and microstructure at different degrees of glomerular fibrosis using magnetic resonance imaging (MRI). A rat model of glomerular fibrosis was induced by injecting anti-Thy-1 monoclonal antibody OX-7 to promote mesangial extracellular matrix proliferation. For six rats on day 5 and five rats on day 12 after the induction, we measured renal cortical perfusion and spin-spin relaxation time (T2) in a 3-Tesla MRI scanner. T2 reflects tissue microstructural changes. Glomerular fibrosis severity was evaluated by histological analysis and proteinuria. Four rats without fibrosis were included as controls. In the control rats, the periodic acid-Schiff (PAS)-positive area was 22 ± 1% of total glomerular tuft, which increased significantly to 56 ± 12% and 45 ± 10% in the day 5 and day 12 fibrotic groups, respectively (P < 0.01). For the three groups (control, day 5, and day 12 after OX-7 injection), cortical perfusion was 7.27 ± 2.54, 3.78 ± 2.17, and 3.32 ± 2.62 ml·min−1·g−1, respectively, decreasing with fibrosis severity (P < 0.01), and cortical T2 was 75.2 ± 4.6, 84.1 ± 3.0, and 87.9 ± 5.6 ms, respectively (P < 0.01). In conclusion, extracellular matrix proliferation in glomerular mesangial cells severely diminished blood flow through the glomeruli and also altered cortical microstructure to increase cortical T2. The MRI-measured parameters are proven to be sensitive markers for characterizing glomerular fibrosis.
Keywords: glomerular fibrosis, magnetic resonance imaging, renal perfusion, spin-spin relaxation
INTRODUCTION
Glomerular fibrosis develops in multiple types of chronic kidney diseases (CKD), including diabetic and hypertensive nephropathy and chronic glomerulonephritis (17, 20, 29), and is characterized primarily by the proliferation of extracellular matrix of glomerular mesangial cells. In diabetic patients, exacerbation of mesangial matrix expansion leads to either diffuse or nodular scarring of the glomeruli or glomerulosclerosis (27). With glomerular fibrosis, glomerular filtration rate (GFR) may be maintained for a number of years, until the development of tubulointerstitial fibrosis leads to a decline in GFR (29). As the disease progresses, the occurrence of severe hematuria, albuminuria, or a significant drop in GFR usually prompts a kidney biopsy (33) to understand the underlying pathology. Elevated urinary albumin or general protein is indicative of glomerular injury (28) but may also be caused by a number of confounding factors (2). Indeed, there is a lack of noninvasive tools for precisely assessing glomerular fibrosis before it develops into severe renal injury, making it difficult to identify and halt the progression of renal impairment in its early stages (13).
Magnetic resonance imaging (MRI) provides multiple noncontrast imaging techniques for assessing various aspects of renal function and physiology (25, 39). However, most renal MRI research has thus far been focused on relatively late stages of renal impairment such as reduced GFR and tubulointerstitial fibrosis, but not glomerular fibrosis (13, 16). A few MRI methods are promising in detecting structural or physiological changes induced by glomerular fibrosis. Arterial spin labeling (ASL) is an MRI method that measures tissue perfusion by magnetically labeling arterial blood and then tracking its uptake by a tissue of interest (7, 18, 22). ASL has been widely shown to be sensitive to renal ischemia caused by either arterial stenosis or intrinsic kidney disease. Expansion of mesangial matrix around glomeruli would very likely affect blood flow through the glomeruli, which is potentially detectable by ASL measurement. As another MRI method, T2-weighted imaging, has received less attention for renal applications than methods like ASL or diffusion-weighted imaging, mostly because the relationship between spin-spin relaxation time (T2) and renal physiology is not straightforward. Nevertheless, a few recent studies have suggested the value of T2 for detecting tissue microstructural changes in tissue that are possibly related to water content (15, 19).
In this study, we tested the hypothesis that renal perfusion and T2 as measured by noninvasive MRI methods are sensitive biomarkers of glomerular fibrosis. Specifically, we induced glomerular fibrosis in an established rat model of glomerulonephritis and then evaluated potential fibrosis-induced changes using ASL and T2-weighted MRI. Histological analysis of harvested renal tissue was performed to accurately determine the degree of glomerular fibrosis. Conventional urinary albumin and protein levels were also measured.
MATERIALS AND METHODS
All study procedures of animals described herein were performed according to the guidelines of the Public Health Service Policy on the Use of Laboratory Animals and were approved by the Animal Care and Use Committee of the University of Utah. Fifteen male Sprague-Dawley rats (Charles River Laboratories, Wilmington, MA) weighing 180–200 g underwent MRI scans, followed by a 24-h urine collection, and were then euthanized to harvest the kidneys (10). To observe a range of fibrotic glomerular damage, the rats were randomly assigned to three groups: four rats as healthy controls, six rats to be examined 5 days after fibrosis induction, and five rats to be examined 12 days after fibrosis induction. Glomerular fibrosis was induced by a single injection of 1.75 mg/kg body wt monoclonal antibody OX-7 through the tail vein (1, 35). OX-7 binds to a Thy-1-like epitope on the surface of mesangial cells, which stimulates excessive production of extracellular matrix specifically in the glomeruli (12, 37, 38). With OX-7, extracellular matrix expansion is expected to be maximal around days 5–7 and regress by a significant degree by day 12 (36, 38).
In vivo kidney assessment by MRI.
Each rat was sedated with isoflurane (Fluriso; Vet One, Boise, ID) in an anesthesia chamber before its MR scan. During the scan, anesthesia was maintained by pumping air mixed with isoflurane (100–200 ml/min at 2–3% vaporization) through a cone placed over the rat’s snout. The rat’s body temperature was maintained with warm-water blankets. MR imaging was performed using a four-channel transmit/receive wrist coil on a 3T MRI scanner (TimTrio; Siemens). For each kidney, all images were acquired from an axial slice through the center of the kidney. Compared with coronal or sagittal slices, axial slices can be positioned more consistently through each kidney for different rats and also suffer less from partial volume artifacts. T2-weighted images were acquired using a two-dimensional (2D) fast-spin echo sequence: echo times (TE) 5.8, 29, 52, 75, 98, 122, 145, and 168 ms, echo train length 4, repetition time (TR) 400 ms, field of view (FOV) 200 × 200 mm, resolution 0.78 × 0.78 mm, and slice thickness 5 mm. Each acquisition was ∼25 s and was repeated for each individual kidney. ASL was performed using flow-sensitive alternating inversion recovery tagging, in which two different preparatory inversion pulses (slice-selective and nonselective) were applied before imaging. With either inversion pulse, the same image acquisition was performed using a 2D-balanced steady-state free precession readout with the following parameters: inversion time (TI; the delay between inversion and image readout) 320, 500, 800, 1,000, 1,300, and 1,500 ms, TR 4.7 ms, TE 2.35 ms, FOV 200 × 200 mm, resolution 0.78 × 0.78 mm, and slice thickness 3.5 mm. Idle time was included after imaging to allow for full magnetization recovery, resulting in total acquisition time of 6 s for one image.
The acquired images were processed on a personal computer using custom scripts written in MATLAB (MathWorks, Natick, MA). Each set of T2-weighted images contained eight images of different TE values from the same slice of kidney. By fitting the signal intensity vs. TE curve of each voxel to an exponential decay function (11), a T2 map was obtained for the set of T2-weighted images. For each kidney, a region of interest (ROI) was manually drawn to include all cortical regions of the kidney in the field of view, and T2 values were averaged across the ROI. Cortical perfusion was estimated from the ASL images using a tracer-kinetic approach that was analogous to the method proposed by Buxton et al. (5). For each kidney, we acquired six pairs of images with different TI values, and each pair consisted of one image obtained after a slice-selective inversion and one after a nonselective inversion. In each image, a cortical ROI was defined (in a similar manner as for the T2 maps) to compute the average cortical signal intensity. The nonselectively inverted signals were subtracted from the slice-selectively inverted signals to obtain “difference signals” at the different TIs. The difference signal vs. TI curve resembles contrast-enhanced signals acquired from dynamic contrast-enhanced MRI (40) and reflects the uptake of magnetically tagged blood in the renal cortex here. To quantify cortical perfusion from the difference signals, we simplified the conventional convolution model of Buxton et al. (5) to a piecewise linear formula to characterize the transit delay and uptake of the tagged blood in renal tissue. By fitting the linear formula to our ASL difference signal vs. TI curve, we determined cortical perfusion.
Urinary and histological analysis.
Immediately following the MRI scan, each rat was housed in a metabolic cage for 24 h for urine collection. From the collected urine, urinary albumin and creatinine excretion (μg/24 h) were measured using the DC2000+ microalbumin/creatinine reagent kit (Bayer Healthcare, Elkhart, IN), and urinary protein excretion (mg/24 h) was measured using the Bradford method (Bio-Rad Laboratories, Hercules, CA). The rats were then euthanized to remove their kidneys, which were fixed in a 10% formalin solution. Three-micrometer sections of cortical tissue were embedded in paraffin and stained with periodic acid-Schiff (PAS) solution to visualize the glomeruli. Subsections of these samples containing 20 random glomeruli were photographed with 400-fold magnification. The extent of mesangial expansion in the glomeruli was determined by measuring the area of PAS-positive mesangial matrix in the photographs using semiautomatic color image analysis software (ImageJ; National Institutes of Health). The PAS-positive material area in the mesangium was normalized by that of the total glomerular tuft to compute the percentage of mesangial matrix occupying a glomerulus. Averaging the percentage across all 20 glomeruli from a kidney, we obtained an averaged percentage for extracellular mesangium as an estimate of glomerular fibrosis degree for the kidney.
Statistical analysis.
For each rat, we measured cortical perfusion, cortical T2, urinary albumin and protein excretion, and histologically determined the degree of glomerular fibrosis, all of which were averaged between the left and the right kidney. For each group of rats (control, 5 days, and 12 days post fibrosis induction), the parameter values are reported as the mean ± SD of the values for the rats within the group. Each parameter was compared between the different groups using two-sided t-tests; a P value of <0.05 was considered to be significant. The Pearson correlation coefficient (r) was computed between the different parameters among all of the rats. In particular, the degree of glomerular fibrosis was correlated with cortical T2 and perfusion to investigate the impact of glomerular fibrosis in diminishing glomerular blood flow and in perturbing tissue T2 (through microstructural changes to glomeruli). The Pearson correlation coefficients between each of the different parameters were displayed together as a correlation matrix. Because urinary creatinine can vary substantially from day to day, cortical perfusion and T2 were also correlated against the urinary albumin/creatinine ratio.
RESULTS
Histological and urinary assessment.
The photomicrographs of the PAS-stained cortical tissue show significant mesangial matrix expansion in the glomeruli of fibrotic rats compared with the healthy controls (Fig. 1). In the control rats, mesangial matrix area as measured by our method was 22 ± 1% of the total cross-sectional area of the glomerular tuft. Using the same method to quantify glomerular fibrosis, the degree of fibrosis was found to be significantly higher (P < 0.01) in the fibrotic rats: 56 ± 12% in the 5-day fibrotic group and 45 ± 10% in the 12-day fibrotic group (Fig. 2A). Although the difference between the 5-day and 12-day groups did not reach statistical significance (P = 0.13), the decreasing trend over this period agrees with the established finding that glomerular fibrosis induced by antibody OX-7 peaks around day 5 after induction and gradually recovers afterward (23, 24).
Fig. 1.

Photomicrographs of periodic acid-Schiff (PAS)-stained glomeruli from control (A) and diseased rats 5 (B) and 12 days (C) after inducing fibrosis with antibody OX-7. PAS-positive mesangial matrix appears magenta within the glomerular tufts. Increased PAS-positive matrix is seen in B and C. These photomicrographs were obtained under 400-fold magnification.
Fig. 2.

Fibrosis-induced changes to the degree of cortical fibrosis, urinary albumin and protein, and cortical perfusion and spin-spin relaxation time (T2). A, B, C, and E: significant increases in the degree of fibrosis (A), albumin (B) and protein (C) levels in the urine, and T2 (E) were observed 5 and 12 days after fibrosis induction. D: cortical perfusion decreased significantly 5 and 12 days after fibrosis induction. *Significant deviation from values observed in the control rats (P < 0.05). No significant differences were observed between values from 5- and 12-day fibrotic rats. Urinary albumin and protein levels are shown on a logarithmic scale.
Urinary albumin excretion was significantly higher in the fibrotic rats (5 days: 939 ± 847 μg/24 h, P = 0.02; 12 days: 2,208 ± 2,099 μg/24 h, P = 0.04) compared with the healthy controls (68 ± 17 μg/24 h) (Fig. 2B). Although the difference in urinary albumin excretion between the 5- and 12-day groups was not significant (P = 0.10), the trend of increasing albuminuria over this interval was likely due to glomerular podocyte injury (6, 14). Urinary protein excretion was significantly higher in the fibrotic rats (5 days: 58 ± 20 mg/24 h, P < 0.01; 12 days: 63 ± 45 mg/24 h, P = 0.04) compared with the controls (20 ± 7 mg/24 h) (Fig. 2C), with no significant difference between the 5-day and 12-day fibrotic groups (P = 0.41).
Cortical perfusion and T2 measurements with MRI.
Representative ASL images of a rat kidney are shown in Fig. 3, A and B. The images show relatively high signal-to-noise ratio and are free of detectable artifacts. In analyzing the data, we focused on the renal cortex [dashed region of interest (ROI) in Fig. 3], where glomerular fibrosis is primarily localized. Cortical perfusion in the control rats was 7.27 ± 2.54 ml·min−1·g−1, in good agreement with a previous study using a small-animal MR scanner (7.5 ± 0.8 ml·min−1·g−1) (34). In the rats with 5-day and 12-day fibrosis, cortical perfusion was significantly lower (P < 0.01): 3.78 ± 2.17 and 3.32 ± 2.62 ml·min−1·g−1, respectively (Fig. 2D). The perfusion values between the 5-day and the 12-day fibrotic rats were not significantly different (P = 0.68).
Fig. 3.
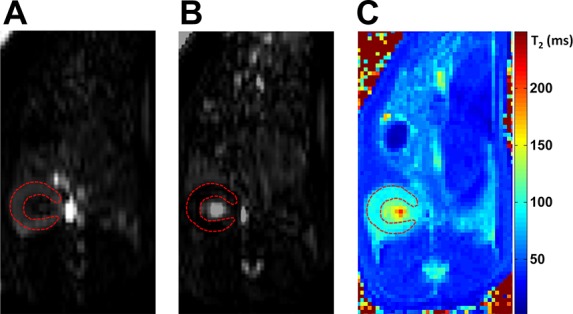
Arterial spin labeling (ASL) images and T2 map of a rat kidney. A and B: axial slice-selective (A) and nonselective (B) flow-sensitive, alternating inversion-recovery, balanced steady-state free precession images of a rat kidney are shown. The dashed region of interest highlights the renal cortex. Both images were acquired at an inversion time of 1,000 ms. C: a T2 map (in ms) of the kidney is shown.
A representative T2 map of a rat kidney is shown in Fig. 3C. Cortical T2 values, measured from similar ROIs as for the ASL data, were significantly higher in the 5-day (84.1 ± 3.0 ms, P < 0.01) and 12-day fibrotic rats (87.9 ± 5.6 ms, P < 0.01) than in the healthy controls (75.2 ± 4.6 ms) (Fig. 2E). The difference in T2 between the two fibrotic groups did not reach statistical significance (P = 0.06).
The correlation matrix in Table 1 lists the Pearson correlation coefficients (r) between the different measures of glomerular fibrosis based on the data acquired for all 15 rats. Cortical perfusion was negatively correlated with the histological and urinary fibrosis markers (r = −0.61 to −0.73), and cortical T2 was positively correlated (r = 0.56–0.69). The correlation of urinary albumin/creatinine ratio against cortical perfusion was −0.60 and against cortical T2 was 0.56. Against the histologically determined fibrotic degree, the highest correlation was with cortical perfusion (r = −0.73) and the lowest with urinary albumin (r = 0.43).
Table 1.
Correlation matrix showing the Pearson correlation coefficients (r) between different measures of glomerular fibrosis
| Fibrosis Degree | Urinary Albumin | Urinary Protein | Cortical Perfusion | Cortical T2 | |
|---|---|---|---|---|---|
| Fibrosis degree | 1 | 0.43 | 0.57 | −0.73 | 0.69 |
| Urinary albumin | 1 | 0.49 | −0.61 | 0.56 | |
| Urinary protein | 1 | −0.64 | 0.61 | ||
| Cortical perfusion | 1 | −0.71 | |||
| Cortical T2 | 1 |
T2, spin-spin relaxation time. Values in boldface are coefficients against the gold standard measurement, i.e., “fibrosis degree.”
DISCUSSION
In this study, using a rat model of glomerulonephritis, we evaluated the impact of glomerular fibrosis on MRI-measured cortical perfusion and T2. With a moderate to severe degree of glomerular fibrosis, a significant decrease in cortical perfusion (mostly blood flow through the glomeruli) and a significant increase in cortical T2 were observed. In contrast, urinary albumin, a conventional indicator of glomerular injury, correlated poorly with the fibrotic degrees. To our knowledge, this study is the first to measure cortical perfusion and T2 in the development of glomerular fibrosis. The study of glomerular fibrosis is particularly important, because glomerular fibrosis is the characteristic pathological change associated with diabetic nephropathy (9), which is the leading cause of end-stage renal diseases in Western countries (32). A noninvasive assessment tool of glomerular fibrosis as proposed in this study may detect diabetic nephrology in its early stage.
Substantial decrease (>50%) in cortical perfusion was found in the fibrotic rats of our study. The glomerulus is a globular structure of entwined vessels surrounded by the Bowman’s capsule. Between the entwined vessels are mesangial cells (8, 30, 31) that structurally support the vessels and may also cooperate with the capillary basement membrane to regulate glomerular filtration. Injection of antibody OX-7 in the rats caused excessive accumulation of mesangial extracellular matrix, resembling the glomerular fibrosis in diabetic nephropathy (4). As shown in the histological data (Fig. 1), with the relatively rigid Bowman’s capsule, expansion of the extracellular matrix inevitably “squeezed” the inside vascular space of glomerulus. For a rough estimate by treating the PAS-negative glomerular region as opened capillaries, we estimate that with fibrosis induction the vascular space of glomeruli is reduced from ∼80 to ∼50% (Fig. 2A). Such a degree of vascular constriction would significantly impede blood flow through the glomerulus (Fig. 2D). A reduction in cortical perfusion could have at least two significant consequences, the most direct one being a lowered glomerular filtration rate. The other possible consequence is lower downstream perfusion and subsequent hypoxia in the renal medulla, which could lead to tubulointerstitial inflammation and fibrosis.
Our measured T2 results showed a significant increase in T2 with glomerular fibrosis. Tissue T2 level is suitable for characterizing tissue microstructure because it is influenced primarily by the type and composition of a tissue and does not depend substantially on magnetic field strength or temperature (3). Solid tissues such as muscle and fat have T2 values of ∼50 ms, whereas the T2 of a fluid (such as blood) is longer: ∼100 ms or higher. Diuresis following furosemide or water loading may alter the water content of renal tissues, particularly the renal medulla. However, such stimuli were not found to significantly change medullary or cortical T2 (26). With a more aggressive intervention via renal-pedicle clamping in mice, Hueper et al. (15) induced ischemia-reperfusion injury that was followed by tubulointerstitial fibrosis, mainly in the outer medulla 4 wk after injury. Both cortical and medullary T2 peaked on day 7 after the injury. As suggested by the authors, this T2 increase possibly resulted from tissue edema caused by acute cell injury, vascular leakage, and cell swelling. This result is similar to what we found in our study, although our focus is on glomerular fibrosis in the cortex. Based on the findings of Prasad et al. (26) and Hueper et al. (15), we hypothesize that the observed fibrosis-induced T2 change in the current study was caused by potentially altered water content and/or distribution by the accumulated mesangial extracellular matrix. However, we cannot rule out the possible impact from potential tubulointerstitial fibrosis. To further verify the mechanism of the T2 change, our future studies will perform the MRI and histological measurements on both renal cortex and medulla and on earlier days after the fibrosis induction (see the limitation section below).
The use of noncontrast MRI techniques is critical for the assessment of glomerular fibrosis. Glomerular fibrosis occurs at a very early stage in patients with diabetes or hypertension, and although these patients may have elevated urine protein levels, most will also have a normal GFR (28). Although current guidelines do not discourage the use of gadolinium-based contrast in those with normal GFR, these patients do have glomerular injury, and any additional harm to their kidneys should be avoided. T2 and ASL MRI techniques do not involve any exogenous contrast agents and can be applied as frequently as needed. The ability to noninvasively assess glomerular fibrosis with MRI will allow for improved screening of patients at risk for developing chronic kidney disease, most notably those with diabetes and hypertension, which are the two leading causes of end-stage renal disease (21). The noninvasiveness of these techniques is also a clear advantage over kidney biopsy. The noninvasive MRI methods can be combined with proteinuria measurements in diabetic or hypertensive patients or as a followup examination after urine protein or albumin increases above some threshold level. If kidney biopsy is deemed necessary, a pre-biopsy MRI scan with the proposed methods may provide information on which of the two kidneys (or even which part of the kidney) should be biopsied.
This study has a few limitations. First, due to the relatively low resolution achievable with a clinical scanner, we did not assess the MR measures for the medulla or spatial heterogeneity of the cortical measures for the rats. We are developing a customized multiple-channel coil to enable high-resolution imaging of rat kidneys in future studies. Second, we examined rats 5 and 12 days after the injection of OX-7 but not at earlier stages, such as 1–2 days after the fibrosis induction. The current study was aimed to test the sensitivity of the MRI markers to severe degrees of glomerular fibrosis. With the positive results obtained, our future study will investigate whether the markers change with mild fibrosis. Third, isoflurane used for sedating rats in our MRI scans may have a vasodilatory effect on the kidneys and thus affect the estimated cortical perfusion. However, because the same dose of isoflurane was used for all rats, fibrosis-induced changes to cortical perfusion should not have been significantly affected.
In conclusion, renal cortical perfusion and T2 were found to be sensitive to a significant degree of glomerular fibrosis. The decrease in cortical perfusion was possibly due to the narrowing of the glomerular vascular space caused by mesangial extracellular matrix expansion. The mechanism of significant cortical T2 increase in response to glomerular fibrosis is not fully understood and warrants further investigation. The noninvasive MRI methods presented in this study are promising for the assessment of potential glomerular injury in patients with diabetes or hypertension and could be valuable for guiding kidney biopsy.
GRANTS
This work was supported by a Radiological Society of North America Research Scholar Grant, a National Kidney Foundation Young Investigator Award, and a National Institute of Diabetes and Digestive and Kidney Diseases grant (R01-DK-109349).
DISCLOSURES
No conflicts of interest, financial or otherwise, are declared by the authors.
AUTHOR CONTRIBUTIONS
C.C.C., Y.H., and B.A.J.G. performed experiments; C.C.C., Y.H., B.A.J.G., and J.L.Z. analyzed data; C.C.C., Y.H., and J.L.Z. interpreted results of experiments; C.C.C. and Y.H. prepared figures; C.C.C. and J.L.Z. drafted manuscript; C.C.C., Y.H., B.A.J.G., and J.L.Z. edited and revised manuscript; C.C.C., Y.H., B.A.J.G., and J.L.Z. approved final version of manuscript; Y.H. and J.L.Z. conceived and designed research.
REFERENCES
- 1.Bagchus WM, Hoedemaeker PJ, Rozing J, Bakker WW. Glomerulonephritis induced by monoclonal anti-Thy 1.1 antibodies. A sequential histological and ultrastructural study in the rat. Lab Invest 55: 680–687, 1986. [PubMed] [Google Scholar]
- 2.Boor P, Sebeková K, Ostendorf T, Floege J. Treatment targets in renal fibrosis. Nephrol Dial Transplant 22: 3391–3407, 2007. doi: 10.1093/ndt/gfm393. [DOI] [PubMed] [Google Scholar]
- 3.Bottomley PA, Foster TH, Argersinger RE, Pfeifer LM. A review of normal tissue hydrogen NMR relaxation times and relaxation mechanisms from 1-100 MHz: dependence on tissue type, NMR frequency, temperature, species, excision, and age. Med Phys 11: 425–448, 1984. doi: 10.1118/1.595535. [DOI] [PubMed] [Google Scholar]
- 4.Brosius FC., III New insights into the mechanisms of fibrosis and sclerosis in diabetic nephropathy. Rev Endocr Metab Disord 9: 245–254, 2008. doi: 10.1007/s11154-008-9100-6. [DOI] [PMC free article] [PubMed] [Google Scholar]
- 5.Buxton RB, Frank LR, Wong EC, Siewert B, Warach S, Edelman RR. A general kinetic model for quantitative perfusion imaging with arterial spin labeling. Magn Reson Med 40: 383–396, 1998. doi: 10.1002/mrm.1910400308. [DOI] [PubMed] [Google Scholar]
- 6.Chatziantoniou C, Boffa JJ, Tharaux PL, Flamant M, Ronco P, Dussaule JC. Progression and regression in renal vascular and glomerular fibrosis. Int J Exp Pathol 85: 1–11, 2004. doi: 10.1111/j.0959-9673.2004.00376.x. [DOI] [PMC free article] [PubMed] [Google Scholar]
- 7.Conlin CC, Oesingmann N, Bolster B Jr, Huang Y, Lee VS, Zhang JL. Renal plasma flow (RPF) measured with multiple-inversion-time arterial spin labeling (ASL) and tracer kinetic analysis: Validation against a dynamic contrast-enhancement method. Magn Reson Imaging 37: 51–55, 2017. doi: 10.1016/j.mri.2016.11.010. [DOI] [PMC free article] [PubMed] [Google Scholar]
- 8.Ghayur MN, Krepinsky JC, Janssen LJ. Contractility of the renal glomerulus and mesangial cells: lingering doubts and strategies for the future. Med Hypotheses Res 4: 1–9, 2008. [PMC free article] [PubMed] [Google Scholar]
- 9.Gilbert RE, Cox A, Dziadek M, Cooper ME, Jerums G. Extracellular matrix and its interactions in the diabetic kidney: a molecular biological approach. J Diabetes Complications 9: 252–254, 1995. doi: 10.1016/1056-8727(95)80015-7. [DOI] [PubMed] [Google Scholar]
- 10.Gu C, Zhou G, Noble NA, Border WA, Cheung AK, Huang Y. Targeting reduction of proteinuria in glomerulonephritis: Maximizing the antifibrotic effect of valsartan by protecting podocytes. J Renin Angiotensin Aldosterone Syst 15: 177–189, 2014. doi: 10.1177/1470320312466127. [DOI] [PubMed] [Google Scholar]
- 11.Haacke EM, Brown RW, Thompson MR, Venkatesan R. Spin Density, T1 and T2 quantification methods in MR imaging. In: Magnetic Resonance Imaging: Physical Principles and Sequence Design, edited by Haacke EM, Brown RW, Thompson MR, and Venkatesan R. New York: Wiley, 1999, p. 637–665. [Google Scholar]
- 12.Harendza S, Schneider A, Helmchen U, Stahl RA. Extracellular matrix deposition and cell proliferation in a model of chronic glomerulonephritis in the rat. Nephrol Dial Transplant 14: 2873–2879, 1999. doi: 10.1093/ndt/14.12.2873. [DOI] [PubMed] [Google Scholar]
- 13.Hennedige T, Koh TS, Hartono S, Yan YY, Song IC, Zheng L, Lee WS, Rumpel H, Martarello L, Khoo JB, Koh DM, Chuang KH, Thng CH. Intravoxel incoherent imaging of renal fibrosis induced in a murine model of unilateral ureteral obstruction. Magn Reson Imaging 33: 1324–1328, 2015. doi: 10.1016/j.mri.2015.07.012. [DOI] [PubMed] [Google Scholar]
- 14.Hotta O, Furuta T, Chiba S, Tomioka S, Taguma Y. Regression of IgA nephropathy: a repeat biopsy study. Am J Kidney Dis 39: 493–502, 2002. doi: 10.1053/ajkd.2002.31399. [DOI] [PubMed] [Google Scholar]
- 15.Hueper K, Rong S, Gutberlet M, Hartung D, Mengel M, Lu X, Haller H, Wacker F, Meier M, Gueler F. T2 relaxation time and apparent diffusion coefficient for noninvasive assessment of renal pathology after acute kidney injury in mice: comparison with histopathology. Invest Radiol 48: 834–842, 2013. doi: 10.1097/RLI.0b013e31829d0414. [DOI] [PubMed] [Google Scholar]
- 16.Ichikawa S, Motosugi U, Ichikawa T, Sano K, Morisaka H, Araki T. Intravoxel incoherent motion imaging of the kidney: alterations in diffusion and perfusion in patients with renal dysfunction. Magn Reson Imaging 31: 414–417, 2013. doi: 10.1016/j.mri.2012.08.004. [DOI] [PubMed] [Google Scholar]
- 17.Jinde K, Nikolic-Paterson DJ, Huang XR, Sakai H, Kurokawa K, Atkins RC, Lan HY. Tubular phenotypic change in progressive tubulointerstitial fibrosis in human glomerulonephritis. Am J Kidney Dis 38: 761–769, 2001. doi: 10.1053/ajkd.2001.27693. [DOI] [PubMed] [Google Scholar]
- 18.Kim SG. Quantification of relative cerebral blood flow change by flow-sensitive alternating inversion recovery (FAIR) technique: application to functional mapping. Magn Reson Med 34: 293–301, 1995. doi: 10.1002/mrm.1910340303. [DOI] [PubMed] [Google Scholar]
- 19.Kundel HL, Schlakman B, Joseph PM, Fishman JE, Summers R. Water content and NMR relaxation time gradients in the rabbit kidney. Invest Radiol 21: 12–17, 1986. doi: 10.1097/00004424-198601000-00002. [DOI] [PubMed] [Google Scholar]
- 20.Liu Y. Renal fibrosis: new insights into the pathogenesis and therapeutics. Kidney Int 69: 213–217, 2006. doi: 10.1038/sj.ki.5000054. [DOI] [PubMed] [Google Scholar]
- 21.López-Novoa JM, Martínez-Salgado C, Rodríguez-Peña AB, López-Hernández FJ. Common pathophysiological mechanisms of chronic kidney disease: therapeutic perspectives. Pharmacol Ther 128: 61–81, 2010. doi: 10.1016/j.pharmthera.2010.05.006. [DOI] [PubMed] [Google Scholar]
- 22.Martirosian P, Klose U, Mader I, Schick F. FAIR true-FISP perfusion imaging of the kidneys. Magn Reson Med 51: 353–361, 2004. doi: 10.1002/mrm.10709. [DOI] [PubMed] [Google Scholar]
- 23.Nakayama H, Oite T, Kawachi H, Morioka T, Kobayashi H, Orikasa M, Arakawa M, Shimizu F. Comparative nephritogenicity of two monoclonal antibodies that recognize different epitopes of rat Thy-1.1 molecule. Nephron 78: 453–463, 1998. doi: 10.1159/000044975. [DOI] [PubMed] [Google Scholar]
- 24.Oite T, Suzuki Y, Morioka T, Saito M, Shimizu F. Efficient isolation of rat aortic endothelial cells by elimination of contaminating cells with a monoclonal antibody. Microvasc Res 50: 113–118, 1995. doi: 10.1006/mvre.1995.1043. [DOI] [PubMed] [Google Scholar]
- 25.Prasad PV. Functional MRI of the kidney: tools for translational studies of pathophysiology of renal disease. Am J Physiol Renal Physiol 290: F958–F974, 2006. doi: 10.1152/ajprenal.00114.2005. [DOI] [PMC free article] [PubMed] [Google Scholar]
- 26.Prasad PV, Edelman RR, Epstein FH. Noninvasive evaluation of intrarenal oxygenation with BOLD MRI. Circulation 94: 3271–3275, 1996. doi: 10.1161/01.CIR.94.12.3271. [DOI] [PubMed] [Google Scholar]
- 27.Qian Y, Feldman E, Pennathur S, Kretzler M, Brosius FC III. From fibrosis to sclerosis: mechanisms of glomerulosclerosis in diabetic nephropathy. Diabetes 57: 1439–1445, 2008. doi: 10.2337/db08-0061. [DOI] [PMC free article] [PubMed] [Google Scholar]
- 28.Remuzzi G, Bertani T. Pathophysiology of progressive nephropathies. N Engl J Med 339: 1448–1456, 1998. doi: 10.1056/NEJM199811123392007. [DOI] [PubMed] [Google Scholar]
- 29.Schena FP, Gesualdo L. Pathogenetic mechanisms of diabetic nephropathy. J Am Soc Nephrol 16, Suppl 1: S30–S33, 2005. doi: 10.1681/ASN.2004110970. [DOI] [PubMed] [Google Scholar]
- 30.Schlondorff D. The glomerular mesangial cell: an expanding role for a specialized pericyte. FASEB J 1: 272–281, 1987. doi: 10.1096/fasebj.1.4.3308611. [DOI] [PubMed] [Google Scholar]
- 31.Stockand JD, Sansom SC. Glomerular mesangial cells: electrophysiology and regulation of contraction. Physiol Rev 78: 723–744, 1998. doi: 10.1152/physrev.1998.78.3.723. [DOI] [PubMed] [Google Scholar]
- 32.Sugaru E, Nakagawa T, Ono-Kishino M, Nagamine J, Tokunaga T, Kitoh M, Hume WE, Nagata R, Taiji M. SMP-534 ameliorates progression of glomerular fibrosis and urinary albumin in diabetic db/db mice. Am J Physiol Renal Physiol 290: F813–F820, 2006. doi: 10.1152/ajprenal.00357.2005. [DOI] [PubMed] [Google Scholar]
- 33.Walker PD, Cavallo T, Bonsib SM; Ad Hoc Committee on Renal Biopsy Guidelines of the Renal Pathology Society . Practice guidelines for the renal biopsy. Mod Pathol 17: 1555–1563, 2004. doi: 10.1038/modpathol.3800239. [DOI] [PubMed] [Google Scholar]
- 34.Wang J-J, Hendrich KS, Jackson EK, Ildstad ST, Williams DS, Ho C. Perfusion quantitation in transplanted rat kidney by MRI with arterial spin labeling. Kidney Int 53: 1783–1791, 1998. doi: 10.1046/j.1523-1755.1998.00945.x. [DOI] [PubMed] [Google Scholar]
- 35.Yang HC, Zuo Y, Fogo AB. Models of chronic kidney disease. Drug Discov Today Dis Models 7: 13–19, 2010. doi: 10.1016/j.ddmod.2010.08.002. [DOI] [PMC free article] [PubMed] [Google Scholar]
- 36.Yoshimura A, Nemoto T, Sugenoya Y, Inui K, Watanabe S, Inoue Y, Sharif S, Yokota N, Uda S, Morita H, Ideura T. Effect of simvastatin on proliferative nephritis and cell-cycle protein expression. Kidney Int Suppl 71: S84–S87, 1999. doi: 10.1046/j.1523-1755.1999.07121.x. [DOI] [PubMed] [Google Scholar]
- 37.Yu L, Border WA, Anderson I, McCourt M, Huang Y, Noble NA. Combining TGF-beta inhibition and angiotensin II blockade results in enhanced antifibrotic effect. Kidney Int 66: 1774–1784, 2004. doi: 10.1111/j.1523-1755.2004.00901.x. [DOI] [PubMed] [Google Scholar]
- 38.Zhang J, Gu C, Noble NA, Border WA, Huang Y. Combining angiotensin II blockade and renin receptor inhibition results in enhanced antifibrotic effect in experimental nephritis. Am J Physiol Renal Physiol 301: F723–F732, 2011. doi: 10.1152/ajprenal.00271.2011. [DOI] [PMC free article] [PubMed] [Google Scholar]
- 39.Zhang JL, Morrell G, Rusinek H, Sigmund EE, Chandarana H, Lerman LO, Prasad PV, Niles D, Artz N, Fain S, Vivier PH, Cheung AK, Lee VS. New magnetic resonance imaging methods in nephrology. Kidney Int 85: 768–778, 2014. doi: 10.1038/ki.2013.361. [DOI] [PMC free article] [PubMed] [Google Scholar]
- 40.Zhang JL, Rusinek H, Bokacheva L, Lerman LO, Chen Q, Prince C, Oesingmann N, Song T, Lee VS. Functional assessment of the kidney from magnetic resonance and computed tomography renography: impulse retention approach to a multicompartment model. Magn Reson Med 59: 278–288, 2008. doi: 10.1002/mrm.21489. [DOI] [PMC free article] [PubMed] [Google Scholar]