

Abstract
Sepsis and acute kidney injury (AKI) synergistically increase morbidity and mortality in the ICU. How sepsis reduces glomerular filtration rate (GFR) and causes AKI is poorly understood; one proposed mechanism includes tubuloglomerular feedback (TGF). When sodium reabsorption by the proximal tubules is reduced in normal animals, the macula densa senses increased luminal sodium chloride, and then adenosine-1a receptor (A1aR) signaling triggers tubuloglomerular feedback, reducing GFR through afferent arteriole vasoconstriction. We measured GFR and systemic hemodynamics early during cecal ligation and puncture-induced sepsis in wild-type and A1aR-knockout mice. A miniaturized fluorometer was attached to the back of each mouse and recorded the clearance of FITC-sinistrin via transcutaneous fluorescence to monitor GFR. Clinical organ injury markers and cytokines were measured and hemodynamics monitored using implantable transducer telemetry devices. In wild-type mice, GFR was stable within 1 h after surgery, declined by 43% in the next hour, and then fell to less than 10% of baseline after 2 h and 45 min. In contrast, in A1aR-knockout mice GFR was 37% below baseline immediately after surgery and then gradually declined over 4 h. A1aR-knockout mice had similar organ injury and inflammatory responses, albeit with lower heart rate. We conclude that transcutaneous fluorescence can accurately monitor GFR and detect changes rapidly during sepsis. Tubuloglomerular feedback plays a complex role in sepsis; initially, TGF helps maintain GFR in the 1st hour, and over the subsequent 3 h, TGF causes GFR to plummet. By 18 h, TGF has no cumulative effect on renal or extrarenal organ damage.
Keywords: adenosine-1a receptor, glomerular filtration rate
INTRODUCTION
In response to an infection, a carefully orchestrated series of events in the host is initiated to contain and eliminate pathogens. A dysregulated host response can change a controlled infection into sepsis with a significantly elevated risk of mortality and morbidity. Although precise values depend on the definitions used, a recent update indicated a mortality rate of greater than 10% (45) for sepsis, increasing to 46.5% for septic shock (43). Organ dysfunction is common and is associated with more severe outcomes (6, 16). Acute kidney injury (AKI) often occurs and is generally recognized by an elevation in a passive filtration marker such as serum creatinine or a loss of urine production (18a, 29). Although these signs and biomarkers have driven clinical practice for many years, they are incomplete, and there is still much we cannot answer for individual patients or for septic AKI generally. Filtration markers respond slowly to a change in glomerular filtration rate (GFR), and changes can be further obscured during sepsis due to changes in their production and/or volume of distribution (9, 23). Because of these challenges, the timing and mechanism of the falling GFR in septic AKI is ill-defined. Although the consensus view is that human AKI is well developed by the time serum creatinine elevation is detected, the time between the start of injury and elevation is largely unknown (47). Animal models provide a setting in which the timing of the insult is known. Cecal ligation and puncture (CLP) surgery is known to reliably induce an elevation in filtration markers [blood urea nitrogen (BUN), serum creatinine, and serum cystatin C] and histological evidence of acute kidney injury by 18–24 h and beyond; the results have been reproduced in many laboratories (17, 35). Creatinine is nearly normal or barely elevated 6 h after CLP, a time when the animals are beginning to show clinical signs of sepsis (23). We have further investigated this timing in two prior studies. In Dear et al. (8), using aged C57BL/6 mice, we found profound perturbations in renal perfusion by MRI 6 h after CLP. In this study, aged C57BL/6 mice were used, as age is a strong predictor for both human sepsis and human sepsis-induced AKI. In Leelahavanichkul et al. (23), GFR was measured directly by inulin clearance as early as 3 h after CLP in young CD-1 mice. In this study, GFR had fallen by 50% after 3 h. However, measurement of inulin plasma disappearance requires 45 min and can be done only once in each animal. The slow response and single measurements in these studies give limited information on the timing of the onset of AKI and mechanisms of early kidney dysfunction/injury.
There is also uncertainty in how the kidney is damaged during sepsis and how this damage causes a reduction in the GFR (18). A long-held hypothesis was that hypotension during sepsis caused hypoperfusion of the kidneys, leading to hypoxic injury and a reduction in the GFR due to reduced pressure in the capillaries of the glomeruli. Evidence now suggests that hypoperfusion is rare, and in some cases hyperperfusion may actually be seen (1, 2, 21, 36). As attention moves to other potential explanations, the possibility that the kidney injury and reduction in GFR are only indirectly linked and are mediated by different mechanisms, despite having the same ultimate cause, may remain relevant. Blockage of the lumen with sloughing cells (25) or swelling of the tubule cells (31) would suggest that injury is directly responsible for the falling GFR. Alternatively, microcirculatory changes may simultaneously and independently cause both tubular injury and a reduction in the GFR by decreasing glomerular capillary pressure (27). There is, however, a need for GFR and tubular reabsorption to be balanced. If GFR were maintained while tubular reabsorption was decreased, there would be a rapid and dangerous loss of water and electrolytes (38, 46). To prevent this, tubuloglomerular feedback (TGF) can restrict GFR if reduced reabsorption is sensed. This activity has been suggested to constitute “acute renal success,” with the rapid fall in GFR being the kidney functioning correctly to preserve the organism (11, 50). Elevated luminal sodium chloride is detected at the macula densa, causing the release of ATP. This ATP is converted to adenosine and binds to the adenosine 1a receptor (A1aR) on the smooth muscle cells of the afferent arteriole causing vasoconstriction. This vasoconstriction reduces glomerular capillary pressure and GFR (38, 48).
Our aim during this study was to leverage improved technology for GFR measurement, namely transcutaneous fluorescence monitoring, to establish an early timeline for the known decrease of GFR in septic AKI. Furthermore, we tested whether the early fall in GFR may be enhanced by tubuloglomerular feedback.
METHODS
Animals and animal models.
We followed National Institutes of Health (NIH) guidelines for the use and treatment of laboratory animals, and the Institute’s Animal Care and Use Committee approved all procedures. All animals had free access to water and chow throughout the study.
Adenosine 1a receptor-knockout mice were generated previously (48). Breeder mice had previously been back-crossed with C57BL/6 mice for 10 generations. Wild-type and knockout littermates from heterozygote × heterozygote crosses were used for all studies. All mice were ≥9 mo old at the time of cecal ligation and puncture (CLP) surgery. Genotypes were confirmed by quantitative PCR on tail DNA after euthanasia.
CLP surgery was performed to induce sepsis, largely as previously described (30). Via a midline incision the cecum was located and ligated with 4-0 silk suture 15 mm from the tip, and a 21-g needle was then passed through the ligated cecum. The cecum was returned to the peritoneal cavity and the incision closed. During surgery, a slow release formulation of buprenorphine (0.5 mg/kg sc; SR Veterinary Technologies, Windsor, CO) was administered for analgesia. Also, 40 ml/kg fluids was given intraperitoneally at the time of surgery (0.9% saline) and then subcutaneously at 6 h (0.6% saline). Antibiotics were given with fluids at 6 h [14 mg/kg Primaxin (Imipenem and cilastatin); Merck, Whitehouse Station, NJ]. In sham controls, surgery was performed as for CLP, with the cecum returned to the peritoneal cavity without ligation or puncture.
GFR measurement in conscious animals.
GFR was monitored noninvasively by measurement of the change in transcutaneous fluorescence of FITC-sinistrin over time using a small fluorometer (MediBeacon, St. Louis, MO) attached to the mouse. At the start of CLP surgery, FITC-sinistrin (15 mg/kg; Fresenius-Kabi, Linz, Austria) was injected intravenously via the retro-orbital sinus. The fluorometer was programmed to make a transcutaneous measurement every 5 s, and up to 5 h of measurements were stored on the device. A second bolus of FITC-sinistrin was administered at 1 h and 45 min after CLP surgery to maintain fluorescence in the measurable range. GFR was calculated using a single-compartment model enabling direct conversion from the elimination half-life using a published conversion factor (41). The half-life was calculated using the following formula:
where t is half-life, t is time, and N0 and Nt are fluorescence at the start and at time t. This relationship is the inverse of the slope on a plot of log2 fluorescence vs. time. All plots of raw fluorescence recordings are therefore shown as the log2 fluorescence values against time.
To validate this transcutaneous method against the existing gold standard (plasma disappearance), timed blood collections were also made in a limited number of wild-type mice (n = 4). At 15 and 50 min after the first injection and 15, 50, and 120 min after the second injection of FITC-sinistrin, a small volume of blood was collected from the tail vein. The concentration of FITC-sinistrin was determined by fluorescence (470-nm excitation and 515-nm emission) on a Nanodrop ND-3300 (ThermoFisher). Concentration was log2 transformed for comparison with the log2-transformed transcutaneous fluorescence measurements.
Blood pressure measurement by telemetry.
A Data Sciences International (St. Paul, MN) telemetry system was used for measurement of blood pressure. A telemetry device with a pressure transducer (model TA11PA-C10) was implanted ≥1 wk before CLP surgery. The catheter of the device was introduced into the aortic arch via the left carotid artery and secured. A slow-release formulation of buprenorphine was used for analgesia, and 40 ml/kg saline was given subcutaneously after surgery. Blood pressure was continuously recorded and mean arterial pressure, systolic pressure, diastolic pressure, and heart rate subsequently measured.
Clinical chemistry markers and cytokines.
An autoanalyzer (Hitachi 917; Boehringer Mannheim, Indianapolis, IN) was used to measure serum BUN, phosphorus, glucose, lactate dehydrogenase, creatine kinase, amylase, alkaline phosphatase, aspartate transaminase, and alanine transaminase. Serum creatinine was measured by HPLC (51). Serum IL-6, IL-10, and TNFα were measured by ELISA (R & D Systems, Minneapolis, MN).
Histology.
After collection, tissue was immediately transferred to 10% formalin and fixed for ≥24 h before being paraffin embedded. Sections were cut to a thickness of 4 μm and then stained with periodic acid-Schiff reagent. Semiquantitative assessment of injury was performed by scoring 10 randomly selected, ×20 objective fields per mouse on the following scale: 1) tubular damage observed in 0–25% of the field, 2) 25–50%, 3) 50–75%, and 4) 75–100%.
Statistics and data analysis.
Transcutaneous fluorescence measurements were analyzed using a python program (10) interfacing with the Changepoint Analysis software package (19) in R (49). The mean function from the package was used with default settings. The method was At Most One Change, and the penalty was Modified Bayesian Information Criterion. The background and derivation of the method used has been reported previously (14, 15). Briefly, the Changepoint Analysis addresses two questions: 1) what common point in a two-phase regression model (2 linear regression models joined by a common point) best fits the data, and 2) is a two-phase regression model better than a single linear regression model? To automatically find the optimal changepoint (the common point in a 2-phase regression model), each point in the data is considered as a candidate, and a goodness of fit score is calculated for the resulting model. The changepoint chosen is the point resulting in the best score. Because of the extra degree of freedom, this model will always be better than a single linear regression model. For a changepoint to be reported by the software package, the goodness-of-fit score for the two-phase model must exceed the score for the single linear regression model (the null hypothesis) plus a penalty to account for the extra degree of freedom.
Blood pressure data was initially processed by the Ponemah software package (Data Sciences International). Recordings from multiple mice were aligned and groups compared with a python program using the statsmodels package (42).
Comparison of two groups was by t-test. Comparison of three groups was by one-way ANOVA, and the influence of two different independent variables (i.e., time point and genotype) on a measurement was assessed by two-way ANOVA. Bonferroni post hoc tests were used for both one-way and two-way ANOVA analyses. The slope of GFR decline was analyzed by linear regression (Prism 5; GraphPad Software, La Jolla, CA).
RESULTS
Glomerular filtration rate after cecal ligation and puncture surgery.
Glomerular filtration rate was calculated from transcutaneous fluorescence enabling near-continuous and real-time monitoring. By plotting log2-transformed fluorescence, the local slope of the line during the elimination phase can be directly converted into an elimination half-life and a GFR using published conversion factors (41). In a healthy mouse, the elimination phase begins ∼15 min after injection and lasts ∼50 min. To monitor for a longer period of time, a second dose of FITC-sinistrin was injected.
Following CLP surgery in both wild-type and A1aR-knockout mice, the initial fall in log2 fluorescence (1st hour) was linear, indicating that the GFR was stable (Fig. 1, A and B). In wild-type mice, this changed after the second injection of FITC-sinistrin at 2 h onward; the subsequent change in log2 fluorescence did not follow a linear model. This divergence from linearity was investigated by applying changepoint analysis to identify the point at which the change in log2 fluorescence over time was no longer linear. Although timing differences were observed between animals, a changepoint was consistently detected at 2.6 ± 0.7 (means ± SD) hours after CLP in wild-type animals. In A1aR-knockout mice we also identified a changepoint, although the difference in slope before and after was much smaller.
Fig. 1.

Glomerular filtration rate (GFR) following cecal ligation and puncture (CLP) surgery. Mice underwent CLP surgery to induce sepsis. The transcutaneous fluorometer was secured (S) ∼5 min after the mouse was removed from its home cage to induce anesthesia. The FITC-sinistrin was injected (I) within 1 min. CLP surgery was then performed and finished (F) ∼10 min later. The mice were returned to their home cages and elimination kinetics monitored by transcutaneous fluorescence to calculate GFR. A 2nd bolus injection was given, requiring ∼3 min of anesthesia. A and B: representative transcutaneous fluorescence recording in a wild-type (WT) mouse (A) and an adenosine-1a receptor (A1aR)-knockout (KO) mouse (B). Measured transcutaneous fluorescence is indicated by a continuous, thin, solid line. The slope in each measurement period is indicated by thick solid lines within the range of the fluorescence and extended further by thick dashed lines. The changepoint is indicated by a circle. C: comparison of the GFR between WT and A1aR-KO mice during each measurement period (n = 5–6; means ± SE). The 1st GFR measurement began after distribution of the initial injection of FITC-sinistrin and the fluorescence signal had returned to the measurable range. The measurement then ended before the 2nd injection or when the intensity fell below threshold if earlier [∼15 min to 1 h and 15 min (0:15–1:15)]. The second GFR measurement began after distribution of the 2nd injection and fluorescence had returned to the measurable range and then ended when a changepoint was detected [∼2 h to 2 h and 45 min (2:00–2:45)]. The final measurement was from the changepoint to when fluorescence intensity dropped below threshold or the maximum recording period for the device was reached [∼2 h and 45 min to 4 h (2:45–4:00)].
We measured GFR at baseline (1 day before CLP) and after CLP surgery (Fig. 1C). To prevent loss of detectable fluorescence, we uniformly gave a second bolus injection ∼1 h and 45 min after CLP surgery. With this protocol, we could measure GFR between 15 min and 1 h and 15 min (0:15–1:15) and then between 2 h and 2 h and 45 min (2:00–2:45), at which point a changepoint was detected in the fluorescence loss, and between 2 h and 45 minutes and 4 h (2:45–4:00). In wild-type mice, the GFR following CLP was equal to or moderately greater than baseline during the 1st hour (1 h: 583 ± 67 vs. baseline, 513 ± 55 μl·min−1·100 g body wt−1, P = not significant). The trend toward an increasing GFR is consistent with other experiments observing comparable increases in GFR from fluid administration before sham surgery (data not shown). At 2 h after CLP, the GFR then declined [364 ± 57 μl·min−1·100 g body wt−1, P = not significant vs. baseline and P < 0.05 vs. 15 min to 1 h and 15 min (0:15–1:15)]. After 2 h and 45 min, the GFR dropped further, another sevenfold, to less than one-tenth of baseline GFR (P < 0.001 vs. baseline and 0:15–1:15).
In contrast, A1aR-knockout mice were unable to maintain their GFR in the first hour after CLP surgery (0:15–1:15: 350 ± 48 vs. baseline: 561 ± 70 μl·min−1·100 g body wt−1, P < 0.05) but then only slowly declined further from the 2:00–2:45 (237 ± 75 μl·min−1·100 g body wt−1, P < 0.001 vs. baseline, P = not significant vs. 0:15–1:15) and 2:45–4:00 (156 ± 53 μl·min−1·100 g body wt−1, P < 0.001 vs. baseline, P < 0.05 vs. 0:15–1:15) time periods. By the end of the measurement period, the GFR was one-quarter of baseline, albeit still triple the GFR in wild-type mice at that time. The slope of GFR loss was significantly greater in wild-type than in A1aR-knockout mice (P < 0.005), consistent with a role for tubuloglomerular feedback in depressing GFR during early sepsis progression.
Comparison between transcutaneous and plasma measurements.
Traditional GFR measurement techniques directly measure marker appearance in urine (classic clearance) or plasma disappearance. Both techniques require multiple blood samples (and/or urine samples for clearance) that would need to be collected under anesthesia in mice. General anesthesia causes hypotension, which would exacerbate septic shock. Transcutaneous fluorescence measures GFR by plasma disappearance. It provides an indirect measurement of GFR in conscious, freely moving mice, with a trade-off of not collecting urine concentration or volume, as urine collection is impractical. Instead, a conversion factor is used to calculate GFR from the kinetics of fluorescence loss. GFR measurement by transcutaneous fluorescence has previously been validated in mice (39, 41) and rats (5, 40), including healthy animals and chronic kidney disease (CKD) models. These studies derived the conversion factor by comparison with direct measurement of plasma disappearance. The GFR would be expected to be stable during the time of measurement in healthy and CKD animals, with minimal changes in technical factors that can influence optical GFR measurement such as skin perfusion and volume of distribution. After CLP, rapid physiological changes occur, including in GFR (see above) and possibly skin perfusion and FITC-sinistrin distribution. Because these factors could alter the relationship between GFR and transcutaneous fluorescence, we directly compared transcutaneous GFR measurements with plasma concentrations of FITC-sinistrin after CLP.
The absolute transcutaneous fluorescence signal is influenced by placement of the fluorometer device and cannot be directly converted to plasma concentration without calibration. However, by aligning the maximum measurement for both transcutaneous fluorescence and plasma concentration, the two measurements can be compared (Fig. 2A). There was good agreement between transcutaneous fluorescence and plasma concentration (r2 = 0.857, P < 0.001), indicating that changes in observed kinetics are likely due to changes in GFR.
Fig. 2.

Validation of transcutaneous and multiple-injection GFR measurements. A: FITC-sinistrin was injected into wild-type mice undergoing CLP surgery to induce sepsis with a 2nd bolus injected 1 h later. The transcutaneous fluorometer was secured (S) ∼5 min after the mouse was removed from its home cage to induce anesthesia. The FITC-sinistrin was injected (I) within 1 min. CLP surgery was then performed and finished (F) ∼10 min later, and the mice were returned to their home cages. Transcutaneous fluorescence was recorded, and blood samples were obtained from the tail vein to monitor plasma concentration. Blood samples were collected at 15 and 50 min after the first FITC-sinistrin injection and 15, 50, and 120 min after the 2nd FITC-sinistrin injection. The transcutaneous fluorescence axis (left y-axes) and the plasma concentration axis (right y-axes) have been set to approximately align the maximum values for each measurement. B: Comparison of the GFR at baseline and following the 1st and 2nd injections of FITC-Sinistrin after sham surgery.
Comparison of GFR measurements between the first and second injections of FITC-sinistrin.
GFR measurements are typically performed with exogenous agents to prevent baseline levels or changes in production from affecting the measurement. To verify that the use of repeated injections of FITC-sinistrin had not compromised our GFR measurements, we repeated our protocol with sham surgery, expecting the GFR to be stable. Differences in GFR between baseline and after the first and second injections of FITC-sinistrin were detected (P < 0.05 by ANOVA; Fig. 2B), with multiple-comparison tests between groups not significant. The difference between the GFR measured after the first and second injections was just 5.7 μl·min−1·100 g body wt−1 (P = 0.99).
Clinical chemistry markers and cytokines.
We collected standard circulating markers of organ dysfunction and systemic inflammation at 18 h after CLP surgery. After 5 h, the fluorometers were removed and the mice housed under standard conditions until 18 h after CLP, when the mice were euthanized with blood and tissue collected. At 18 h, there was no difference in BUN (wild type: 82.0 ± 7.7 vs. knockout: 85.2 ± 13.5 mg/dl, P = not signigicant; Fig. 3A) or creatinine (wild type: 0.41 ± 0.10 vs. knockout: 0.53 ± 0.14 mg/dl, P = not signigicant; Fig. 3A), suggesting that the early difference in GFR was transient and did not have a lasting impact on acute sepsis outcomes. Other organ injury markers, including alanine aminotransferase, aspartate aminotransferase (liver), and amylase (pancreas), were also similar (P = not signigicant; Fig. 3A). Both the proinflammatory cytokines IL-6 and TNFα, and the anti-inflammatory cytokine IL-10 were elevated in CLP compared with sham operated controls (P < 0.0001); however, they were similar between wild-type and A1aR-knockout mice (P = not signigicant; Fig. 3B).
Fig. 3.

Clinical chemistry markers and cytokines after CLP. At 18 h after CLP, mice were euthanized, and blood was collected. A: a standardized panel of biomarkers was measured including kidney [blood urea nitrogen (BUN), serum creatinine, phosphorus], liver (alanine aminotransferase and aspartate aminotransferase), and pancreas (amylase) injury markers. No statistically significant difference was observed between wild-type (WT) and A1aR-knockout (KO) mice. B: cytokine levels (IL-6, IL-10, and TNFα) were measured. Both WT and A1aR-KO mice had elevated levels compared with sham-operated controls and no difference was observed between WT and A1aR-KO mice. Values are log10 transformed. ***P < 0.001. ○, Values for individual mice.
Histology after CLP.
Consistent with the elevated BUN and serum creatinine, kidney injury was observed by histology at 18 h (Fig. 4A). The extent of injury, as assessed by a semiquantitative score, was similar between the wild-type and A1aR-knockout mice (P = not signigicant; Fig. 4B).
Fig. 4.

Histology after CLP. At 18 h after CLP, mice were euthanized and tissues collected. Formalin fixed, paraffin-embedded samples were stained with Periodic acid-Schiff stain. A: representative images of kidney from wild-type (WT) and A1aR-knockout (KO) mice. B: semiquantitative assessment of kidney damage. ○, Values for individual mice.
Hemodynamics after CLP.
To investigate whether the change in GFR following CLP surgery may be due to changes in systemic hemodynamics, blood pressure was monitored in a separate cohort of mice (n = 5 in knockout, n = 10 in wild type). Blood pressure telemetry devices were implanted 1 wk before CLP surgery, allowing time for recovery. Hemodynamics were continuously monitored in unrestrained mice. Significant variability, particularly at the earliest time points after CLP surgery, was observed both for individual mice and between mice.
In wild-type mice, mean blood pressure slightly increased during the first hour after CLP (0 h: 69.4 ± 11.2; 1 h: 91.1 ± 6.4 mmHg; P < 0.05; Fig. 5) and then decreased over the next 3 h before stabilizing (5 h: 63.3 ± 8.7; 18 h: 64.0 ± 7.9 mmHg; P = not significant, comparing 1 vs. 5 or 18 h, P < 0.01). Heart rate modestly declined throughout the study period (0 h: 505.4 ± 34.9; 18 h: 376.8 ± 60.5 beats/min; P < 0.001).
Fig. 5.
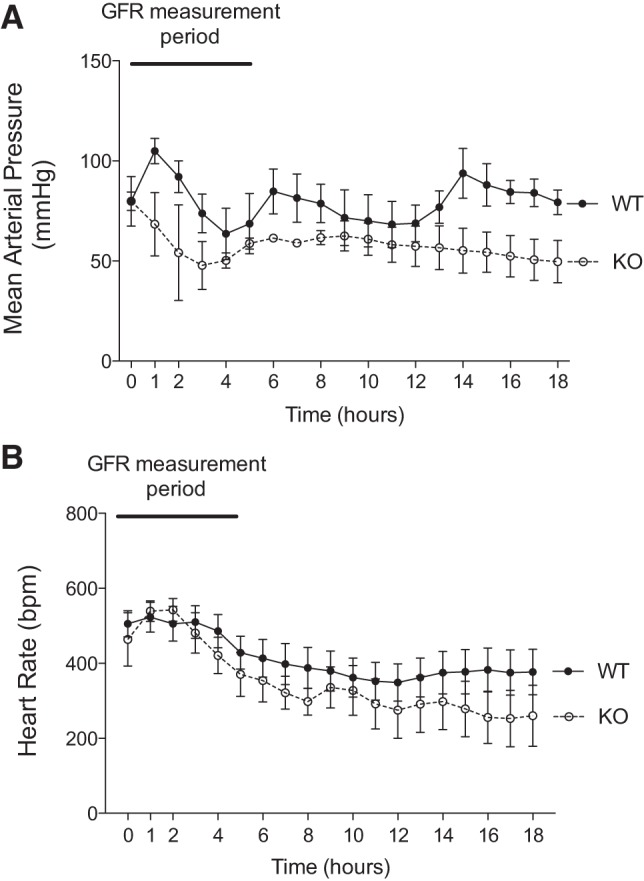
Hemodynamics after CLP. A blood pressure telemetry device was surgically implanted in wild-type (WT) and A1aR-knockout (KO) mice, with the sensory catheter introduced into the carotid artery. Following recovery for 1 wk, mice underwent CLP surgery to induce sepsis. Approximately 15 min elapsed from the removal of a mouse from its home cage to its return when measurement started, including the induction of anesthesia and surgery. Blood pressure was continuously monitored, and mean arterial pressure and heart rate were calculated for the 18 h of the study. Zero hour is the time at which the mouse was returned to its home cage.
In A1aR-knockout mice, the mean arterial pressure declined over the first 4 h after CLP (0 h: 91.0 ± 23.4; 4 h: 58.0 ± 3.6 mmHg, P = not significant; Fig. 5) and then was stable to the end of the study (18 h: 58.0 ± 5.0 mmHg). Even with the decline in blood pressure, heart rate steadily declined throughout the study (0 h: 463.9 ± 71.1; 18 h: 260.2 ± 81.4 beats/min; P < 0.001).
DISCUSSION
In the present study, we adapted a new transcutaneous measurement method to enable earlier and more frequent assessment of GFR during sepsis, which is important, as the rapidly changing GFR is not detected by conventional GFR surrogate biomarkers. We also tested the impact of knocking out the adenosine 1a receptor on GFR, systemic hemodynamics by telemetry, and organ dysfunction by clinical markers and histology. Our main findings were as follows. 1) In wild-type mice, GFR was initially stable (15 min to 1 h and 15 min) but then rapidly fell to near zero by 2:45–4:00, a time course that was much faster than would be predicted by the change in serum creatinine. The fall in GFR occurred faster than the fall in blood pressure. 2) A1aR-knockout mice were unable to maintain their GFR during the first hour after surgery, and then GFR slowly declined. In contrast to wild-type mice, the fall in GFR did not precede the fall in blood pressure in A1aR-knockout mice. The time courses for the fall in blood pressure, GFR, and heart rate were similar. 3) Despite early differences in GFR, wild-type and A1aR-knockout mice exhibited similar amounts of functional and histological renal injury at 18 h.
We employed transcutaneous fluorescence GFR measurements as an alternative to serial blood collection GFR for sepsis studies. Serial blood collections have the advantage of providing an actual concentration that can be used for direct determination of GFR together with other parameters such as volume of distribution (34). The disadvantages are additional stress for the animals, the ability to measure GFR only once per animal due to the number of blood samples needed, and limited time resolution due to the GFR being an average over the time blood samples were collected, which is typically 75 min (34). Transcutaneous fluorescence measurement allows improved time resolution and continuous measurement, although it does require a conversion factor to calculate a GFR. The conversion factor is needed to adjust the transcutaneous fluorescence kinetics to the plasma concentration kinetics. The conversion factor has been measured previously and reported for healthy and CKD mice, both with stable hemodynamics (39, 41), but this factor had not been assessed in sepsis. We directly compared the two approaches and observed close agreement between transcutaneous fluorescence and plasma concentration both immediately following surgery and after the second bolus injection, validating the conversion factor within the context of sepsis. The noninvasive transcutaneous method allowed us to detect changes in GFR much earlier than in previous studies.
The drop in GFR after sepsis was detected earlier and more profoundly than in previous reports. Cecal ligation and puncture surgery are known to reliably induce an elevation in filtration markers (BUN, serum creatinine, and serum cystatin C) and histological evidence of acute kidney injury by 18–24 h and beyond (17, 35). Creatinine is nearly normal or barely elevated 6 h after CLP, a time when the animals are beginning to show clinical signs of sepsis (23, 24). Because the interpretation of endogenous filtration marker levels is dependent on constant production, renal function may appear normal during early sepsis because the production of creatinine (9) and cystatin C (23) are markedly decreased. By using an inert exogenous compound, FITC-sinistrin, GFR can be monitored every 15–30 min. Using continuous measurements, we found that GFR started falling 2:00–2:45 after CLP and was nearly zero by 2:45–4:00; again, creatinine was either not or barely increased at 6 h in previous studies.
Initially, the GFR was stable for the first hour in wild-type mice, whereas GFR fell in A1aR-knockout mice. The initial decrease from baseline GFR in A1aR-knockout mice does not appear to be hemodynamically mediated, as the systemic blood pressure is similar to wild-type mice at 0–1 h after surgery. The fall is unlikely to be caused by lack of tubuloglomerular feedback (TGF), as the TGF signal would increase and not decrease GFR. Instead, the A1aR-signaling pathway (including TGF) protects or maintains GFR during this first hour via either an autoregulatory feedback signal or an unknown TGF-independent pathway. The loss of GFR could be mediated by one or more of the previously reported mechanisms, including tubular cell swelling (31), cell shedding into and blockage of the lumen (25), vasoconstriction of the afferent arteriole by reactive oxygen species, prostaglandins, thromboxane, etc., and/or vasorelaxation of the efferent arteriole. This could be compounded if there was a failure of myogenic autoregulation to maintain renal blood flow (7, 28).
After the first hour, in wild-type mice, the GFR fell more rapidly than in A1aR-knockout mice. The rapid fall suggests that an organized/global mechanism is responsible for the reduction in GFR rather than a sequential loss of function in nephrons throughout the kidney. The fall in GFR did not appear to be caused by systemic hemodynamic changes, as the mean arterial pressure was still at baseline as the GFR declined at 2 h to 2 h and 45 min postsurgery. It is possible that other events sensitize the kidney at the later time points to a reduced MAP, but this by itself does not seem sufficient to cause a reduced GFR. Our study has focused on tubuloglomerular feedback as one potential mechanism. The less steep rate of GFR loss in A1aR-knockout mice is consistent with a role for tubuloglomerular feedback, although sepsis is highly complex and the involvement of multiple mechanisms at different times remains likely.
Although at the earliest time points GFR decreases precede hypotension, at later times falling MAP and/or heart rate could still directly cause the fall in GFR. The observation that A1aR-knockout mice are sensitive to a restriction in the blood flow to the kidneys supports this possibility (13). Hashimoto et al. (13) found that partial clamping of the renal arteries to restrict blood flow reduced GFR in A1aR-knockout mice, whereas wild-type mice were able to maintain their GFR. It is not clear how loss of A1aR signaling would mediate this effect, although compensatory signaling by other pathways or loss of A1aR signaling other than tubuloglomerular feedback is likely responsible.
Despite early differences in GFR and blood pressure, both wild-type and A1aR-knockout mice exhibited similar amounts of functional and histological renal injury at 18 h. Thus, differences between GFR in wild-type and A1aR-knockout mice are restricted to the first few hours after CLP surgery; over time, the GFR in both wild-type and A1aR-knockout mice become close to zero. Collectively, our results suggest that homeostatic mechanisms (i.e., TGF) are predominant early on but then become overwhelmed during later stages of sepsis. Hence, if there is “acute renal success” via TGF, it is short-lived, and understanding what happens at that critical juncture between success and injury will be important to developing a rational early therapeutic.
Sepsis is a severe and extremely rapid perturbation of normal physiology, and our ability to interrogate the events that unfold without our measurements altering the progression is limited. Therefore, our results must be interpreted with caution. In this study, we do not measure tubuloglomerular feedback directly, and so uncertainty must remain on the role of tubuloglomerular feedback in the early hours after sepsis. Direct measurement of tubuloglomerular feedback would require anesthetizing the mice, visualization of the kidney, and micropuncture of individual nephrons. We have previously observed elevated mortality with a comparatively simple blood collection at 6 h (23) and would expect significant changes in the response to sepsis if attempting micropuncture measurement of tubuloglomerular feedback (37). Because of this limitation, we have focused on excluding possible confounding factors.
Although our primary interest in the A1aR is due to its role in tubuloglomerular feedback (3, 48), adenosine and adenosine signaling have other roles during health and disease. Adenosine signaling is involved in a variety of different actions, many of which are relevant to sepsis (26). Adenosine receptors are present on inflammation and immune-related cells and can exert a variety of both pro- and anti-inflammatory actions (20, 33). Furthermore, adenosine signaling is involved in the regulation of blood pressure, with the balance between A1aR and A2aR altering vascular tone in the periphery (44) and influencing centrally mediated responses in the brainstem (32). A2aR signaling causes vasodilation that, in the absence of counteracting vasoconstriction from A1aR signaling, may explain the reduced blood pressure observed in the A1aR-knockout mice (22). Given the diverse roles of adenosine generally and A1aR specifically, it is possible that the A1aR-knockout mice will have a different response to sepsis that is independent of the role of A1aR in tubuloglomerular feedback. We saw no difference in markers of organ injury 18 h after CLP surgery, suggesting that the global phenotype is similar in wild-type and A1aR-knockout mice. The inflammatory profile was also similar with TNFα, IL-6, and IL-10, albeit increased from sham, and also comparable in wild-type and A1aR-knockout mice.
These observations suggest that the kidney is very sensitive to the septic environment, and the fall in GFR is much earlier than previously recognized. The kidney has already sensed and responded to an adverse environment hours before biomarkers such as BUN and serum creatinine become elevated. These data suggest that GFR may fall earlier and more profoundly in human septic AKI, even while serum biomarkers are still within the normal range. Regulation of kidney homeostatic mechanisms (i.e., TGF) is maintained even in the initial phase of sepsis, suggesting that the initial GFR decline reflects the success of the kidney to prevent a massive diuresis (and reduce oxygen consumption) and not necessarily an early indication of the cellular injury that will develop. Perhaps various serum or urine biomarkers can be used to differentiate physiological from pathophysiological changes in GFR. It is unlikely that injury can be entirely stopped even with a complete cessation of glomerular filtration. Swift treatment remains vital in achieving the best outcome. Restoring GFR without first correcting the injurious environment may appear beneficial initially but later results in ongoing injury and adverse outcomes (4). Conversely, correcting the septic environment earlier may be easier, as the metabolic burden is low, and the GFR should respond when the sepsis resolves. Unfortunately, until loss of GFR can be diagnosed more rapidly, delayed treatment will be inevitable, and such treatment will need to limit continuing injury and/or repair damaged nephrons.
In conclusion, we measured transcutaneous fluorescence to monitor GFR and used telemetry to measure systemic hemodynamics early after CLP sepsis. GFR was initially maintained in wild-type mice during the first hour after surgery and then rapidly declined, approaching zero 2 h and 45 min to 4 h after surgery. The rapid fall may be due initially to tubuloglomerular feedback, as A1aR-knockout mice that lack tubuloglomerular feedback had a slower decline in GFR. Despite these early differences, both groups of mice had similar injury at 18 h. Thus, TGF may be important in early sepsis to reduce renal function (acute renal success) but then becomes overwhelmed.
GRANTS
This research was supported by the Intramural Research Program of the National Institutes of Health and the National Institute of Diabetes and Digestive and Kidney Diseases.
DISCLOSURES
No conflicts of interest, financial or otherwise, are declared by the authors.
AUTHOR CONTRIBUTIONS
J.M.S., P.S.Y., and R.A.S. conceived and designed research; J.M.S., E.H.K., T.R.B., X.H., and P.S.Y. performed experiments; J.M.S., E.H.K., T.R.B., and P.S.Y. analyzed data; J.M.S., E.H.K., P.S.Y., and R.A.S. interpreted results of experiments; J.M.S. and X.H. prepared figures; J.M.S. drafted manuscript; J.M.S., E.H.K., P.S.Y., and R.A.S. edited and revised manuscript; J.M.S., E.H.K., T.R.B., X.H., P.S.Y., and R.A.S. approved final version of manuscript.
REFERENCES
- 1.Bouglé A, Duranteau J. Pathophysiology of sepsis-induced acute kidney injury: the role of global renal blood flow and renal vascular resistance. Contrib Nephrol 174: 89–97, 2011. doi: 10.1159/000329243. [DOI] [PubMed] [Google Scholar]
- 2.Brenner M, Schaer GL, Mallory DL, Suffredini AF, Parrillo JE. Detection of renal blood flow abnormalities in septic and critically ill patients using a newly designed indwelling thermodilution renal vein catheter. Chest 98: 170–179, 1990. doi: 10.1378/chest.98.1.170. [DOI] [PubMed] [Google Scholar]
- 3.Brown R, Ollerstam A, Johansson B, Skøtt O, Gebre-Medhin S, Fredholm B, Persson AE. Abolished tubuloglomerular feedback and increased plasma renin in adenosine A1 receptor-deficient mice. Am J Physiol Regul Integr Comp Physiol 281: R1362–R1367, 2001. doi: 10.1152/ajpregu.2001.281.5.R1362. [DOI] [PubMed] [Google Scholar]
- 4.Chawla LS, Kellum JA, Ronco C. Permissive hypofiltration. Crit Care 16: 317, 2012. doi: 10.1186/cc11253. [DOI] [PMC free article] [PubMed] [Google Scholar]
- 5.Cowley AW Jr, Ryan RP, Kurth T, Skelton MM, Schock-Kusch D, Gretz N. Progression of glomerular filtration rate reduction determined in conscious Dahl salt-sensitive hypertensive rats. Hypertension 62: 85–90, 2013. doi: 10.1161/HYPERTENSIONAHA.113.01194. [Correction in Hypertension 62: e12, 2013.] [DOI] [PMC free article] [PubMed] [Google Scholar]
- 6.Craciun FL, Iskander KN, Chiswick EL, Stepien DM, Henderson JM, Remick DG. Early murine polymicrobial sepsis predominantly causes renal injury. Shock 41: 97–103, 2014. doi: 10.1097/SHK.0000000000000073. [DOI] [PMC free article] [PubMed] [Google Scholar]
- 7.Cupples WA, Braam B. Assessment of renal autoregulation. Am J Physiol Renal Physiol 292: F1105–F1123, 2007. doi: 10.1152/ajprenal.00194.2006. [DOI] [PubMed] [Google Scholar]
- 8.Dear JW, Kobayashi H, Jo SK, Holly MK, Hu X, Yuen PS, Brechbiel MW, Star RA. Dendrimer-enhanced MRI as a diagnostic and prognostic biomarker of sepsis-induced acute renal failure in aged mice. Kidney Int 67: 2159–2167, 2005. doi: 10.1111/j.1523-1755.2005.00321.x. [DOI] [PubMed] [Google Scholar]
- 9.Doi K, Yuen PS, Eisner C, Hu X, Leelahavanichkul A, Schnermann J, Star RA. Reduced production of creatinine limits its use as marker of kidney injury in sepsis. J Am Soc Nephrol 20: 1217–1221, 2009. doi: 10.1681/ASN.2008060617. [DOI] [PMC free article] [PubMed] [Google Scholar]
- 10.Python Software Foundation. Python (Online) https://www.python.org/. [2017].
- 11.Gomez H, Ince C, De Backer D, Pickkers P, Payen D, Hotchkiss J, Kellum JA. A unified theory of sepsis-induced acute kidney injury: inflammation, microcirculatory dysfunction, bioenergetics, and the tubular cell adaptation to injury. Shock 41: 3–11, 2014. doi: 10.1097/SHK.0000000000000052. [DOI] [PMC free article] [PubMed] [Google Scholar]
- 13.Hashimoto S, Huang Y, Briggs J, Schnermann J. Reduced autoregulatory effectiveness in adenosine 1 receptor-deficient mice. Am J Physiol Renal Physiol 290: F888–F891, 2006. doi: 10.1152/ajprenal.00381.2005. [DOI] [PubMed] [Google Scholar]
- 14.Hinkley DV. Inference about the change-point in a sequence of random variables. Biometrika 57: 1–17, 1970. doi: 10.1093/biomet/57.1.1. [DOI] [Google Scholar]
- 15.Hinkley DV. Inference about the intersection in two-phase regression. Biometrika 56: 495–504, 1969. doi: 10.1093/biomet/56.3.495. [DOI] [Google Scholar]
- 16.Hoste EA, Bagshaw SM, Bellomo R, Cely CM, Colman R, Cruz DN, Edipidis K, Forni LG, Gomersall CD, Govil D, Honoré PM, Joannes-Boyau O, Joannidis M, Korhonen AM, Lavrentieva A, Mehta RL, Palevsky P, Roessler E, Ronco C, Uchino S, Vazquez JA, Vidal Andrade E, Webb S, Kellum JA. Epidemiology of acute kidney injury in critically ill patients: the multinational AKI-EPI study. Intensive Care Med 41: 1411–1423, 2015. doi: 10.1007/s00134-015-3934-7. [DOI] [PubMed] [Google Scholar]
- 17.Hubbard WJ, Choudhry M, Schwacha MG, Kerby JD, Rue LW III, Bland KI, Chaudry IH. Cecal ligation and puncture. Shock 24, Suppl 1: 52–57, 2005. doi: 10.1097/01.shk.0000191414.94461.7e. [DOI] [PubMed] [Google Scholar]
- 18.Kellum JA. Why are patients still getting and dying from acute kidney injury? Curr Opin Crit Care 22: 513–519, 2016. doi: 10.1097/MCC.0000000000000358. [DOI] [PubMed] [Google Scholar]
- 18a.KDIGO Acute Kidney Injury Work Group. KDIGO clinical practice guideline for acute kidney injury. Kidney Int Suppl 2: 1–138, 2012. 10.1038/kisup.2012.2. [DOI] [Google Scholar]
- 19.Killick R, Eckley IA. Changepoint: an R package for changepoint analysis. J Stat Soft 58: 1–19, 2014. https://www.jstatsoft.org/index.php/jss/rt/captureCite/v058i03/0’. [Google Scholar]
- 20.Kumar V, Sharma A. Adenosine: an endogenous modulator of innate immune system with therapeutic potential. Eur J Pharmacol 616: 7–15, 2009. doi: 10.1016/j.ejphar.2009.05.005. [DOI] [PubMed] [Google Scholar]
- 21.Langenberg C, Wan L, Egi M, May CN, Bellomo R. Renal blood flow and function during recovery from experimental septic acute kidney injury. Intensive Care Med 33: 1614–1618, 2007. doi: 10.1007/s00134-007-0734-8. [DOI] [PubMed] [Google Scholar]
- 22.Layland J, Carrick D, Lee M, Oldroyd K, Berry C. Adenosine: physiology, pharmacology, and clinical applications. JACC Cardiovasc Interv 7: 581–591, 2014. doi: 10.1016/j.jcin.2014.02.009. [DOI] [PubMed] [Google Scholar]
- 23.Leelahavanichkul A, Souza AC, Street JM, Hsu V, Tsuji T, Doi K, Li L, Hu X, Zhou H, Kumar P, Schnermann J, Star RA, Yuen PS. Comparison of serum creatinine and serum cystatin C as biomarkers to detect sepsis-induced acute kidney injury and to predict mortality in CD-1 mice. Am J Physiol Renal Physiol 307: F939–F948, 2014. doi: 10.1152/ajprenal.00025.2013. [DOI] [PMC free article] [PubMed] [Google Scholar]
- 24.Leelahavanichkul A, Yasuda H, Doi K, Hu X, Zhou H, Yuen PS, Star RA. Methyl-2-acetamidoacrylate, an ethyl pyruvate analog, decreases sepsis-induced acute kidney injury in mice. Am J Physiol Renal Physiol 295: F1825–F1835, 2008. doi: 10.1152/ajprenal.90442.2008. [DOI] [PMC free article] [PubMed] [Google Scholar]
- 25.Lerolle N, Nochy D, Guérot E, Bruneval P, Fagon JY, Diehl JL, Hill G. Histopathology of septic shock induced acute kidney injury: apoptosis and leukocytic infiltration. Intensive Care Med 36: 471–478, 2010. doi: 10.1007/s00134-009-1723-x. [DOI] [PubMed] [Google Scholar]
- 26.Liu H, Xia Y. Beneficial and detrimental role of adenosine signaling in diseases and therapy. J Appl Physiol (1985) 119: 1173–1182, 2015. doi: 10.1152/japplphysiol.00350.2015. [DOI] [PMC free article] [PubMed] [Google Scholar]
- 27.Matejovic M, Ince C, Chawla LS, Blantz R, Molitoris BA, Rosner MH, Okusa MD, Kellum JA, Ronco C; ADQI XIII Work Group . Renal Hemodynamics in AKI: In Search of New Treatment Targets. J Am Soc Nephrol 27: 49–58, 2016. doi: 10.1681/ASN.2015030234. [DOI] [PMC free article] [PubMed] [Google Scholar]
- 28.Mayeux PR, MacMillan-Crow LA. Pharmacological targets in the renal peritubular microenvironment: implications for therapy for sepsis-induced acute kidney injury. Pharmacol Ther 134: 139–155, 2012. doi: 10.1016/j.pharmthera.2012.01.004. [DOI] [PMC free article] [PubMed] [Google Scholar]
- 29.Mehta RL, Kellum JA, Shah SV, Molitoris BA, Ronco C, Warnock DG, Levin A; Acute Kidney Injury Network . Acute Kidney Injury Network: report of an initiative to improve outcomes in acute kidney injury. Crit Care 11: R31, 2007. doi: 10.1186/cc5713. [DOI] [PMC free article] [PubMed] [Google Scholar]
- 30.Miyaji T, Hu X, Yuen PS, Muramatsu Y, Iyer S, Hewitt SM, Star RA. Ethyl pyruvate decreases sepsis-induced acute renal failure and multiple organ damage in aged mice. Kidney Int 64: 1620–1631, 2003. doi: 10.1046/j.1523-1755.2003.00268.x. [DOI] [PubMed] [Google Scholar]
- 31.Nakano D, Doi K, Kitamura H, Kuwabara T, Mori K, Mukoyama M, Nishiyama A. Reduction of Tubular Flow Rate as a Mechanism of Oliguria in the Early Phase of Endotoxemia Revealed by Intravital Imaging. J Am Soc Nephrol 26: 3035–3044, 2015. doi: 10.1681/ASN.2014060577. [DOI] [PMC free article] [PubMed] [Google Scholar]
- 32.Nassar NN, Abdel-Rahman AA. Brain stem adenosine receptors modulate centrally mediated hypotensive responses in conscious rats: A review. J Adv Res 6: 331–340, 2015. doi: 10.1016/j.jare.2014.12.005. [DOI] [PMC free article] [PubMed] [Google Scholar]
- 33.Ramakers BP, Riksen NP, van der Hoeven JG, Smits P, Pickkers P. Modulation of innate immunity by adenosine receptor stimulation. Shock 36: 208–215, 2011. doi: 10.1097/SHK.0b013e318225aee4. [DOI] [PubMed] [Google Scholar]
- 34.Rieg T. A High-throughput method for measurement of glomerular filtration rate in conscious mice. J Vis Exp 75: e50330, 2013. doi: 10.3791/50330. [DOI] [PMC free article] [PubMed] [Google Scholar]
- 35.Rittirsch D, Huber-Lang MS, Flierl MA, Ward PA. Immunodesign of experimental sepsis by cecal ligation and puncture. Nat Protoc 4: 31–36, 2009. doi: 10.1038/nprot.2008.214. [DOI] [PMC free article] [PubMed] [Google Scholar]
- 36.Saotome T, Ishikawa K, May CN, Birchall IE, Bellomo R. The impact of experimental hypoperfusion on subsequent kidney function. Intensive Care Med 36: 533–540, 2010. doi: 10.1007/s00134-009-1740-9. [DOI] [PubMed] [Google Scholar]
- 37.Schnermann J. Micropuncture analysis of tubuloglomerular feedback regulation in transgenic mice. J Am Soc Nephrol 10: 2614–2619, 1999. [DOI] [PubMed] [Google Scholar]
- 38.Schnermann J, Briggs JP. Tubuloglomerular feedback: mechanistic insights from gene-manipulated mice. Kidney Int 74: 418–426, 2008. doi: 10.1038/ki.2008.145. [DOI] [PMC free article] [PubMed] [Google Scholar]
- 39.Schock-Kusch D, Geraci S, Ermeling E, Shulhevich Y, Sticht C, Hesser J, Stsepankou D, Neudecker S, Pill J, Schmitt R, Melk A. Reliability of transcutaneous measurement of renal function in various strains of conscious mice. PLoS One 8: e71519, 2013. doi: 10.1371/journal.pone.0071519. [DOI] [PMC free article] [PubMed] [Google Scholar]
- 40.Schock-Kusch D, Xie Q, Shulhevich Y, Hesser J, Stsepankou D, Sadick M, Koenig S, Hoecklin F, Pill J, Gretz N. Transcutaneous assessment of renal function in conscious rats with a device for measuring FITC-sinistrin disappearance curves. Kidney Int 79: 1254–1258, 2011. doi: 10.1038/ki.2011.31. [DOI] [PubMed] [Google Scholar]
- 41.Schreiber A, Shulhevich Y, Geraci S, Hesser J, Stsepankou D, Neudecker S, Koenig S, Heinrich R, Hoecklin F, Pill J, Friedemann J, Schweda F, Gretz N, Schock-Kusch D. Transcutaneous measurement of renal function in conscious mice. Am J Physiol Renal Physiol 303: F783–F788, 2012. doi: 10.1152/ajprenal.00279.2012. [DOI] [PubMed] [Google Scholar]
- 42.Seabold S, Perktold J. Statsmodels: Econometric and statistical modeling with python. In: 9th Python in Science Conference, 2010. [Google Scholar]
- 43.Shankar-Hari M, Phillips GS, Levy ML, Seymour CW, Liu VX, Deutschman CS, Angus DC, Rubenfeld GD, Singer M; Sepsis Definitions Task Force . Developing a new definition and assessing new clinical criteria for septic shock: for the Third International Consensus definitions for sepsis and septic shock (Sepsis-3). JAMA 315: 775–787, 2016. doi: 10.1001/jama.2016.0289. [DOI] [PMC free article] [PubMed] [Google Scholar]
- 44.Silva L, Subiabre M, Araos J, Sáez T, Salsoso R, Pardo F, Leiva A, San Martín R, Toledo F, Sobrevia L. Insulin/adenosine axis linked signalling. Mol Aspects Med, 2016. doi: 10.1016/j.mam.2016.11.002. [DOI] [PubMed] [Google Scholar]
- 45.Singer M, Deutschman CS, Seymour CW, Shankar-Hari M, Annane D, Bauer M, Bellomo R, Bernard GR, Chiche JD, Coopersmith CM, Hotchkiss RS, Levy MM, Marshall JC, Martin GS, Opal SM, Rubenfeld GD, van der Poll T, Vincent JL, Angus DC. The Third International Consensus Definitions for Sepsis and Septic Shock (Sepsis-3). JAMA 315: 801–810, 2016. doi: 10.1001/jama.2016.0287. [DOI] [PMC free article] [PubMed] [Google Scholar]
- 46.Singh P, Okusa MD. The role of tubuloglomerular feedback in the pathogenesis of acute kidney injury. Contrib Nephrol 174: 12–21, 2011. doi: 10.1159/000329229. [DOI] [PubMed] [Google Scholar]
- 47.Star RA. Treatment of acute renal failure. Kidney Int 54: 1817–1831, 1998. doi: 10.1046/j.1523-1755.1998.00210.x. [DOI] [PubMed] [Google Scholar]
- 48.Sun D, Samuelson LC, Yang T, Huang Y, Paliege A, Saunders T, Briggs J, Schnermann J. Mediation of tubuloglomerular feedback by adenosine: evidence from mice lacking adenosine 1 receptors. Proc Natl Acad Sci USA 98: 9983–9988, 2001. doi: 10.1073/pnas.171317998. [DOI] [PMC free article] [PubMed] [Google Scholar]
- 49.R Core Team. R: A Language and Environment for Statistical Computing (Online) http://www.r-project.org/. [2017].
- 50.Thurau K, Boylan JW. Acute renal success. The unexpected logic of oliguria in acute renal failure. Am J Med 61: 308–315, 1976. doi: 10.1016/0002-9343(76)90365-X. [DOI] [PubMed] [Google Scholar]
- 51.Yuen PS, Dunn SR, Miyaji T, Yasuda H, Sharma K, Star RA. A simplified method for HPLC determination of creatinine in mouse serum. Am J Physiol Renal Physiol 286: F1116–F1119, 2004. doi: 10.1152/ajprenal.00366.2003. [DOI] [PubMed] [Google Scholar]