

Abstract
Hypoxia is an important feature of tumor microenvironment, exerting far-reaching effects on cells and contributing to cancer progression. Previous studies have established substantial differences in hypoxia response between various cell lines. Investigating this phenomenon in melanoma cells contributes to a better understanding of cell lineage-specific hypoxia response and could point out novel hypoxia-regulated genes. We investigated transcriptional activity of B16(F10) murine melanoma cells cultured for 24 h under hypoxic (nominal 1% O2, 15 samples including controls) and hypoxia-mimicking conditions (cobalt chloride, 100 or 200 μM, 6 samples including controls). Gene expression profiles were analyzed using MG-U74Av2 oligonucleotide microarrays. Data analysis revealed 2541 probesets (FDR <5%) for 1% oxygen experiment and 364 probesets (FDR <5%) for cobalt chloride, which showed differences in expression levels. Analysis of hypoxia-regulated genes (true hypoxia, 1% O2) by stringent Family-Wise Error Rate estimation indicated 454 significantly changed transcripts (p < 0.05). The most upregulated genes were Lgals3, Selenbp1, Nppb (more than ten-fold increase). We observed significant differences in expression levels of genes regulating glycolysis (Pfkp, Hk2, Aldo3, Eno2), apoptosis (Bnip3, Bnip3l, Cdkn1a), transcription (Bhlhb2, Sap30, Atf3, Mxi1), angiogenesis (Vegfa, Adm, Anxa2, Ctgf), adhesion (Pkp2, Itga4, Mcam), migration (Cnn2, Tmsb4x), and other processes. Both true hypoxia and hypoxia mimicry induced HIF-1-regulated genes. However, unsupervised analysis (Singular Value Decomposition) revealed distinct differences in gene expression between these two experimental conditions. Contrary to hypoxia, cobalt chloride caused suppression of gene expression rather than stimulation, especially concerning transcripts related to proliferation, immune response, DNA repair, and melanin biosynthesis.
Key words: Hypoxia, Cobalt chloride, Melanoma, Oligonucleotide microarrays, Singular Value Decomposition
INTRODUCTION
Hypoxia is a common phenomenon associated with various solid tumors. It is caused by insufficient oxygen supply that results mainly from aberrant architecture of tumor vessels. Cells respond to stressing conditions by turning on expression programs that enable them not only to adapt to such conditions and survive but also to proliferate or leave the adverse microenvironment (15). The “hypoxic phenotype” is mainly regulated by transcription factor HIF-1, which stimulates expression of proangiogenic factors (VEGF, ADM), apoptosis regulators (BNIP3), glycolytic enzymes (HK2, ALDO3, PFK), transport proteins (GLUT1, GLUT3), and others (35).
Hypoxia is in itself an obstacle to the treatment of solid tumors. Low oxygen tension decreases effectiveness of both radiation therapy and chemotherapy. By inducing molecular changes that promote a more malignant cell phenotype, hypoxia also leads to selection of apoptosis-insensitive cancer cells that possess higher metastatic potential. Such changes involve stimulation of genes encoding drug resistance as well as proangiogenic and antiapoptotic factors. Low oxygen tension also affects activity of DNA repair enzymes, adhesion molecules, and proteins involved in cell invasiveness (16,24). Although hypoxia exerts common biological effects, recent studies have nonetheless shown that there exist substantial differences in gene expression profiles among different cell lines (4,6). The knowledge concerning hypoxia-regulated cell-specific transcripts may be helpful both in deeper understanding of the hypoxia response mechanisms and also in seeking potential prognostic markers and therapeutic targets.
DNA microarray technology offers a convenient tool for identifying gene expression changes caused by various stimuli. Using this technology, the effects of induced hypoxia were studied in various models (4,6,11,43,47). Microarray analyses reveal hypoxia-regulated single genes as well as allow discerning sets of genes predominantly regulated by oxygen tension and specifying transcripts involved in particular hypoxia-dependent cellular processes.
Even though hypoxia was shown to enhance meta-static potential of B16(F10) murine melanoma cells in vivo (30), to our knowledge there have been no microarray technology-based reports for this cell line concerning transcriptional activity under hypoxia. Thus, the aim of our study was to thoroughly analyze hypoxia-induced gene expression changes in B16(F10) murine melanoma cells cultures using high-density microarrays and to search for hypoxia-regulated transcripts that might be specific for melanoma and/or associated with aggressiveness. We employed three methods of inducing hypoxia in vitro. Some cell cultures were exposed to decreased levels of oxygen, either in an O2-regulated incubator or in a closed (static) chamber; these two conditions are herein referred to as “true hypoxia.” The third method employed chemical hypoxia mimicry by means of cobalt chloride added to culture media; this has been known to interfere with oxygen-dependent cell signaling pathways [see, e.g. (34)].
MATERIALS AND METHODS
Cell Culture
B16(F10) melanoma cells obtained from ATCC (American Type Culture Collection) were cultured in RPMI medium supplemented with 10% heat-inactivated fetal bovine serum (ICN) and maintained in a humidified incubator (37°C, 5% CO2, 21% O2). Upon reaching 70–80% confluence, the cell cultures were exposed to hypoxic conditions in the Billups-Roth-enberg chamber (nominal 1% O2, 5% CO2, 94% N2) or an oxygen flow-regulated (referred to as O2-regu-lated) incubator (Jouan) with controlled gas flow (1% O2, 5% CO2, 94% N2). The O2-regulated incubator experiment was repeated twice. Alternatively, CoCl2 (f.c. 100 or 200 μM) was added to cell culture medium. The exposure was maintained for 24 h. Each experiment was performed in triplicate (hypoxia samples) or duplicate (CoCl2 and control samples).
Isolation of RNA From Cell Culture
Total RNA was isolated using the RNeasy Mini Kit (Qiagen, Hilden, Germany), followed by DNaseI (Qiagen) digestion and repurification (RNA clean-up protocol). The quantity of isolated RNA was estimated spectrophotometrically by measuring absorbance at 260 nm. RNA quality was assessed by 1.2% agarose gel electrophoresis.
cRNA Synthesis and Hybridization to Microarrays
All procedures were performed according to the manufacturer’s instructions (Affymetrix, Santa Clara, CA). Total RNA (8 μg) from each sample was used as a template for cDNA and subsequent cRNA syntheses. Fragmented cRNA was hybridized to murine oligonucleotide GeneChip MG-U74Av2 microarrays (Affymetrix). Arrays were scanned by Hewlett-Packard GeneArray G2500A scanner with MAS5 software (Affymetrix).
Statistical Comparison of Gene Expression Levels
The preprocessing of data was carried out by Robust MultiArray Analysis (RMA) using the Biocon-ductor Affy package (8). Statistical comparisons were performed by GeneSpring 7.2 (Silicon Genetics, Redwood City, CA). Welch t-test was used and both Family-Wise Error Rate (Westfall-Young algorithm) and False Discovery Rate (Benjamini-Hochberg method) were calculated. An alternative method of gene selection, limma (38), based on moderated Bayesian t-statistic was applied, also providing False Discovery Rate estimation by Benjamini-Hochberg method. Hierarchical clustering was done in Gene Spring software by centroid clustering referred to as the “average-linkage” method, with Pearson correlation around zero as the distance metric.
Singular Value Decomposition
Singular Value Decomposition (SVD)-based algorithm was applied as an unsupervised tool for analyzing the major sources of variability in the dataset. The algorithm of matrix decomposition was used to obtain orthogonal vectors called characteristic modes. Each mode represents major independent and uncorrelated variability patterns in the analyzed data. For the obtained mode profiles, genes that bore greatest similarity to each expression pattern were selected, as described previously (20,36). The whole procedure was carried out using MATLAB (MathWorks, Natick, MA) on the dataset preprocessed by RMA and column- and row-normalized (subtraction of mean and division by standard deviation).
Gene Ontology Analysis
Biological relevance of the obtained gene sets was analyzed by Gene Ontology classification. GOHyperG Bioconductor package (9) was used to select GO classes that were significantly overrepresented in the analyzed gene lists, based on hypergeometric distribution. As the obtained results were not corrected for multiple comparisons, only those with a p-value lower than 0.005 were interpreted as statistically significant.
Real-Time Quantitative PCR Validation of Microarray Data
The sequences for chosen murine genes were blasted against the murine genome and intron–exon boundaries spanning primers were designed. The following genes were analyzed: galectin 3 (Lgals3, F- ccattcaaaatacaagtcctggttg, R- ccgccccttctggcttagat), vinculin (Vcl, F- agcaggccacagagatgctg, R- ccagcca gatttgacgaggtg), adrenomedullin (Adm, F- ggcgctaag tcgtgggaaga, R- cttcgctctgattgctggcttg), natriuretic brain peptide (Nppb, F- ggcctcacaaaagaacacccaaa, R-ttcctacaacaacttcagtgcgttac). As a reference, gene encoding prolyl 4-hydroxylase, beta polypeptide (P4hb, F- aagtgcagacagaacggtcattg, R- gatcgtcgtcttcctccatgtc) was used. Expression of this gene had been confirmed by microarray data analysis as having low variance and showing no differences between hyp-oxic and control samples (data not shown). Analysis was performed using nine hypoxic and six control samples (from “true hypoxia” experiments). Real-time PCR was performed with detection of transcripts by SYBR Green, using one-step MasterAmp Kit (Epicentre). The reactions were carried out using ABI Prism 7700 (Applied Biosystems) in 20 ml volume containing 0.04 mM forward and reverse primers and 50 ng of total RNA. The cycling conditions were: 60°C for 30 min initial denaturation, followed by 40 cycles of 95°C for 30 s, 52°C for 30 s, and 72°C for 30 s. Reactions were performed in duplicate. Expression of the examined genes was normalized to that of reference gene (P4hb).
RESULTS
Preliminary Analysis of Hypoxia Data
Three methods to achieve hypoxic conditions in cell culture vessels were used (see Materials and Methods). First we confirmed the reliability of our experiments by performing hierarchical clustering of the obtained samples, based on known hypoxia-regulated genes (see Fig. A, Web Appendix, http://www.genomika.pl/cancerbiology/hypoxia). We further compared gene expression in hypoxic samples with that in control ones using 1) fold-change approach, 2) Welch t-test with False Discovery Rate estimation (FDR), and 3) a linear model with Bayesian moderated t-statistic (limma). Each method yielded large, but slightly different, sets of genes (Table 1). The lists were overlapping to a great extent, especially for three “true hypoxia” experiments and for two CoCl2 concentrations used.
TABLE 1.
GENES DIFFERENTIATING BETWEEN HYPOXIC AND CONTROL SAMPLES
| True Hypoxia | Hypoxia Mimicry | ||||
|---|---|---|---|---|---|
| O2-Regulated Incubator 1 (n = 5) | O2-Regulated Incubator 2 (n = 5) | Billups-Rothenberg Chamber (n = 5) | |||
| 100 μM Cobalt Chloride (n = 4)* | 200 μM Cobalt Chloride (n = 4)* | ||||
| Twofold change | 169/70 | 168/46 | 123/147 | 236/713 | 311/705 |
| Fourfold change | 36/1 | 40/0 | 27/0 | 44/116 | 56/117 |
| FDR <5% (limma) | 781/1036 | 737/750 | 759/1427 | 1983/2116 | 2190/2286 |
| Twofold change (mean) | 145/56 | 196/667 | |||
| FDR <5% (Welch test) | 1016/1525 | 105/259† | |||
Probesets were selected by fold-change criterion (two- or fourfold, mean fold change was calculated either in each experiment separately or for three “true hypoxia” and two hypoxia mimicry experiments) or by statistical selection (limma, Bayesian moderated t-statistic for each experiment or classic Welch t-test for larger groups). False Discovery Rate (FDR) was estimated by Benjamini-Hochberg method. Numbers of probesets satisfying the criteria are given as “upregulated/downregulated.”
Two samples treated with 100 μM CoCl2 and two treated with 200 μM CoCl2 were compared to common controls (two samples).
Relatively low number of genes due to small number of samples compared.
Pattern Discovery by Singular Value Decomposition
There were two main sources of variance in the performed experiments: effect of treatment (hypoxia vs. normoxia) and different means of inducing hypoxia (regulated or nominal 1% oxygen vs. chemical hypoxia mimicry). We used SVD method to delineate the experimental groups and compare the effect of hypoxia with commonly used methods of its induction. Samples clustered into distinct subclasses, which mainly represented the two mentioned sources of variance (Fig. 1). Using an SVD algorithm, we carried out unsupervised gene selection to extract probesets representing all major patterns of variability. The genes with expression profile similar to the first four SVD modes were used for hierarchical clustering of the samples (Fig. 2).
Figure 1.
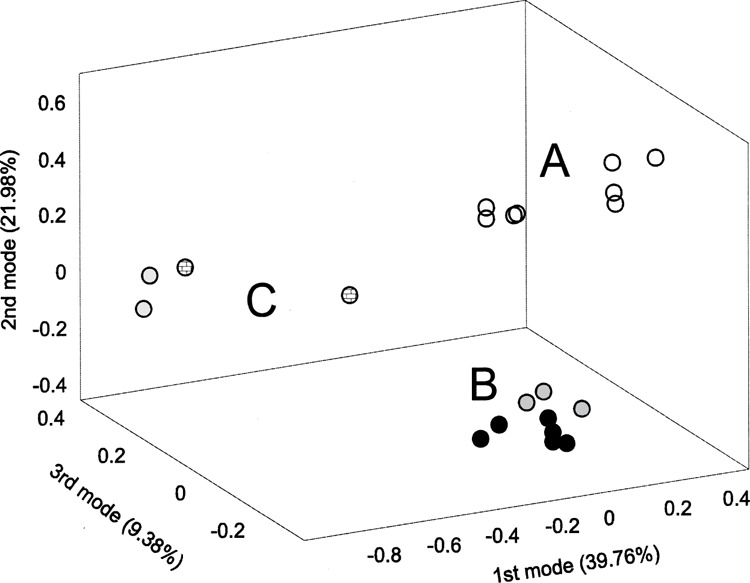
Singular Value Decomposition analysis of samples. The unsupervised analysis revealed distinct differences between control and treated samples (first principal component, 39.76% of variance) and showed other subdivisions between samples, mainly related to CoCl2 versus “true hypoxia” difference. A: control samples (open circles); B: “true hypoxia” samples (black circles: O2-regulated incubator samples; dark gray circles; Billups-Rothenberg chamber samples); C: cobalt chloride samples (light gray circles: 100 μM CoCl2 samples; checkered circles: 200 μM CoCl2 samples).
Figure 2.
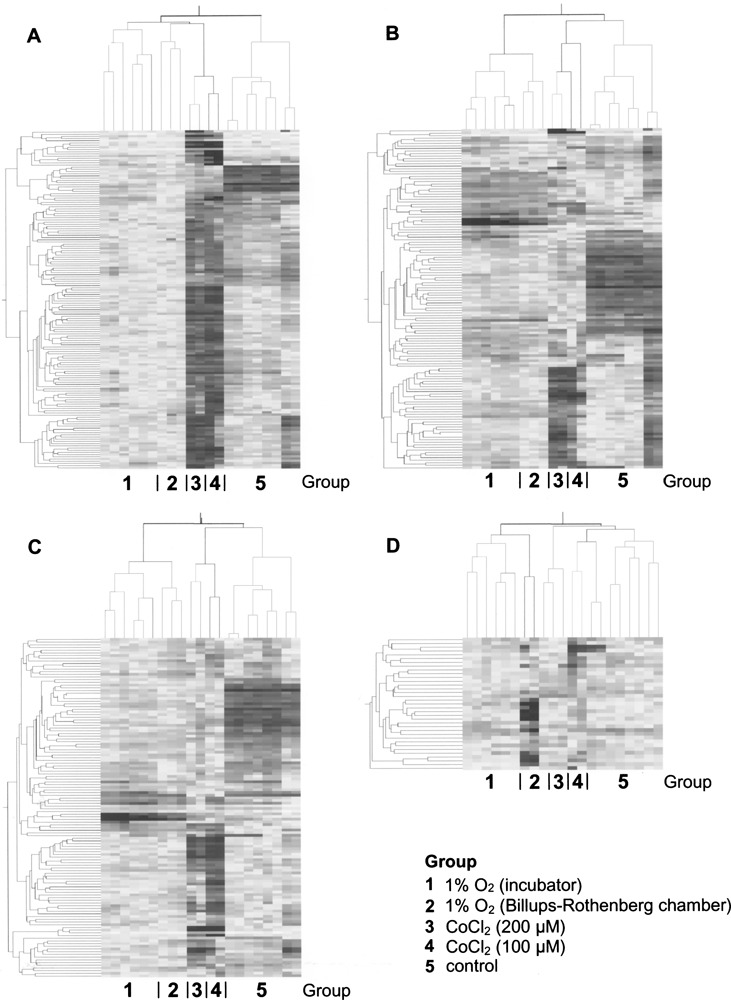
Hierarchical clustering of samples. The genes with expression profile similar to the first four SVD modes were used. The analysis revealed several different patterns of variability within analyzed samples. (A) First mode: control and treated samples show subdivision into two distinct branches. (B) Second mode: CoCl2-treated samples cocluster with controls. (C) Third mode: pattern of clustering similar to that of the second mode. (D) Fourth mode: O2-regulated incubator samples and 200 μM CoCl2 samples cluster into distinct branches.
For the first three modes we obtained more than 100 probesets per mode (154, 134, and 125, respectively) whereas for the fourth mode 35 probesets were selected. The first mode Z genes subdivided treated samples (1% O2 and CoCl2) from controls, confirming that hypoxia was the strongest factor influencing gene expression in the analyzed dataset (see Fig. 2A). The second mode classified “true hypoxia” samples together with control ones versus CoCl2-treated samples (Fig. 2B). This indicated that there was a considerable difference between “true hypoxia” and hypoxia mimicry-induced expression profiles. The third mode genes showed the same classification of samples as the second mode probesets but with different pattern of gene expression (Fig. 2C). The fourth mode subdivided samples into two groups: one including O2-regulated incubator samples together with those exposed to 200 μM CoCl2 and the other containing controls, Billups-Rothenberg chamber samples, and those exposed to 100 μM CoCl2 (Fig. 2D). In summary, SVD analysis confirmed that the difference between hypoxic and control samples was the strongest source of variance in our dataset; it also indicated that gene expression profile induced by hypoxia mimicry differs from that obtained under “true” hypoxic conditions.
Difference Between True Hypoxia and Hypoxia Mimicry
The unsupervised analysis (Figs. 1 and 2) indicated distinct differences in gene expression profile between “true” hypoxia-exposed and cobalt chloride-treated cells.
We decided to compare all experimental datasets to identify genes that were shared and those that were unique for true hypoxia or hypoxia mimicry. We compared the individual gene lists obtained from treated versus control comparison for each experiment (five in total, see Table 1). The analysis was limited to 1000 highest rank probesets (all of them were significant, with FDR <5%) selected by limma method. There were 203 transcripts common to all five sets, 414 genes specific only for “true hypoxia” experiments (not occurring in any of the CoCl2 lists), and 219 genes present in hypoxia mimicry comparisons while absent from “true hypoxia” experiments. The results of the analysis are shown in the Web Appendix (Table B). The first gene group comprised genes regulated by HIF-1 transcription factor (e.g., Vegfa, Bnip3, P4ha2, Slc2a1). We found some important genes to be differentially regulated in hypoxia-exposed and cobalt-treated cells. These were Itga4, Anxa1, and Mitf, which were upregulated by true hypoxia while downregulated by cobalt ions.
To understand the biological impact of the observed effects of true hypoxia and hypoxia mimicry we performed ontology comparison of respective gene lists: exclusive for “true hypoxia” (414 genes, see above) and exclusive for cobalt chloride (219 probesets) (see Table B, Web Appendix). True hypoxia significantly upregulated 29 gene groups associated mainly with glycolysis, migration, adhesion, MAPK activity, and others. The gene groups upregulated by cobalt chloride were much less numerous and were affiliated with immune response (antigen presentation, see Table C, Web Appendix). The analysis of downregulated genes revealed one GO class significantly suppressed by true hypoxia (dicarboxylic acid transport) and 51 gene groups affected by cobalt chloride. They were related mainly to: proliferation (e.g., cell cycle, mitosis, DNA metabolism), DNA repair, and protein modifications (see Table C, Web Appendix). To sum up, gene ontology-based differentiation between “true hypoxia” and hypoxia mimicry revealed many crucial gene groups upregulated only by true hypoxia. Cobalt ions, on the other hand, significantly suppressed transcription of genes involved in proliferation, DNA repair, and protein modification; similar suppression was not observed to such an extent under true hypoxia.
Hypoxia-Regulated Genes in B16(F10) Murine Melanoma Cells
Due to the pattern of observed differences between cobalt and true hypoxia datasets we restricted further analysis to the latter. Stringent Family-Wise Error Rate estimation selected 454 probesets differentiating between hypoxic and normoxic samples. Within this list 216 transcripts were upregulated (three genes upregulated more than 10-fold and 99 probesets with fold change >2), while 238 were downregulated (most suppressed Sfrs1 with 3.5-fold change and 37 probesets with fold change >2) (Table 2). Among the upregulated transcripts there were known hypoxia-responsive genes (Vegfa, Adm, Lgals3, Bnip3, Pfkp) as well as genes that, to our knowledge, were not reported as hypoxia related (e.g., Itpk1, Kctd12, Nme1, Selenbp1). The full list is presented in the Web Appendix (Table A). To validate our microarray data, the expression of four selected genes that have not been reported previously in melanoma as hypoxia associated was evaluated by quantitative RT-PCR (Q-PCR). These were genes coding for: galectin-3, vin-culin, natriuretic brain peptide, and adrenomedullin. The Q-PCR results were in agreement with microarray data, although the respective fold-changes were much higher (Table 3).
TABLE 2.
TRUE HYPOXIA-REGULATED GENES IN B16(F10) MURINE MELANOMA CELL LINE
| Affymetrix Probeset ID | Gene Symbol | Gene Name | Fold-Change (Hypoxia vs. Control) |
|---|---|---|---|
| Top 20 upregulated probesets | |||
| 95706_at | Lgals3 | lectin, galactose binding, soluble 3 | 19.41 |
| 100596_at | Selenbpl* | selenium binding protein 1 | 13.65 |
| 104184_at | Nppb | mouse BNP gene for brain natriuretic peptide, complete cds. | 13.08 |
| 98478_at | Ccng2 | cyclin G2 | 7.985 |
| 93294_at | Ctgf | connective tissue growth factor | 7.468 |
| 104337_f_at | Pkp2 | plakophilin 2 | 6.967 |
| 97834_g_at | Pfkp | phosphofructokinase, platelet | 6.943 |
| 93836_at | Bnip3 | BCL2/adenovirus E1B 19 kDa-interacting protein 1, NIP3 | 6.936 |
| 103520_at | Vegfa | vascular endothelial growth factor A | 6.138 |
| 102798_at | Adm | adrenomedullin | 6.023 |
| 160495_at | Ahr | aryl-hydrocarbon receptor | 5.765 |
| 94004_at | Cnn2 | calponin 2 | 5.528 |
| 104338_r_at | Pkp2 | plakophilin 2 | 5.442 |
| 93738_at | Slc2al | solute carrier family 2 (facilitated glucose transporter), member 1 | 5.364 |
| 10155l_s_at | Tes | testis derived transcript | 5.151 |
| 98496_at | Gys3 | glycogen synthase 3, brain | 5.134 |
| 96803_at | Gbel | glucan (1,4-alpha-), branching enzyme 1 | 5.016 |
| 104701_at | Bhlhb2 | basic helix–loop–helix domain containing, class B2 | 4.742 |
| 100509_at | Rnfl9* | ring finger protein (C3HC4 type) 19 | 4.64 |
| 97870_s_at | Eroll | EROl-like (S. cerevisiae) | 4.416 |
| Top 20 downregulated probesets | |||
| 104586_at | Sfrsl | splicing factor, arginine/serine-rich 1 (ASF/SF2) | 0.282 |
| 103821_at | Cdc6 | cell division cycle 6 homolog (S. cerevisiae) | 0.3 |
| 95063_at | Cdca7* | cell division cycle associated 7 | 0.34 |
| 97445_at | Ppid* | peptidylprolyl isomerase D (cyclophilin D) | 0.34 |
| 103412_at | 3732412D22Rik | RIKEN cDNA 3732412D22 gene | 0.34 |
| 103922_f_at | Cyb5rl | cytochrome b5 reductase 1 | 0.38 |
| 94340_at | 1110004L07Rik | exportin, tRNA (nuclear export receptor for tRNAs) | 0.39 |
| 97538_at | Gus | beta-glucuronidase | 0.4 |
| 93320_at | Cptla | carnitine palmitoyltransferase 1a, liver | 0.41 |
| 103665_at | Elovl6* | ELOVL family member 6, elongation of long chain fatty acids (yeast) | 0.42 |
| 95135_at | Midlipl | Mid1 interacting protein 1 (gastrulation specific G12-like (zebrafish)) | 0.42 |
| 92582_at | Slcla5* | solute carrier family 1 (neutral amino acid transporter), member 5 | 0.42 |
| 93237_s_at | Tyms-ps* | thymidylate synthase | 0.425 |
| 160878_at | Bopl* | block of proliferation 1 | 0.43 |
| 95462_at | Bzw2 | basic leucine zipper and W2 domains 2 | 0.44 |
| 99620_at | Sfpq* | splicing factor proline/glutamine rich (polypyrimidine tract binding protein associated) | 0.44 |
| 103619_a | Cyb5b | cytochrome b5 type B | 0.45 |
| 96340_at | Tmem50b | transmembrane protein 50B | 0.45 |
| 100026_at | Bcatl* | branched chain aminotransferase 1, cytosolic | 0.45 |
| 160723_at | 1500001M20Rik | RIKEN cDNA 1500001M20 gene | 0.46 |
Genes selected by comparing the “true hypoxia” group to control samples (FWER < 0.05, Westfall-Young algorithm). Only the genes with the highest fold-change are shown (full list available in the Web Appendix, Table A).
Genes not previously associated with hypoxia.
TABLE 3.
QUANTITATIVE REAL-TIME PCR VALIDATION OF MICROARRAY RESULTS
| Gene | Mean Hypoxia | Mean Control | p-Value | Fold-Change |
|---|---|---|---|---|
| Adm | 54.98 | 0.27 | p < 0.005 | 206.4 |
| Lgals3 | 57.87 | 0.52 | p < 0.005 | 112.2 |
| Nppb | 138.26 | 1.48 | p < 0.005 | 93.2 |
| Vcl (selected by limma method) | 16.09 | 1.15 | p < 0.005 | 14.0 |
Expression of the four genes chosen from the examined microarray datasets was normalized to that of the reference gene (P4hb). The statistical significance of results was assessed using Kolmogorov-Smirnov test.
To bring out biological role of the selected transcripts gene ontology analysis was performed. The most overrepresented ontology class among the upreg-ulated genes was energy derivation by oxidation of organic compounds. This class was mainly represented by glycolytic transcripts (e.g., Pfkp, Hk2, Aldo3, Eno2), but also comprised genes regulating glycogen metabolism (Gys3, Gbe1) and gluconeogenesis (Gpi1). Highly upregulated was peptidyl-amino acids modifications class including known hypoxia-regulated transcripts P4ha1 and P4ha2 (6,11, 17). Significant upregulation was also observed for regulation of apoptosis, antigen presentation, and regulation of transcription and rhythmic processes (Table 4). Regulation of apoptosis class included both negative (Vegfa, Cdkn1a, Bcl2l1, Bcl2) and positive (Bnip3, Bnip3l, Bnip1, Jun) regulators. The immune response genes (antigen presentation) were represented by MHC class I transcripts (H2-Bl, H2-D1, H2-K1). Highly overexpressed within the regulation of transcription class were negative regulators: Bhlhb2, Sap30, hypoxia induced in fibroblast cells (22), and Mxi1, retrievable from other hypoxia studies (4,6,43,46). We also noted the upregulation of Ahr, Atf3, Stat3, and Mitf (a cell-specific transcription regulator). GO classes associated with tissue remodeling (migration, adhesion, motility) and angio-genesis did not meet, as a whole, the significance criteria applied in this study, but among genes making up those classes there were highly upregulated transcripts such as Lgals3, Ctgf, Adm, Cnn2, Vegfa, or Anxa2.
TABLE 4.
ONTOLOGY CLASSES REGULATED BY TRUE HYPOXIA
| Gene Ontology ID | Name | Number of Probesets | p-Value |
|---|---|---|---|
| Upregulated genes | |||
| GO:0006096 | glycolysis | 9 | 1.52E-08 |
| GO:0015980 | energy derivation by oxidation of organic compounds | 13 | 4.65E-08 |
| GO:0019320 | hexose catabolism | 9 | 1.01E-07 |
| GO:0042981 | regulation of apoptosis | 12 | 0.0001 |
| GO:0006915 | apoptosis | 15 | 0.0006 |
| GO:0019883 | antigen presentation, endogenous antigen | 3 | 0.001 |
| GO:0043066 | negative regulation of apoptosis | 6 | 0.001 |
| GO:0018401 | peptidyl-proline hydroxylation to 4-hydroxy-L-proline | 2 | 0.001 |
| GO:0018193 | peptidyl-amino acid modification | 5 | 0.003 |
| GO:0006357 | regulation of transcription from RNA polymerase II promoter | 10 | 0.003 |
| GO:0048511 | rhythmic process | 4 | 0.004 |
| GO:0046777 | autophosphorylation | 3 | 0.004 |
| GO:0016540 | protein autoprocessing | 3 | 0.004 |
| Downregulated genes | |||
| GO:0009069 | serine family amino acid metabolism | 5 | 1.53E-05 |
| GO:000625 | DNA metabolism | 21 | 4.77E-05 |
| GO:0006220 | pyrimidine nucleotide metabolism | 5 | 4.85E-05 |
| GO:0006260 | DNA replication | 10 | 6.83E-05 |
| GO:0044237 | cellular metabolism | 120 | 7.06E-05 |
| GO:0006396 | RNA processing | 15 | 7.57E-05 |
| GO:0000398 | nuclear mRNA splicing, via spliceosome | 10 | 0.0001 |
| GO:0006461 | protein complex assembly | 8 | 0.0002 |
| GO:0006544 | glycine metabolism | 3 | 0.0004 |
| GO:0016070 | RNA metabolism | 16 | 0.0004 |
| GO:0006519 | amino acid and derivative metabolism | 13 | 0.0004 |
| GO:0009063 | amino acid catabolism | 5 | 0.0005 |
| GO:0006397 | mRNA processing | 11 | 0.0006 |
| GO:0006281 | DNA repair | 9 | 0.001 |
| GO:0008295 | spermidine biosynthesis | 2 | 0.002 |
| GO:0016478 | negative regulation of translation | 2 | 0.002 |
| GO:0009058 | biosynthesis | 30 | 0.003 |
| GO:0019752 | carboxylic acid metabolism | 15 | 0.003 |
| GO:0006974 | response to DNA damage stimulus | 9 | 0.004 |
| GO:0045454 | cell redox homeostasis | 2 | 0.004 |
| GO:0007098 | centrosome cycle | 2 | 0.004 |
| GO:0009071 | serine family amino acid catabolism | 2 | 0.004 |
Gene ontology analysis of transcripts differentiating “true hypoxia” samples from control ones (454 genes with FWER < 0.05). Only chosen ontology groups are presented from among all significantly upregulated or downregulated classes (p < 0.005, see Materials and Methods).
Genes significantly downregulated under hypoxic conditions are linked to protein and amino acid metabolism (serine family amino acid metabolism, glycine metabolism, negative regulation of translation, protein complex assembly) as well as nucleotide and DNA metabolism, including DNA replication and DNA repair classes (Table 4). Within the latter group there were transcripts that had already been reported (Brca1 (1), Msh2 (41), Apex1 (52) or not (H2afx, Rfc5, Sfpq, Prp19) as hypoxia related. Our results show that the response to hypoxia in B16(F10) cell cultures involves common low oxygen-responsive functional categories such as metabolism, proliferation, apoptosis, regulation of transcription and also, though to a lesser extent, motility/migration, adhesion and angiogenesis. They also reveal involvement of processes that are not typically associated with hypoxia, such as antigen presentation or biosynthesis of biogenic amines (e.g., spermidine).
DISCUSSION
Comparison of Hypoxia With Cobalt Chloride
The aim of our study was to analyze gene expression profile of B16(F10) melanoma cells that had been exposed to “true” hypoxic conditions (1% O2) or hypoxia mimicry (CoCl2). The unsupervised data analysis has clearly demonstrated differences between expression profiles induced by true hypoxia (1% oxygen) and hypoxia mimicry (cobalt chloride). This effect was previously described by Vengellur et al. (43) for hepatocarcinoma (HepG2) cells. The authors suggested that similarity between hypoxia and hypoxia mimicry effects pertained mainly to the altered expression of glycolytic, apoptotic, and hydroxylase genes, which we also observed in our study. Among transcripts in question there are known HIF-1-induced genes (see Table B, Web Appendix), which supports the previously reached conclusion that mimicry of hypoxia response by cobalt ions is HIF-1 dependent (34). The differences observed by us suggest that, compared to true hypoxia, cobalt ions exert more antiproliferative and promutagenic effects as well as cause stronger suppression of glycoprotein metabolism and melanin biosynthesis. True hypoxia, on the contrary, seems to have a more pronounced effect on glycolysis, migration, adhesion, and MAPK activity. Thus, it seems that use of cobalt as hypoxia mimicker should be confined only to experiments investigating HIF-1 signaling pathways. Caution is suggested when interpreting cobalt-induced hypoxia results in the context of tumor environment or results obtained in whole genome profiling studies.
Biological Significance of Selected Genes
We selected 454 probesets differentiating between hypoxia- and normoxia-exposed B16(F10) cells. Among them there are known hypoxia-regulated genes such as Vegfa, Glut1, Bnip3, Adm, Lgals3, P4ha1, Mxi1, Hk2, Ndrg1, and others. Some of our selected genes have already been reported to be hypoxia regulated in melanoma cells. These are Cyr61 (selected by limma method) and VEGF. The first one was described as angiogenic factor constitutively expressed in highly metastatic melanoma cell lines (23). VEGF expression was upregulated in WM35 cells under hypoxic conditions (37). Its expression correlates also with melanoma growth and survival in vitro (12) as well as high tumor thickness (31).
Low oxygen tension enhances metastatic potential of B16(F10) murine melanoma cells in vivo (30). It also promotes lymph node metastases in human melanoma xenografts (33). We selected genes previously reported as related to melanoma progression, and because hypoxia was proved to induce melanoma aggressiveness this may suggest their association with hypoxia in vivo. The genes in question are galectin 3 (Lgals3), transcription factors Mitf and Stat3, melanoma cell adhesion molecule (Mcam/Muc18), and Nme1. Lgals3 was the most overexpressed gene in our study with 19-fold change (expression increase by Q-PCR was more than 100-fold). This would suggest that this protein is a strong survival factor in melanoma cells. Expression of galectin-3 in melanoma was shown to be higher in thin melanoma lesions than in benign nevi (44), and its elevated serum level was observed in patients with advanced disease (45). Galectin-3 regulates migration and adhesion; it also has antiapoptotic and proangiogenic activities. Due to its multiple functions, Lgals3 seems to be a very good therapeutic target in malignant melanoma. Mcam is known to promote melanoma progression. Its expression was shown to correlate with metastatic potential of mouse melanoma cell lines (51) and melanoma patient survival (29). No reports of its regulation by hypoxia have been published so far. Mitf gene was proposed as a survival oncogene amplified in malignant melanoma (7) and its downregulation was associated with sensitivity of melanoma cells to INF-γ therapy (10). The role of Mitf in melanoma progression is further indicated by a finding that the expression of gene encoding a Mitf expression inhibitor (EMX2) correlated with longer metastasis-free survival (48). Activity of Stat3, in turn, contributed to breast cancer cells’ resistance to apoptosis and correlated with patients’ resistance to chemotherapy (13). This appears interesting in the context of hypoxia-induced resistance to various therapeutic modalities. Activated Stat3 was also proved to promote melanoma brain metastasis (50). Contribution of hypoxia to prometastatic phenotype of melanoma seems to be supported also by our data concerning downregulation of the known metastatic suppressor gene Nme1. High level of the protein encoded by this gene was associated with decreased metastatic potential of melanoma cells (14). To our knowledge, this is the first report of its association with hypoxia. Due to their biological function and previously established link to cancer, the described genes seem to merit further validation. However, the results of Ord et al. indicate that in vivo validation of the hypoxia results obtained in vitro is more likely for highly changed genes than for genes with lower fold change (28). The most upregulated genes in our study were galectin 3, selenium binding protein 1 (Selenbp1), and brain natriuretic peptide (Nppb). Selenbp1 was not correlated with hypoxic stimulus before, whereas in our dataset its expression under hypoxic conditions is 13 times higher than under normoxia. This may indicate its possible role in attenuating adverse effects of reactive oxygen species (by binding selenium, a known antioxidant) produced under hypoxic conditions. Reduced expression of selenium binding protein 1 was found correlated with poor outcome in patients with lung adenocarcinoma (3) and ovarian cancer (18). Highly expressed in our dataset also were adrenomedullin (Adm), a potent angiogenic factor expressed in many cancers (5), as well as Ctgf, frequently associated with various cancer types [see, e.g. (25,49)]. These genes, in our opinion, seem to particularly merit further validation.
Our results may also indicate a possible hypoxia-responsive enhancement mechanism in B16(F10) involving Ilk, Mitf, and Stat3 genes. Mitf was reported to stimulate HIF-1α gene expression in B16(F10) melanoma cells (2), and Ilk was shown to stimulate HIF-1α expression in prostate cancer cells (40). In our study these genes were upregulated (1.9-fold change for Ilk, 2-fold for Mitf, and 1.6-fold for Stat3). This could possibly indicate the existence of a positive feedback mechanism enhancing hypoxia response, especially if these genes are also HIF-1 regulated. Stat3 has already been proved to be activated under hypoxic conditions and, at the same time, stabilize HIF-1α in renal carcinoma cells (21).
Molecular Signature of Hypoxia
Previous studies have shown significant heterogeneity in hypoxia response among various cell lines (4,6). Here, we present analysis of hypoxia impact on transcription in B16(F10) murine melanoma cells and compare our results with those obtained using similar experimental approaches, but different cell lines (4,6,11,43). For comparison purposes we analyzed, using our experimental data, the hypoxia signatures derived by Greijer et al. [(11), Tables 1 and 2] and Vengellur et al. [(43), Supplemental Table]. The former authors specified 103 hypoxia-responsive genes in murine fibroblasts. Thirty-eight genes from that signature were also differentially expressed in our experiments (13 out of them are present in our list of 454 selected transcripts; see Table A, Web Appendix). They are responsible for known hypoxia-responsive processes such as glycolysis (e.g., Aldo3, Pfkp, Gpi1, and Hk2), oxydoreductive processes (Grhpr, P4ha2, and Egln1), apoptosis (including most overexpressed genes in our study: Lgals3 and Bnip3), protein transport (Kdelr3), and signal transduction (Wsb1, Rock2). The similarity between Greijer’s results and ours extends also to the expression of prolyl hydroxylases and genes associated with cytoskeleton organization, although a differing set of the latter class of transcripts was obtained. In turn, 57 genes from hypoxia signature obtained by Vengellur et al. (43) for Hep3B cell line were also differentially expressed in our experiments (11 genes common with our initial list of 454 selected transcripts). The genes in question are involved in glycolysis (Ldh1, Aldo1), cell cycle regulation (Tfdp1, Rfc3), apoptosis (Bnip3, Bnip3l, Jun), protein biosynthesis (Mrps11, Mrps12), protein metabolism (P4ha1, Uchl1), and protein folding (Dnaja1, Bag2, Abce1) (see Table D, Web Appendix). We also compared directly our results with those of Denko et al. (7) and Chi et al. (4). The results are shown in Table 5.
TABLE 5.
EXPRESSION OF CHOSEN HYPOXIA-REGULATED GENES IN VARIOUS HYPOXIA STUDIES
| Gene | Present Study (Fold-Change) | Greijer et al. (11) (Fold-Change) | Vengellur et al. (43) (Fold-Change) | Denko et al. (6) (Present/Absent) | Chi et al. (4) (Present/Absent) |
|---|---|---|---|---|---|
| Vegfa | 6 | 1.2 | 5 | − | − |
| Glut1 | 5.4 | NS | NS | + | + |
| P4ha1 | 2.4 | NS | 3.2 | − | + |
| P4ha2 | 3.4 | NS | NS | − | + |
| Bnip3 | 6.9 | 4.8 | 4.4 | BNIP3L* | BNIP3L* |
| Ndrg1 | 3.1 | 3.2 | 78 | + | + |
| Wsb1 | 2 | −2.4 | 3.9 | − | − |
| Aldo1 | NS | 3.2 | 2.5 | + | − |
| Aldo3 | 3.7 | 3.1 | NS | + | − |
| p21 | 4 | NS | NS | + | − |
| Mxi1 | 3.6 | NS | NS | + | + |
| Pfkp | 5 | 4.5 | NS | PFK† | + |
| Adm | 6 | NS | 6.8 | − | + |
| Epo | NS | NS | NS | − | − |
| NO2 | NS | NS | NS | − | − |
| Ccng2 | 8 | NS | NS | + | − |
| Gbe1 | 5 | NS | NS | − | − |
| Gys3 | 5.1 | 2.3 | NS | − | − |
| Ldh1 | NS | 3.4 | 2 | + | + |
| Eno1 | Eno2† | 2.3 | NS | Eno3† | − |
| HIG1 | 3.3 | 3.2 | NS | − | − |
| PAI1 | NS | NS | 14.2 | − | − |
NS: not significant.
Functional homolog of Bnip3.
Cell type-specific isoenzyme.
It appears that, despite common cellular functions modulated by hypoxia as well as some overlapping of transcripts, differences in hypoxia response between cell lines may be more significant than similarities. Moreover, expression of hypoxia markers may vary depending on pH and actual oxygen concentration (39). Also, methodology of studies as well as specific cell lines used (even of similar anatomical origin) affect final results (42). This may help explain why no reliable hypoxia markers have been found so far. It seems that only sets of genes (signatures) regulated by hypoxia in a particular cancer type are likely to be relatively reliable indicators of hypoxic state. Chi et al. (4) have shown that a set of 168 genes induced by hypoxia in several epithelial cell lines properly classifies clinical material according to high or low hypoxia response; this signature has also correlated with patients’ survival. It seems warranted, therefore, to investigate hypoxia response in at least tissue-specific context and validate the expression of selected genes in clinical material.
ACKNOWLEDGMENTS
The authors are grateful to Dr. Ewa Stępień (Laboratory for Molecular Cardiology, John Paul II Hospital, Cracow) and Dr. Józef Dulak (Faculty of Biotechnology, Jagiellonian University, Cracow) for their valuable help with the hypoxia experiments. The authors would also like to thank Prof. B. Jarzb for critical remarks. This study was supported by a commissioned grant from the State Committee for Scientific Research (PBZ/KBN/040/P04/2001).
REFERENCES
- 1. Bindra R. S.; Gibson S. L.; Meng A.; Westermark U.; Jasin M.; Pierce A. J.; Bristow R. G.; Classon M. K.; Glazer P. M. Hypoxia-induced down-regulation of BRCA1 expression by E2Fs. Cancer Res. 65:11597–11604; 2005. [DOI] [PubMed] [Google Scholar]
- 2. Buscà R.; Berra E.; Gaggioli C.; Khaled M.; Bille K.; Marchetti B.; Thyss R.; Fitsialos G.; Larriberè L.; Bertolotto C.; Virolle T.; Barbry P.; Pouyssegur J.; Ponzio G.; Ballotti R. Hypoxia-inducible factor 1{alpha} is a new target of microphthalmia-associated transcription factor (MITF) in melanoma cells. J. Cell Biol. 170:49–59; 2005. [DOI] [PMC free article] [PubMed] [Google Scholar]
- 3. Chen G.; Wang H.; Miller C. T.; Thomas D. G.; Gharib T. G.; Misek D. E.; Giordano T. J.; Orringer M. B.; Hanash S. M.; Beer D. G. Reduced selenium-binding protein 1 expression is associated with poor outcome in lung adenocarcinomas. J. Pathol. 202:321–329; 2004. [DOI] [PubMed] [Google Scholar]
- 4. Chi J. T.; Wang Z.; Nuyten D. S.; Rodriguez E. H.; Schaner M. E.; Salim A.; Wang Y.; Kristensen G. B.; Helland A.; Børresen-Dale A. L.; Giaccia A.; Longaker M. T.; Hastie T.; Yang G. P.; Vijver M. J.; Brown P. O. Gene expression programs in response to hypoxia: Cell type specificity and prognostic significance in human cancers. PloS Med. 24(3):e47; 2006. [DOI] [PMC free article] [PubMed] [Google Scholar]
- 5. Cuttitta F.; Pio R.; Garayoa M.; Zudaire E.; Julian M.; Elsasser T. H.; Montuenga L. M.; Martinez A. Adrenomedullin functions as an important tumor survival factor in human carcinogenesis. Microsc. Res. Tech. 57:110–119; 2002. [DOI] [PubMed] [Google Scholar]
- 6. Denko N. C.; Fontana L. A.; Hudson K. M.; Sutphin P. D.; Raychaudhuri S.; Altman R.; Giaccia A. J. Investigating hypoxic tumor physiology through gene expression patterns. Oncogene 22:5907–5914; 2003. [DOI] [PubMed] [Google Scholar]
- 7. Garraway L. A.; Widlund H. R.; Rubin M. A.; Getz G.; Berger A. J.; Ramaswamy S.; Beroukhim R.; Milner D. A.; Granter S. R.; Du J.; Lee C.; Wagner S. N.; Li C.; Golub T. R.; Rimm D. L.; Meyerson M. L.; Fisher D. E.; Sellers W. R. Integrative genomic analyses identify MITF as a lineage survival oncogene amplified in malignant melanoma. Nature 436:117–122; 2005. [DOI] [PubMed] [Google Scholar]
- 8. Gautier L.; Cope L.; Bolstad B. M.; Irizarry R. A. affy—analysis of Affymetrix GeneChip data at the probe level. Bioinformatics 20:307–315; 2004. [DOI] [PubMed] [Google Scholar]
- 9. Gentleman R. C.; Carey V. J.; Bates D. M.; Bolstad B.; Dettling M.; Dudoit S.; Ellis B.; Gautier L.; Ge Y.; Gentry J.; Hornik K.; Hothorn T.; Huber W.; Iacus S.; Irizarry R.; Leisch F.; Li C.; Maechler M.; Rossini A. J.; Sawitzki G.; Smith C.; Smyth G.; Tierney L.; Yang J. Y.; Zhang J. Bioconductor: Open software development for computational biology and bioinformatics. Genome Biol. 5:R80; 2004. [DOI] [PMC free article] [PubMed] [Google Scholar]
- 10. Gollob J. A.; Sciambi C. J.; Huang Z.; Dressman H. K. Gene expression changes and signaling events associated with the direct antimelanoma effect of IFN-gamma. Cancer Res. 65:8869–8877; 2005. [DOI] [PubMed] [Google Scholar]
- 11. Greijer A. E.; van der Groep P.; Kemming D.; Shvarts A.; Semenza G. L.; Meijer G. A.; van de Wiel M. A.; Belien J. A.; van Diest P. J.; van der Wall E. Up-regulation of gene expression by hypoxia is mediated predominantly by hypoxia-inducible factor 1 (HIF-1). J. Pathol. 206:291–304; 2005. [DOI] [PubMed] [Google Scholar]
- 12. Graells J.; Vinyals A.; Figueras A.; Llorens A.; Moreno A.; Marcoval J.; Gonzalez F. J.; Fabra A. Overproduction of VEGF concomitantly expressed with its receptors promotes growth and survival of melanoma cells through MAPK and PI3K signaling. J. Invest. Dermatol. 123:1151–1161; 2004. [DOI] [PubMed] [Google Scholar]
- 13. Gritsko T.; Williams A.; Turkson J.; Kaneko S.; Bowman T.; Huang M.; Nam S.; Eweis I.; Diaz N.; Sullivan D.; Yoder S.; Enkemann S.; Eschrich S.; Lee J. H.; Beam C. A.; Cheng J.; Minton S.; Muro-Cacho C. A.; Jove R. Persistent activation of stat3 signaling induces survivin gene expression and confers resistance to apoptosis in human breast cancer cells. Clin. Cancer Res. 12:11–19; 2006. [DOI] [PubMed] [Google Scholar]
- 14. Hamby C. V.; Mendola C. E.; Potla L.; Stafford G.; Backer J. M. Differential expression and mutation of NME genes in autologous cultured human melanoma cells with different metastatic potentials. Biochem. Biophys. Res. Commun. 211:579–585; 1995. [DOI] [PubMed] [Google Scholar]
- 15. Harris A. L. Hypoxia—a key regulatory factor in tumour growth. Nat. Rev. Cancer 2:38–47; 2002. [DOI] [PubMed] [Google Scholar]
- 16. Höckel M.; Vaupel P. Tumor hypoxia: Definitions and current clinical, biologic, and molecular aspects. J. Natl. Cancer Inst. 93:266–276; 2001. [DOI] [PubMed] [Google Scholar]
- 17. Hofbauer K. H.; Gess B.; Lohaus C.; Meyer H. E.; Katschinski D.; Kurtaz A. Oxygen tension regulates the expression of a group of procollagen hydroxylases. Eur. J. Biochem. 270:4515–4522; 2003. [DOI] [PubMed] [Google Scholar]
- 18. Huang K. C.; Park D. C.; Ng S. K.; Lee J. Y.; Ni X.; Ng W. C.; Bandera C. A.; Welch W. R.; Berkowitz R. S.; Mok S. C.; Ng S. W. Selenium binding protein 1 in ovarian cancer. Int. J. Cancer 118:2433–2440; 2006. [DOI] [PubMed] [Google Scholar]
- 19. Iurisci I.; Tinari N.; Natoli C.; Angelucci D.; Cianchetti E.; Iacobelli S. Concentrations of galectin-3 in the sera of normal controls and cancer patients. Clin. Cancer Res. 6:1389–1393; 2000. [PubMed] [Google Scholar]
- 20. Jarząb B.; Wiench M.; Fujarewicz K.; Simek K.; Jarząb M.; Oczko-Wojciechowska M.; Włoch J.; Czarniecka A.; Chmielik E.; Lange D.; Pawlaczek A.; Szpak S.; Gubała E.; Świerniak A. Gene expression profile of papillary thyroid cancer: Sources of variability and diagnostic implications. Cancer Res. 65:1587–1597; 2005. [DOI] [PubMed] [Google Scholar]
- 21. Jung J. E.; Lee H. G.; Cho I. H.; Chung D. H.; Yoon S. H.; Yang Y. M.; Lee J. W.; Choi S.; Park J. W.; Ye S. K.; Chung M. H. STAT3 is a potential modulator of HIF-1-mediated VEGF expression in human renal carcinoma cells. FASEB J. 19:1296–1298; 2005. [DOI] [PubMed] [Google Scholar]
- 22. Kim H.; Lee D. K.; Choi J-W.; Kim J-S.; Park S. C.; Youn H-D. Analysis of the effect of aging on the response to hypoxia by cDNA microarray. Mech. Ageing 124:941–949; 2003. [DOI] [PubMed] [Google Scholar]
- 23. Kunz M.; Moeller S.; Koczan D.; Lorenz P.; Wenger R. H.; Glocker M. O.; Thiesen H. J.; Gross G.; Ibrahim S. M. Mechanisms of hypoxic gene regulation of angiogenesis factor Cyr61 in melanoma cells. J. Biol. Chem. 278:45651–45660; 2003. [DOI] [PubMed] [Google Scholar]
- 24. Leo C.; Giaccia A. J.; Denko N. C. The hypoxic tumor microenvironment and gene expression. Semin. Radiat. Oncol. 14:207–214; 2004. [DOI] [PubMed] [Google Scholar]
- 25. Lin B. R.; Chang C. C.; Che T. F.; Chen S. T.; Chen R. J.; Yang C. Y.; Jeng Y. M.; Liang J. T.; Lee P. H.; Chang K. J.; Chau Y. P.; Kuo M. L. Connective tissue growth factor inhibits metastasis and acts as an independent prognostic marker in colorectal cancer. Gastroenterology 128:9–23; 2005. [DOI] [PubMed] [Google Scholar]
- 26. Lossos I. S.; Czerwinski D. K.; Alizadeh A. A.; Wechser M. A.; Tibshirani R.; Botstein D.; Levy R. Prediction of survival in diffuse large-B-cell lymphoma based on the expression of six genes. N. Engl. J. Med. 350:1828–1837; 2004. [DOI] [PubMed] [Google Scholar]
- 27. Marco R. A.; Diaz-Montero C. M.; Wygant J. N.; Kleinerman E. S.; McIntyre B. W. Alpha 4 integrin increases anoikis of human osteosarcoma cells. J. Cell Biochem. 88:1038–1047; 2003. [DOI] [PubMed] [Google Scholar]
- 28. Ord J. J.; Streeter E. H.; Roberts I. S.; Cranston D.; Harris A. L. Comparison of hypoxia transcriptome in vitro with in vivo gene expression in human bladder cancer. Br. J. Cancer 93:346–354; 2005. [DOI] [PMC free article] [PubMed] [Google Scholar]
- 29. Pacifico M. D.; Grover R.; Richman P. I.; Daley F. M.; Buffa F.; Wilson G. D. Development of a tissue array for primary melanoma with long-term follow-up: Discovering melanoma cell adhesion molecule as an important prognostic marker. Plast. Reconstr. Surg. 115:367–375; 2005. [DOI] [PubMed] [Google Scholar]
- 30. Postovit L. M.; Adams M. A.; Lash G. E.; Heaton J. P.; Graham C. H. Nitric oxide-mediated regulation of hypoxia-induced B16F10 melanoma metastasis. Int. J. Cancer 108:47–53; 2004. [DOI] [PubMed] [Google Scholar]
- 31. Ribatti D.; Nico B.; Floris C.; Mangieri D.; Piras F.; Ennas M. G.; Vacca A.; Sirigu P. Microvascular density, vascular endothelial growth factor immunore-activity in tumor cells, vessel diameter and intussusceptive microvascular growth in primary melanoma. Oncol. Rep. 14:81–84; 2005. [PubMed] [Google Scholar]
- 32. Rofstad E. K.; Danielsen T. Hypoxia-induced metastasis of human melanoma cells: Involvement of vascular endothelial growth factor-mediated angiogenesis. Br. J. Cancer 80:1697–1707; 1999. [DOI] [PMC free article] [PubMed] [Google Scholar]
- 33. Rofstad E. K.; Rasmussen H.; Galappathi K.; Mathiesen B.; Nielsen K.; Graff B. A. Hypoxia promotes lymph node metastasis in human melanoma xenografts by up-regulating the urokinase-type plasminogen activator receptor. Cancer Res. 62:1847–1853; 2002. [PubMed] [Google Scholar]
- 34. Salnikow K.; Su W.; Blagosklonny M. V.; Costa M. Carcinogenic metals induce hypoxia-inducible factor-stimulated transcription by reactive oxygen species-independent mechanism. Cancer Res. 60:3375–3378; 2000. [PubMed] [Google Scholar]
- 35. Semenza G. Hypoxia-inducible factor1: Master regulator of O2 homeostasis. Curr. Opin. Genet. Dev. 8:588–594; 1998. [DOI] [PubMed] [Google Scholar]
- 36. Simek K. SVD analysis of microarray data. In: Cellular biophysics, regulatory networks, and data analysis. Boston and Basel: Birkhäuser; in press.. [Google Scholar]
- 37. Shellman Y. G.; Park Y. L.; Marr D. G.; Casper K.; Xu Y.; Fujita M.; Swerlick R.; Norris D. A. Release of vascular endothelial growth factor from a human melanoma cell line, WM35, is induced by hypoxia but not ultraviolet radiation and is potentiated by activated Ras mutation. Cancer Biol Ther. 1:459–465; 2002. [DOI] [PubMed] [Google Scholar]
- 38. Smyth G. K. Linear models and empirical Bayes methods for assessing differential expression in microarray experiments. Stat. Appl. Genet. Mol. Biol. 3(1): Article 3; 2004. [DOI] [PubMed] [Google Scholar]
- 39. Sørensen B. S.; Hao J.; Overgaard J.; Vorum H.; Honoré B.; Alsner J.; Horsman M. R. Influence of oxygen concentration and pH on expression of hypoxia induced genes. Radiother. Oncol. 76:187–193; 2005. [DOI] [PubMed] [Google Scholar]
- 40. Tan C.; Cruet-Hennequart S.; Troussard A.; Fazli L.; Costello P.; Sutton K.; Wheeler J.; Gleave M.; Sanghera J.; Dedhar S. Regulation of tumor angiogenesis by integrin-linked kinase (ILK). Cancer Cell 5:79–90; 2004. [DOI] [PubMed] [Google Scholar]
- 41. To K. K.; Koshiji M.; Hammer S.; Huang L. E. Genetic instability: The dark side of the hypoxic response. Cell Cycle 4:881–882; 2005. [DOI] [PubMed] [Google Scholar]
- 42. Troost E. G.; Bussink J.; Kaanders J. H.; van Eerd J.; Peters J. P.; Rijken P. F.; Boerman O. C.; van der Kogel A. J. Comparison of different methods of CAIX quantification in relation to hypoxia in three human head and neck tumor lines. Radiother. Oncol. 76:194–199; 2005. [DOI] [PubMed] [Google Scholar]
- 43. Vengellur A.; Phillips J. M.; Hogenesch J. B.; LaPres J. J. Gene expression profiling of hypoxia signaling in human hepatocellular carcinoma cells. Physiol. Genomics 22:308–318; 2005. [DOI] [PubMed] [Google Scholar]
- 44. Vereecken P.; Debray C.; Petein M.; Awada A.; Lalmand M. C.; Laporte M.; Van Den Heule B.; Verhest A.; Pochet R.; Heenen M. Expression of galectin-3 in primary and metastatic melanoma: Immunohistochemical studies on human lesions and nude mice xenograft tumors. Arch. Dermatol. Res. 296:353–358; 2005. [DOI] [PubMed] [Google Scholar]
- 45. Vereecken P.; Zouaoui Boudjeltia K.; Debray C.; Awada A.; Legssyer I.; Sales F.; Petein M.; Vanhaeverbeek M.; Ghanem G.; Heenen M. High serum galectin-3 in advanced melanoma: Preliminary results. Clin. Exp. Dermatol. 31:105–109; 2006. [DOI] [PubMed] [Google Scholar]
- 46. Wang V.; Davis D. A.; Haque M.; Huang L. E.; Yarchoan R. Differential gene up-regulation by hypoxia-inducible factor-1alpha and hypoxia-inducible factor-2alpha in HEK293T cells. Cancer Res. 65:3299–3306; 2005. [DOI] [PubMed] [Google Scholar]
- 47. Weinmann M.; Belka C.; Güner D.; Goecke B.; Müller I.; Bamberg M.; Jendrossek V. Array-based comparative gene expression analysis of tumor cells with increased apoptosis resistance after hypoxic selection. Oncogene 24:5914–5922; 2005. [DOI] [PubMed] [Google Scholar]
- 48. Winnepenninckx V.; Lazar V.; Michiels S.; Dessen P.; Stas M.; Alonso S. R.; Avril M. F.; Ortiz Romero P. L.; Robert T.; Balacescu O.; Eggermont A. M.; Lenoir G.; Sarasin A.; Tursz T.; van den Oord J. J.; Spatz A.; Melanoma Group of the European Organization for Research and Treatment of Cancer. Gene expression profiling of primary cutaneous melanoma and clinical outcome. J. Natl. Cancer Inst. 98:472–482; 2006. [DOI] [PubMed] [Google Scholar]
- 49. Xie D.; Yin D.; Wang H. J.; Liu G. T.; Elashoff R.; Black K.; Koeffler H. P. Levels of expression of CYR61 and CTGF are prognostic for tumor progression and survival of individuals with gliomas. Clin. Cancer Res. 10:2072–2081; 2004. [DOI] [PubMed] [Google Scholar]
- 50. Xie T. X.; Huang F. J.; Aldape K. D.; Kang S. H.; Liu M.; Gershenwald J. E.; Xie K.; Sawaya R.; Huang S. Activation of stat3 in human melanoma promotes brain metastasis. Cancer Res. 66:3188–3196; 2006. [DOI] [PubMed] [Google Scholar]
- 51. Yang H.; Wang S.; Liu Z.; Wu M. H.; McAlpine B.; Ansel J.; Armstrong C.; Wu G. Isolation and characterization of mouse MUC18 cDNA gene, and correlation of MUC18 expression in mouse melanoma cell lines with metastatic ability. Gene 265:133–145; 2001. [DOI] [PubMed] [Google Scholar]
- 52. Ziel K. A.; Campbell C. C.; Wilson G. L.; Gillespie M. N. Ref-1/Ape is critical for formation of the hypoxia-inducible transcriptional complex on the hypoxic response element of the rat pulmonary artery endothelial cell VEGF gene. FASEB J. 18:986–988; 2004. [DOI] [PubMed] [Google Scholar]
- 53. Zudaire E.; Martinez A.; Cuttitta F. Adrenomedullin and cancer. Regul. Pept. 112:175–183; 2003. [DOI] [PubMed] [Google Scholar]