Abstract
The mouse ortholog of the human GOLSYN gene, termed the m-Golsyn gene, was isolated and mapped to the region on mouse chromosome 15B3.2 syntenic with human chromosome 8q23. Three mRNA species (type 1a, 1b, and type 2) were produced by use of alternative transcription initiation points and alternative splicing events. The type 1 mRNAs were expressed only in the brain, whereas the type 2 was detected in various tissues. m-Golsyn protein was expressed in various tissues including the brain. Immunohistochemical study of m-Golsyn protein showed its prominent expression in the neuronal cells in various regions of the brain and strong expression in the choroid plexus ependymal cells lining the ventricles. m-Golsyn protein was found to be homologous to syntaphilin, a regulator of synaptic vesicle exocytosis. These results indicate that the m-Golsyn protein may play an important role in intracellular protein transport in neuronal cells of the brain.
Key words: GOLSYN, m-Golsyn, Brain, Protein trafficking, Syntaphilin, Neuronal cells, Genomic structure, Choroid plexus, Chromosome 15B3.2, cDNA cloning
PREVIOUSLY, we determined the complete sequence of the novel gene h-GOLSYN (human Golgi-localized syntaphilin-related protein), and mapped it to the human chromosome 8q23 region (6). Because one of genes involved in adult-onset primary open-angle glaucoma (POAG) has been mapped to this chromosomal region (20,22,23,26–31), h-GOLSYN may be one of the causative genes for this disease. This gene was expressed in various fetal and adult tissues; and its gene product, GOLSYN protein, was expressed in the Golgi apparatus. GOLSYN showed significant homology with syntaphilin, a protein characterized as a binding partner of syntaxin-1 (14). Binding of syntaphilin to syntaxin inhibits the binding of syntaxin to SNAP-25 and thus prevents the formation of the SNARE core complex (14). Thus, GOLSYN may regulate vesicular transport in various cell types. However, the physiological and pathological functions of the GOLSYN protein are far from established.
In this report, we describe the genomic structure of m-Golsyn, the mouse ortholog of the h-GOLSYN gene and its expression in various cell lines and tissues. Three transcripts (type 1a, 1b, and 2) were produced from m-Golsyn gene by use of alternative transcription start sites and alternative splicing events. Type 1 mRNAs were detected only in the brain, whereas type 2 mRNA was ubiquitously expressed in various tissues. m-Golsyn protein was expressed in various tissues including the central nervous system. In the brain, this protein showed its strong expression in the neuronal cells and the choroid plexus ependymal cells lining the ventricles. Because m-Golsyn protein, like GOLSYN, was shown to be homologous to syntaphilin, this protein may play a role in intracellular vesicle transport in various cell types including neuronal cells.
MATERIALS AND METHODS
Reagents
The following materials were purchased from the sources indicated: Marathon-Ready™ mouse brain cDNA library and Advantage 2 polymerase mix from Clontech Co. Ltd. (Palo Alto, CA); TA Cloning kits from Invitrogen Co. (Carlsbad, CA); Histofine from Nichirei Co. (Tokyo, Japan); Vectastain ABC kit from Vector Laboratories, Inc. (Burlingame, CA). Sources of other materials are shown in the text.
Antibodies
Rabbit anti-GOLSYN antibody was prepared as described previously (6). The following antibodies were purchased from the sources indicated: mouse anti-protein disulfide isomerase (PDI) antibody, from StressGen Biotechnologies (Canada, BC); mouse anti-syntaxin 6 antibody, from BD Transduction (San Diego, CA); mouse anti-synaptophysin antibody and mouse anti-β-tubulin antibody, from Santa Cruz Biotechnology, Inc. (Santa Cruz, CA); mouse anti-neuronal nuclei (NeuN) monoclonal antibody, from Chemicon International, Inc. (Temecula, CA); mouse monoclonal anti-glial fibrillary acidic protein (GFAP) antibody and FITC-conjugated anti-mouse IgG antibody, from Sigma Chemical Co. (St. Louis, MO); horseradish peroxidase (HRP)-conjugated, swine anti-rabbit immunoglobulins, from DakoCytomation Inc. (Car-pinteria, CA); peroxidase-linked anti-mouse Ig, from Amersham Biosciences Corp. (Piscataway, NJ); biotinylated anti-rabbit IgG antibody, from Vector Laboratories Inc. (Burlingame, CA); Texas Red-conjugated goat anti-rabbit IgG, from Molecular Probes Inc. (Eugene, OR).
cDNA Cloning of m-Golsyn Gene
The nucleotide sequence homology of human GOLSYN cDNA was searched against an EST database by using BLAST (1) through the NCBI WWW server. cDNA cloning was performed by using internal amplification of cDNAs and 5′ and 3′ Rapid Amplification of cDNA Ends (RACE) method protocols. The RACE reaction was performed to determine the sequences of m-Golsyn gene at 5′ and 3′ ends with Marathon-Ready mouse brain cDNA library used as template. PCR reactions were carried out by using Advantage 2 DNA polymerase mix for the 5′ and 3′ RACE and the internal fragments. For internal amplification of the m-Golsyn gene, Golsyn F1, 5′-tctccac cccaccacaaaaaaaaatcc-3′, and Golsyn R5, 5′-tagcga gaagcaaaactgacagaatag-3′, were used. First PCR was performed by using Type 1 5′ RACE1, 5′-ctgctctggg gctcacaaac-3′, and AP1, 5′-ccatcctaatacgactcactatag ggc-3′, for 25-cycle amplification of the 5′ region of type 1 m-Golsyn cDNA in a 20-|al reaction volume. The PCR products were then used as a template in the second PCR run, where Type 1 5′ RACE2, 5′-gcgaccagaggaccgattac-3′, and AP2, 5′-actcactataggg ctcgagcggc-3′, were utilized as primers. For amplification of the 5′ region of type 2 m-Golsyn, Type 2 5′RACE1, 5′-tttttgtggtggggtggagac-3/AP1 and Type 2 5′RACE2, 5′-ctgcattctggggcatcctgggatt-3/AP2 were used for the first and second PCR, respectively. For the 3′ region amplification of Golsyn types 1 and 2, 3′ RACE1, 5′-ttcttggtggatctactggctgtggct-3/AP1 and 3′ RACE2, 5′-ccctacactcactacgccgcaccgctt-3/AP2 were used for the first and second PCR, respectively. The DNA fragments obtained by internal amplification and 5′ and 3′ RACE reaction were subcloned into a pCR2.1 TA cloning vector (Invitrogen) and sequenced with an ABI377 DNA Sequencer (Applied Biosystems, Foster, CA) by the Dideoxy Terminator Cycle Sequencing method using the DYEnamic ET Terminator (Amersham Biosciences Corp., Piscataway, NJ).
Cell Culture
HeLa, NIH/3T3, and L929 cells were maintained in Dulbecco’s modified Eagle’s (DME) medium supplemented with 10% fetal calf serum in 5% CO2 at 37°C in a fully humidified atmosphere. J774 cells were maintained at 37°C in a 5% CO2 atmosphere in RPMI medium supplemented with 10% fetal calf serum. Exponentially growing cells were used in all experiments.
Animals
Adult male ddY mice weighing 25-30 g (Japan SLC, Hamamatsu, Japan) were housed in metallic breeding cages in a room with a light-dark cycle of 12 h/12 h and humidity of 55% at 25°C, with free access to food and water before use.
Expression Analysis of m-Golsyn Transcripts in Various Mouse Tissues
Total RNAs from various mouse tissues were isolated with ISOGEN reagents (Nippon Gene, Japan). First-strand cDNA was synthesized from 5 μg of total RNA by using Ready to Go You-Prime First-Strand Beads (Amersham Biosciences Corp.) and pd (N)6 random hexanucleotides as primer according to manufacturer’s instructions. Each cDNA derived from 0.15 μg of RNA was used as a template for PCR amplification with the following sets of primers specific for the sequences of the type 1 and 2 cDNAs: Goslyn F2, 5′-acaagcctctagggcatttggggacac-3′, and Golsyn R2, 5′-gatttgggggtttgacaccgtgatttt-3′, for type 1; and Golsyn F1, 5′-tctccaccccaccacaaaaaaaaatcc-3′, and Golsyn R1, 5′-acttccctcaccaaccattccaatcct-3′, for type 2. Thirty cycles of PCR were performed using the following temperature profiles: 94°C, 1 min; 68°C, 3 min. As a control, a fragment of mouse cDNA for actin was amplified with the following primers: 5′-atctggcaccacacct-3′ and 5′-cgtcatactcctgc ttg-3′. DNA fragments amplified by PCR were resolved by electrophoresis on a 1.5% agarose gel, stained with 10 μg/ml of ethidium bromide, and visualized under illumination by an Electric UV Transilluminator (FAS III, TOYOBO).
Preparation of Various Mouse Tissues
The study protocol was approved by the Committee for Ethical Use of Experimental Animals at Setsu-nan University. All steps were performed at 0−4°C. Mice were killed, and then their brain, spinal cord, heart, liver, lung, pancreas, stomach, small intestine, kidney, spleen, testis, and skeletal muscle were quickly removed and immersed in the homogenizing buffer described below. In some experiments, brains were further divided into olfactory bulb, cerebral cortex, hippocampus, striatum, hypothalamus, midbrain, medulla pons, and cerebellum according to the procedures described previously (7,18). Tissues were homogenized in 1 ml of the homogenizing buffer (10 mM Tris-HCl, pH 7.5, containing 0.32 M sucrose, 1 mM EDTA, 1 mM EGTA, 5 mM dithiothreitol, 10 mM sodium fluoride, 10 mM sodium β-glycerophosphate, and a mixture of protease inhibitors) by using a Physcotron NS-50 homogenizer (Microtec). An equal volume of 2× SDS sample buffer (1 × SDS sample buffer = 62.5 mM Tris-HCl, pH 6.8, containing 2% SDS, 5% 2-mercaptoethanol, 10% glycerol, and 0.1% bromophenol blue) was added to each of the homogenates; the homogenates were then boiled for 5 min and thereafter centrifuged at 12,000 × g for 15 min at 4°C. The resulting supernatants were subjected to SDS-PAGE according to Laemmli (13).
Subcellular Fractionation of Mouse Cerebral Cortex
Subcellular fractionation of mouse cerebral cortex was performed as described previously (10,19) with minor modifications. Briefly, cerebral cortexes were homogenized in 0.32 M sucrose buffered with 10 mM HEPES, pH 7.5, containing 1 mM MgCl2, 0.1 mM EGTA, and a mixture of protease inhibitors, and centrifuged at 1000 × g for 10 min. The resulting pellet was resuspended in buffered sucrose plus 0.5% Nonidet P-40 and recentrifuged at 1000 × g for 10 min to yield a pellet (N), while the supernatant was centrifuged at 10,000 × g for 20 min. The resulting supernatant was centrifuged at 100,000 × g for 60 min to yield a supernatant (S) and a pellet (P); whereas the pellet was resuspended in 5 mM Tris-HCl, pH 8.1, and centrifuged at 28,000 × g for 60 min to yield a pellet (SM). The resulting supernatant was centrifuged at 100,000 × g for 60 min to yield a supernatant (PC) and a pellet (SV).
Sucrose gradient centrifugation was performed as described previously (6). Briefly, pellet P or SV was resuspended in 1.5 M sucrose solution, applied to a gradient containing 0.32 and 1.25 M sucrose solution, and centrifuged at 100,000 × g for 60 min. Three distinct fractions were obtained: fraction A at the interface of the 0.32 and 1.25 M sucrose solutions; fraction B at the interface of the 1.25 and 1.5 M sucrose solutions; and fraction C, as the pellet. Each fraction was collected and subjected to SDS-PAGE.
Immunoblot Analysis
Immunoblot analysis was performed as described previously (6). Briefly, proteins separated by SDS-PAGE were transferred electrophoretically onto a polyvinylidene difluoride membrane (Immobilon, Millipore). The membrane was incubated at 4°C overnight in Tris-buffered saline (TBS: 20 mM Tris-HCl, pH 7.5, containing 150 mM NaCl) supplemented with 10% nonfat milk. The membrane was incubated with anti-GOLSYN antibody (1:500), anti-syntaxin 6 antibody (1:1000), anti-PDI antibody (1: 500), anti-synaptophysin antibody (1:5000), or anti-β-tubulin antibody (1:500) for 2 h at room temperature. It was next washed three times with TBS containing 0.02% Tween 20 and then incubated with HRP-conjugated anti-rabbit IgG antibody (1:1000) or anti-mouse IgG antibody (1:1000) for 1 h at room temperature. Finally, the proteins were visualized by an ECL PLUS Western Blotting Detection System (Amersham Biosciences Corp.).
Immunohistochemical Analysis
Sections of mouse brain were prepared as described previously (17). Briefly, mice were deeply anesthetized with pentobarbital (250 mg/kg, IP) and perfused via the heart with saline, followed by buffer A (100 mM sodium phosphate, pH 7.4, containing 4% paraformaldehyde). The brains were quickly removed, fixed with the solution A for an additional 2 h at 4°C, and then equilibrated with buffer B (100 mM sodium phosphate, pH 7.4, containing 30% sucrose) at 4°C overnight. They were then embedded in paraffin, after which serial coronal and sagittal sections were prepared at a thickness of 1 μm by using a microtome. The sections were blocked with 10% normal goat serum for 1 h at room temperature and then incubated with anti-GOLSYN antibody (1:100) at 4°C overnight. After the sections had been washed gently with TBS containing 0.03% Tween 20, they were incubated with biotinylated anti-rabbit IgG antibody (1:200) for 30 min at room temperature and subsequently with ABC solution (Vectastain ABC kit, Vector Laboratory) for 1 h at room temperature. Finally they were immersed for 5 min in a solution containing diaminobenzidine (Histofine, Ninirei Co.).
Double-Label Immunofluorescence Analysis
Paraffin-embedded coronal sections (1 μm) of the brains of ddY mice were prepared by using a microtome. After having been blocked with 10% normal goat serum for 1 h at room temperature, the sections were incubated with anti-NeuN antibody (1:100) or anti-GFAP antibody (1:100) and anti-GOLSYN antibody (1:100) at 4°C overnight. After the sections had been washed gently with TBS containing 0.03% Tween 20, they were incubated with FITC-conjugated goat anti-mouse IgG antibody (1:300) and Texas Red-conjugated goat anti-rabbit IgG antibody (1:100) for 2 h at room temperature. The stained sections were observed with a fluorescence microscope.
Protein Assay
Protein content was assayed by using a BCA kit (Pierce Chemical Co.) according to the manufacturer’s instructions.
DDBJ/EMBL/GenBank Accession Numbers
DDBJ/EMBL/GenBank database accession numbers for the sequences reported in this article are as follows: AB232447, AB232448, and AB232449.
RESULTS
Identification of a Mouse Gene Homologous to the Human GOLSYN Gene
In order to isolate the cDNA for the mouse ortholog of the human (h)-GOLSYN gene, we performed homology analysis by using a cDNA sequence of the h-GOLSYN gene as a probe to search a DNA database, and obtained four mouse EST sequences (i.e., BB647074, BM951171, BM947901, and BB023907) (Fig. 1A). We synthesized a set of primer pairs based on information on these EST sequences and performed PCR amplification using a mouse brain cDNA library as a template. As a result, all these EST clones were found to be connected with a single gene.
Figure 1.
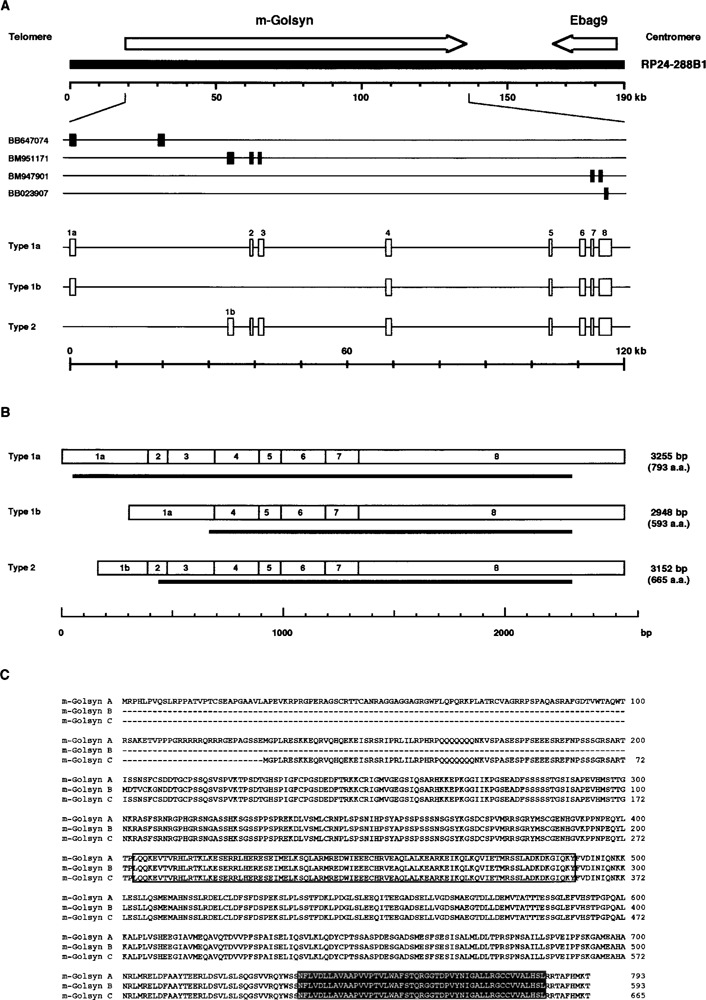
Genomic, mRNA, and protein structures of the m-Golsyn gene. (A) Exon–intron structure of the m-Golsyn gene (mouse ortholog of the human-GOLSYN gene). The m-Golsyn gene consists of 8 exons, and is situated within a 115-kb region of the RP24-288B1 BAC clone that is mapped to the mouse chromosome 15B3.2 region. The arrow pointing to the right indicates the position and the direction of m-Golsyn gene. Segments of EST (GenBank Accession Nos. BB647074, BM951171, BM947901, and BB023907), which were used for the determination of the genomic structure of the m-Golsyn gene, are indicated. Boxes indicate the position of exons. (B) Structure of the three types of m-Golsyn mRNA. Thick horizontal lines under each transcript indicate the position of the open reading frame. (C) Deduced amino acid sequences of the three m-Golsyn proteins. Their functional domains were predicted from the results of the functional search of a database: a potential coiled-coil domain is boxed, and a putative transmembrane domain is shaded.
Next, we sought to identify the 3′ sequence of this gene, because BB023907 did not have the signal sequence for polyadenylation in its 3′ sequence. Primers were designed on the basis of 3′ sequence of BB023907, and a 3′ RACE reaction was performed by using a mouse brain cDNA library as a template. As a result, we extended 612 bp downstream of BB023907 and found a polyadenylation site, “AA TAAA,” in this extended sequence.
When PCR analysis was performed with a pair of oligonucleotides specific for the 5′ sequence (nucleotides 67–93) of BB647074 and the 5′ sequence (nucleotides 39–65) of BM947901, two PCR products (1275 and 968 bp) were detected, indicating the existence of alternative splicing variants for this gene. We then performed PCR analysis by using a mouse brain cDNA library and primers specific for a 5′ sequence (nucleotides 67–93) of BB647074 and 5′ sequence (nucleotides 345–371) of BB023907 and detected two amplified products of 2564 and 2257 bp. The sequencing analysis of these products and RACE analysis for 5′ ends revealed that the stop codons were present at 27 and 33 bp upstream of a potential start codon in the 2564-bp and 2275-bp fragments, respectively. Thus, two types of mRNA, named type 1a and 1b, were produced by use of alternative splicing.
As the 5′ sequence (nucleotides 1–225) of BM951171 was not present in the amplified 2564-bp and 2275-bp DNA fragments, the possibility exists that another type of mRNA containing nucleotides 1–225 of BM951171 might be produced from this gene. Therefore, we performed PCR analysis by using a mouse brain cDNA library and a set of primers specific for a 5′ sequence (nucleotides 148–174) of BM951171 and 5′ sequence (nucleotides 345–371) of BB023907 and detected a 2392-bp amplified fragment. We also performed 5′ RACE reaction using primers designed on the basis of the 5′ sequence of BM951171 and identified this other type of mRNA, which we named type 2. Thus, at least three types of mRNA (types 1a, 1b, and 2) were produced from this gene.
Comparison of the nucleotide sequences of types 1a, 1b, and 2 mRNA with RP24-288B1, a BAC clone, which had been mapped to mouse chromosome 15B3.2, indicated that the gene was composed of 8 exons distributed within a 115-kb region of the BAC clone (Fig. 1A). As shown in Table 1, all exon– intron junctions followed the GT-AG rule. The cDNA sequence of the gene had high similarity with that of the h-GOLSYN gene at both nucleotide and amino acid sequence levels (80% and 85%, respectively). Furthermore, the gene was mapped to mouse chromosome 15B3.2, which is syntenic with human chromosome 8q23. Thus, we concluded this gene to be the mouse ortholog of the h-GOLSYN gene, and named it m-Golsyn gene.
TABLE 1.
SEQUENCES AT EXON AND INTRON BOUNDARIES OF THE m-Golsyn GENE
| Exon No. | Exon Size (bp) | Exon–Intron Junction | Intron Size (bp) | |
|---|---|---|---|---|
| 3′ Splice Acceptor | 5′ Splice Donor | |||
| 1a | >475 | — | AAAGGAAACGgtaagatgca | 39190 |
| 1b | >372 | — | GCACACGCAGgtgagacctg | 3688 |
| 2 | 90 | gtgctcacagGTGCCTCCTC | AGAGAGCAAGgtaaggggac | 1846 |
| 3 | 217 | catttggagAAGGAGCAGA | TTCTGCTCAGgtacactaag | 27260 |
| 4 | 198 | tgtctcctagATGACACAGG | ATAAAGCCAGgtaagtaccc | 35337 |
| 5 | 103 | tgtttttcagGCAGTCAAGC | TCTCACGCAAgtaggcactg | 5609 |
| 6 | 204 | cctctttcagCCGAGGCCCT | CAGTCATGAGgtaagtcccc | 2019 |
| 7 | 150 | attatctcagAAGGTCTGGA | TCCATGAGAGgtaaatctgg | 1717 |
| 8 | 1792 | ttctctatagGGAATCTGAA | — | — |
Figure 1B shows that three types of mRNA were produced by use of alternative transcription start sites and alternative splicing events. Types 1a, 1b, and type 2 mRNA contained open reading frames of 793, 593, and 665 amino acids, respectively. Thus, three isoforms with different amino-terminal sequences could be produced from the m-Golsyn gene (Fig. 1C). We tentatively named these products with 793, 593, and 665 amino acids as m-Golsyn A, B, and C.
Expression Analysis of Transcripts From m-Golsyn Gene in Mouse Tissues
Next, we investigated the expression of type 1a, 1b, and 2 mRNAs of m-Golsyn in mouse tissues by use of the RT-PCR method. Two pairs of PCR primers were designed, as shown in Figure 2A, and used for the specific amplification of the cDNA fragments of types 1 and 2. Type 1a and 1b mRNAs were expressed only in the brain among the tissues examined (Fig. 2B, upper panel). On the other hand, type 2 mRNA was expressed in various tissues including the brain (Fig. 2B, middle panel).
Figure 2.
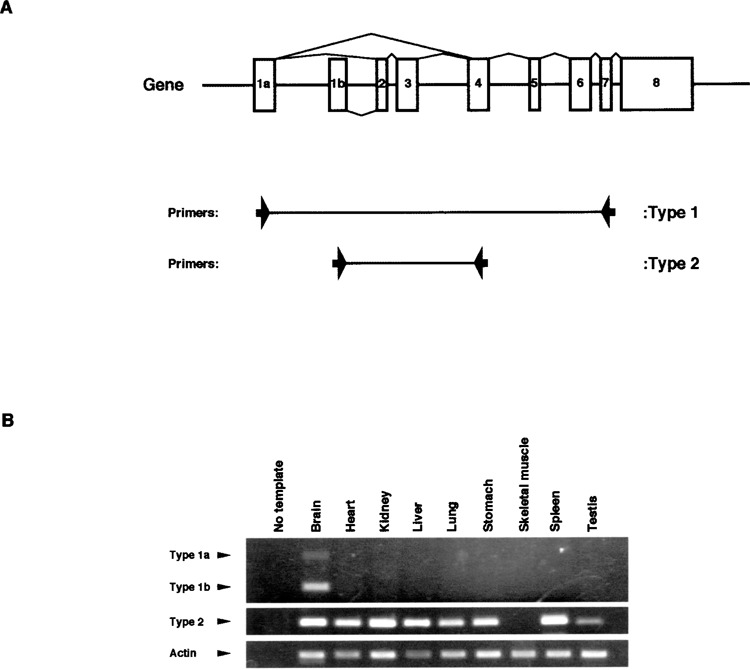
Expression analysis of m-Golsyn transcripts in mouse tissues. cDNA fragments of m-Golsyn type 1 and type 2 were amplified by using the primer sets described under Materials and Methods. (A) The positions of the two sets of primers are indicated by the arrows. (B) The cDNA fragments of m-Golsyn type 1 and type 2 were amplified by using first-strand cDNAs derived from nine different mouse tissues. Lane 1 in (B) is a negative control lacking template cDNA. PCR was performed with cDNA derived from 0.15 μg of RNA for the amplification of m-Golsyn cDNAs and mouse actin cDNA.
Immunoblot Analysis of m-Golsyn Protein in Various Mouse Tissues
We previously generated an antibody specific for h-GOLSYN protein, termed anti-GOLSYN antibody (6). The peptide sequence (DKEISRSRIPRLILRP), which had been used to immunize rabbits, is well conserved between h-GOLSYN and m-Golsyn protein (Fig. 3A). So we tested whether the antibody could recognize the m-Golsyn protein. It recognized a single band with a molecular mass of approx. 90 kDa in cell lysates, each of which had been prepared from several cell lines from different species and tissues of origin (Fig. 3B, lanes 1–4). No band was detected in the presence of an excess amount of the peptide that had been used for the generation of the anti-GOLSYN antibody (Fig. 3B, lanes 5–8). Thus, it appears that the anti-GOLSYN antibody could indeed recognize m-Golsyn protein and that m-Golsyn protein was expressed in a variety of mouse cell lines.
Figure 3.
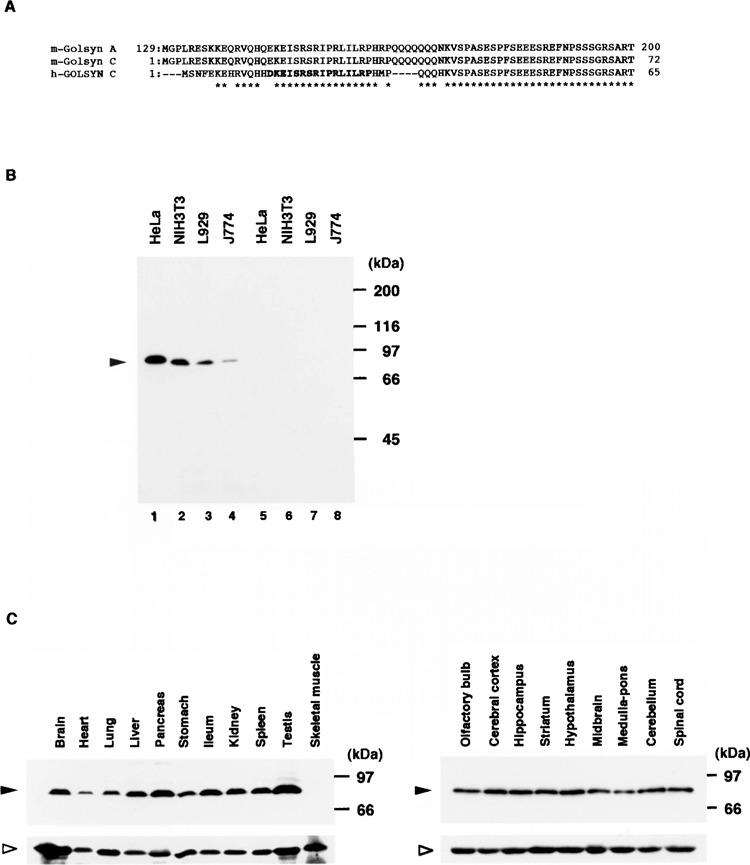
Expression of m-Golsyn protein in mouse cell lines and tissues. (A) Parts of the peptide sequences of m-Golsyn and h-GOLSYN are indicated. The peptide sequence in bold type was used for the preparation of the anti-h-GOLSYN antibody. (B) Extracts (20 μg/lane) of HeLa, NIH3T3, L929, and J774 cells were separated by SDS-PAGE on a 7.5% slab gel and immunoblotted with anti-GOLSYN antibody in the absence (lanes 1–4) or presence (lanes 5–8) of an excess amount of the peptide used for the preparation of anti-GOLSYN antibody. (C) Lysates (50 μg/lane) prepared from various mouse tissues were separated on a 7.5% SDS-PAGE and analyzed by immunoblotting with anti-GOLSYN antibody as described in Materials and Methods. Left panel: various tissues including brain; right panel: various regions of the central nervous system. Solid and open arrowheads indicate the positions of m-Golsyn protein and β-tubulin, respectively.
Next, we determined the expression level of m-Golsyn protein in various mouse tissues by use of this antibody. m-Golsyn was expressed in all the tissues examined (brain, heart, lung, liver, pancreas, stomach, small intestine, kidney, spleen, and testis), except skeletal muscle (Fig. 3C, upper left panel). We also examined the expression of m-Golsyn protein in the central nervous system. A similar level of m-Gol-syn protein was detected in the various regions of the brain (olfactory bulb, cerebral cortex, hippocampus, striatum, hypothalamus, midbrain, and cerebellum), medulla pons, and spinal cord (Fig. 3C, upper right panel). These results thus indicate that this protein was expressed in both peripheral tissues and the central nervous system.
Immunohistochemical Analysis of m-Golsyn Protein in Mouse Brain
To examine the regional distribution of m-Golsyn protein in the intact brain, we immunostained mouse brain slices with anti-GOLSYN antibody (Fig. 4). Signals were detected in various regions of coronal and sagittal sections of the mouse brain (Fig. 4A and I, respectively). These staining patterns were not observed if brain slices were stained with anti-GOLSYN antibody in the presence of an excess amount of the peptide used for the generation of the anti-GOLSYN antibody (Fig. 4B and J). A high level of m-Golsyn protein was detected in the cerebral cortex, pyramidal cell layer of the hippocampus, piriform cortex, hypothalamus, and Purkinje cell layer of the cerebellum (Fig. 4C, D, E, F, K, and M), and the highest level was found in the choroid plexus ependymal cells of the third, fourth, and lateral ventricles (Fig. 4G, H, L, and N).
Figure 4.
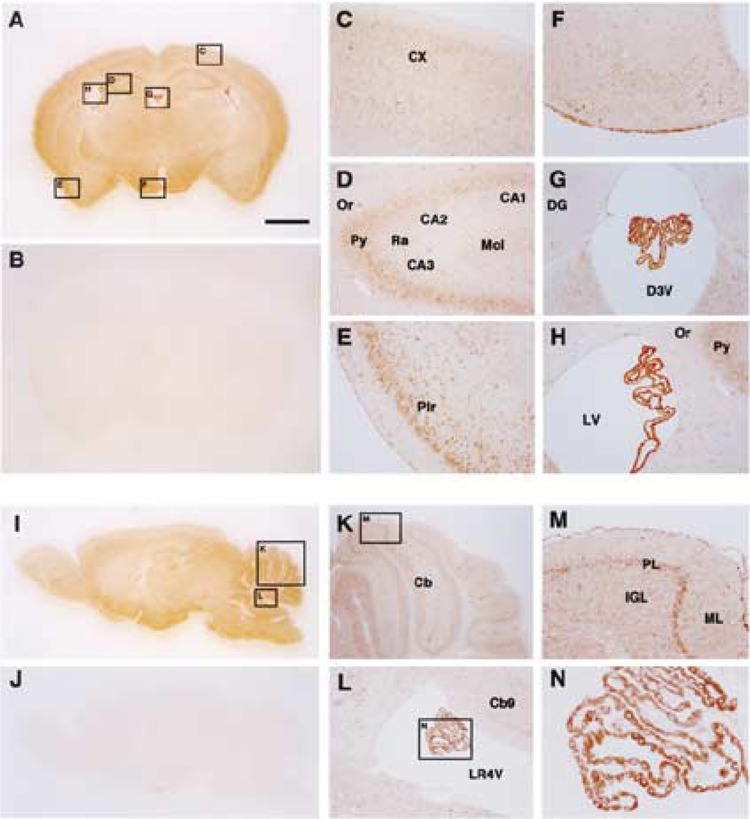
Immunohistochemical analysis of m-Golsyn protein in mouse brain. Coronal (A–H) and sagittal (I–N) sections of the mouse brain were stained with anti-GOLSYN antibody in the presence (B and J) or absence (A to N except B and J) of an excess amount of the peptide used for the preparation of anti-GOLSYN antibody. Regions indicated by boxes C to H in (A) are magnified and shown in (C) to (H), respectively. Boxes K and L in (I) are magnified and shown in (K) and (L), respectively. CX, cerebral cortex; Or, oriens layer of the hippocampus; Py, pyramidal cell layer of the hippocampus; CA1, CA2, and CA3, CA1, CA2, and CA3 areas of the hippocampus; Ra, stratum radiatum of the hippocampus; Mol, molecular cell layer of the hippocampus; Pir, pirform cortex; DG, dendate gyrus; D3V, third ventricle; LV, lateral ventricle; Cb, cerebellum; LR4V, fourth ventricle; PL, Purkinje cell layer of the cerebellum; ML, molecular layer of cerebellum; IGL, inner granular layer of cerebellum. Scale bar: 1 mm.
m-Golsyn Protein Expressed in Neuronal Cells But Not in Glial Cells
We next performed a double-label immunofluores-cence study using antibodies specific for NeuN and GFAP as a neuronal marker and a glial one, respectively. Double-stained sections of the piriform cortex revealed that m-Golsyn protein was present in NeuN-positive cells but not in GFAP-positive ones (Fig. 5), indicating specific expression of this protein in neu-ronal cells. Furthermore, m-Golsyn protein was found Predominantly in the perikaryon of the neuronal cells (Fig. 5B and D).
Figure 5.
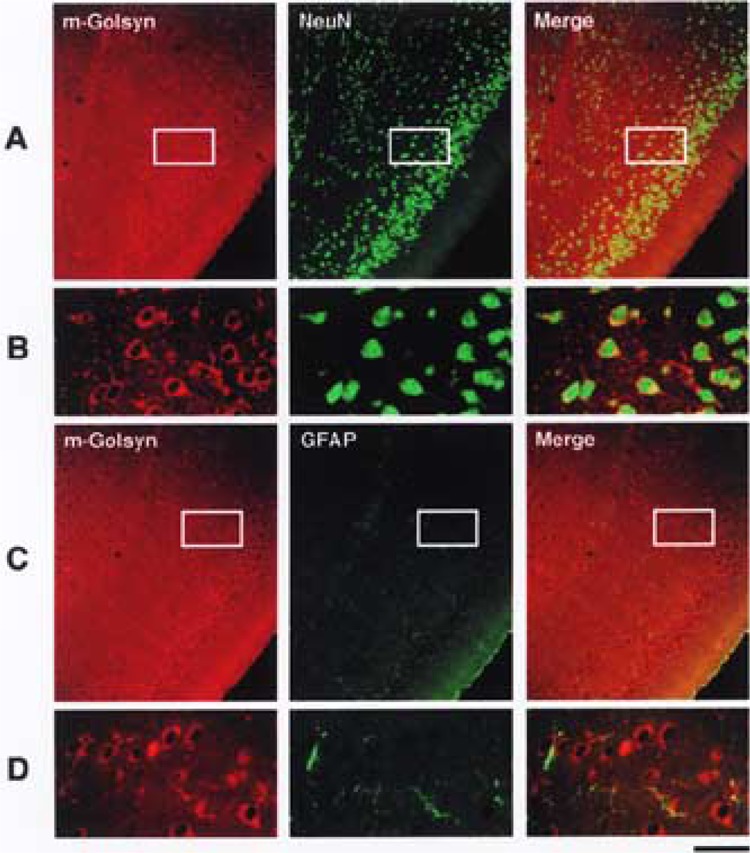
Specific expression of m-Golsyn protein in neuronal cells of mouse brain. Localization of m-Golsyn, NeuN, and GFAP in mouse piriform cortex was analyzed as described in Materials and Methods. Enlarged photographs of the boxed regions in (A) and (C) are shown in (B) and (D), respectively. m-Golsyn and NeuN or GFAP are displayed in red and green, respectively. Scale bar: 135 μm (A, C) and 30 μm (B, D).
m-Golsyn Protein Localized in Membranes of Organelles Including Endoplasmic Reticulum
We next carried out the subcellular fractionation of mouse cerebral cortex by differential centrifugation (Fig. 6A). Immunoblot analysis of the subcellular fractions indicated that m-Golsyn protein was detected in the pelleted fractions, (SM, SV, and P), but not in the soluble fractions (S and PC) (Fig. 6B). Immunoblot analysis using antibodies specific for synaptophysin, syntaxin 6, and protein disulfide isomerase (PDI), marker proteins for synaptic vesicle, Golgi apparatus, and endoplasmic reticulum, respectively, revealed that synaptic vesicles were abundant in SV and Golgi apparatus and endoplasmic reticulum, in P. Because m-Golsyn was abundant in the SV and P fractions, we further fractionated SV and P by centrifugation with a stepwise sucrose gradient (Fig. 6C). In the fractionation of P, similar levels of m-Golsyn protein were recovered in the fractions A, B, and C. Fraction C was rich in endoplasmic reticulum, because only PDI among the marker proteins was detected in the fraction C. Thus, it appears that a substantial amount of m-Golsyn protein was located in the endoplasmic reticulum. In the fractionation of SV, synaptophysin was recovered in both fractions B and C, whereas no m-Golsyn protein was detected in the fraction C. These results indicate that m-Golsyn protein is localized mainly in the membranes of the endoplasmic reticulum.
Figure 6.
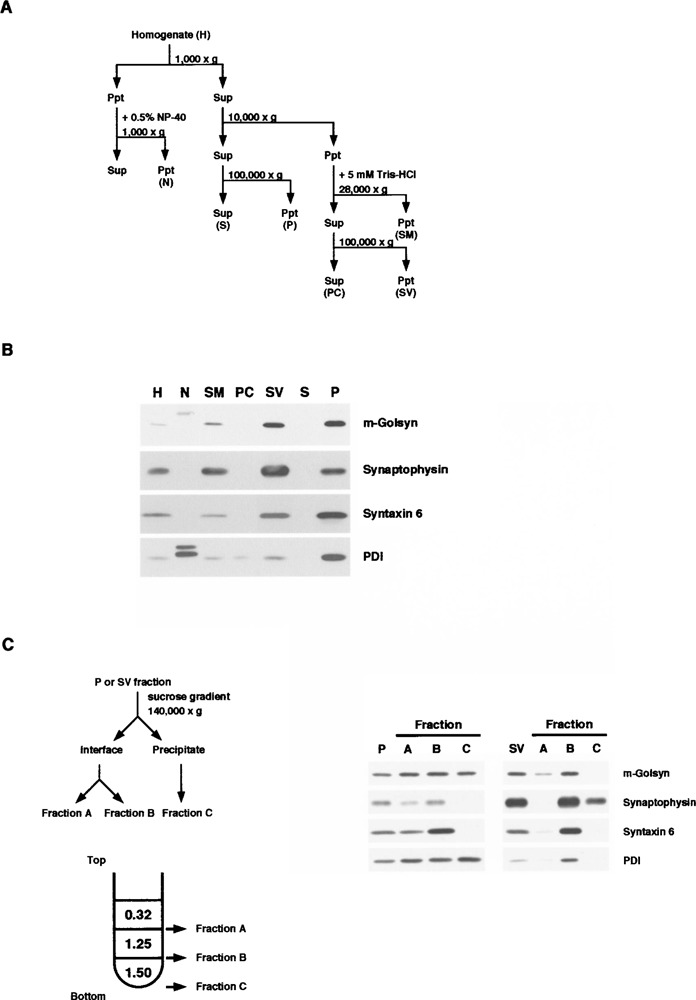
Subcellular distribution of m-Golsyn protein in mouse cerebral cortex. (A) Procedure for subcellular fractionation of mouse cerebral cortex. Homogenates were separated into fractions enriched in nuclei (N), 100,000 × g supernatant (S), 100,000 × g precipitate (P), synaptic plasma membrane (SM), presynaptic cytosol (PC), and synaptic vesicle (SV) by differential centrifugation. (B) Fractions were prepared as shown in (A), and an aliquot (20 μg protein) of each of these fractions was resolved by 7.5% SDS-PAGE and subjected to immunoblot analysis with antibodies against GOLSYN, synaptophysin, syntaxin 6, or PDI. Synaptophysin, syntaxin 6, and PDI were used as markers for synaptic vesicle, Golgi apparatus, and endoplasmic reticulum, respectively. Solid and gray arrowheads indicate the position of m-Golsyn and PDI, respectively. (C) P and SV fractions, prepared as shown in (A), were fractionated by ultracentrifugation of a sucrose gradient and subjected to immunoblot analysis.
DISCUSSION
In this study, we isolated cDNAs for the mouse or-tholog of the h-GOLSYN gene, termed this gene m-Golsyn, and determined its genomic structure. m-Golsyn gene was mapped to chromosome 15B3.2, which is syntenic to human chromosome 8q23. As depicted in Figure 7, m-Golsyn was composed of 8 exons distributed over a 115-kb region, whereas h-GOLSYN was composed of 9 exons. Exons 2 to 8 of m-Golsyn shared about 85% identity with exons 3 to 9 of h-GOLSYN. In contrast, exons 1a and 1b of m-Golsyn gene had lower similarity with exons 1 and 2 of h-GOLSYN. Because exons 1a and 1b of m-Golsyn and exons 1 and 2 of h-GOLSYN each included a protein-coding region, m-Golsyn protein had N-terminal amino sequence extremely different from that of h-GOLSYN protein.
Figure 7.
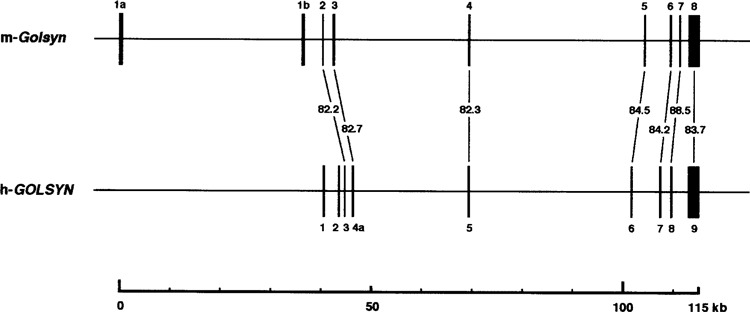
Schematic representation of exon–intron structure of m-Golsyn and h-GOLSYN gene. Boxes indicate the position of exons. Horizontal lines interconnecting exons represent introns. The numbers indicate the similarity between m-Golsyn and h-GOLSYN gene at the nucleotide sequence level.
Three types of mRNAs, named types 1a, 1b, and 2, were produced from the m-Golsyn gene. Type 1 and 2 transcripts were generated by the use of transcription initiation point upstream of exon 1a and exon 1b, respectively. Type 1 mRNAs were expressed only in the brain, whereas type 2 was ubiquitously expressed in various tissues including the brain. We found two potential N-myc binding sites and three potential Sp1 ones within the 1-kb upstream region of exon 1a and exon 1b, respectively. Moreover, one TATA-like box, which is seen in the promoter region of genes showing tissue-specific expression, was present 142 bp upstream of exon 1a, but not upstream of exon 1b. N-myc is a transcription factor that regulates transcription of various genes involved in neuro-genesis (9,24,25), whereas Sp1 can bind to the GC box (8), which is often present in the promoter region of housekeeping genes and regulates ubiquitous expression of these genes (5,15,21). Thus, the expression pattern of type 1 and 2 mRNAs may be explained by tissue-specific expression of transcription factors such as N-myc and Sp1.
m-Golsyn type 1a and 1b mRNAs could be translated into m-Golsyn A and B, respectively, with different N-terminal sequences, whereas type 2 mRNA would be translated into m-Golsyn C, with an amino-terminal sequence different from that of m-Golsyn A or B (see Fig. 1). In this study, we examined the expression of m-Golsyn protein in various mouse tissues by Western blot analysis using anti-GOLSYN antibody. This antibody can recognize m-Golsyn A and C but not m-Golsyn B, because the antigen used for the preparation of the antibody had a sequence common to the N-terminal sequence of m-Golsyn A and C. Because type 1 mRNAs were expressed only in the brain, and type 2 was ubiquitously expressed in various tissues including the brain, we expected to detect two bands of m-Golsyn protein in the brain and one band in various tissues other than the brain. However, m-Golsyn protein was detected as a single band with a molecular mass of approximately 90 kDa in all of the tissues except for skeletal muscle. Because the expression level of type 1a mRNA was low, as determined by RT-PCR analysis (see Fig. 2B), and a single band migrated at a similar position in all the tissues studied, m-Golsyn C, but not m-Golsyn A, would seem to be the main product from the m-Golsyn gene. It is conceivable that m-Golsyn A is expressed at very low level or in restricted regions of the brain.
m-Golsyn protein was expressed in various regions of the brain including cerebral cortex, hippocampus, and cerebellum. Furthermore, double staining for m-Golsyn and NeuN or GFAP, which is a marker protein for neuronal cells or glial cells, respectively (4,16), showed the expression of m-Golsyn protein in neuronal cells but not in glial ones. Thus, m-Golysn protein, possibly m-Golsyn C, was specifically expressed in neuronal cells in various regions of the brain. Interestingly, a high-level expression of m-Golsyn protein was found in choroid plexus ependymal cells (CPECs) of the third, fourth, and lateral ventricles. CPECs are the sites for the production of cerebrospinal fluid and have the ability to promote extension of regenerating axons when grafted into the spinal cord dorsal funiculus of rats (2,11,12). The components of cerebrospinal fluid are known to be similar to those of aqueous humor (3), which is produced from the ciliary body in ocular tissues. Because a high level of m-Golsyn protein was expressed in the ocular tissues including the ciliary body (F. Ito and E. Funakoshi, unpublished data), this protein may play an important role in secretion processes. The h-GOLSYN gene was identified on human chromosome 8q23.2, to which a locus responsible for adult-onset POAG (GLC1D) had been mapped based on linkage data from a large North American family (29). In this context, GOLSYN may be involved in the pathogenesis of POAG by impairing the secretion process in the ciliary body.
All three m-Golsyn proteins had a coiled coil and a transmembrane domain as putative functional domains (see Fig. 1C). These characteristic domains are well conserved between m-Golsyn and h-GOLSYN. Homology search analysis of the deduced amino acid sequences from m-Golsyn transcripts by use of a protein sequence database revealed that m-Golsyn and syntaphilin shared a significant homology. Syntaphilin had been isolated from a human brain cDNA library by the yeast two-hybrid screening system using the C-terminal half of syntaxin-1A as bait (14). Syntaphilin, like m-Golsyn protein, possesses a trans-membrane domain and a coiled-coil motif and is thought to function as a molecular clamp that controls the availability of free syntaxin-1 for the assembly of SNARE complex (14). Structural similarity between m-Golsyn and syntaphilin may indicate that the m-Golsyn protein plays an important function in intra-cellular vesicle transport in neuronal cells.
A substantial amount of m-Golsyn protein was detected in the endoplasmic reticulum (ER) fraction obtained from the mouse cerebral cortex (see Fig. 6). However, we previously reported that h-GOLSYN protein was mainly localized in the membranes of the Golgi apparatus in HeLa cells (6). When h-GOLSYN protein with a deletion of its N-terminal region (amino acids 1–354) was expressed in HeLa cells, the mutant protein was accumulated in the ER but not in the Golgi apparatus (F. Ito and E. Funakoshi, unpublished data). This finding indicates the importance of the N-terminal region of h-GOLSYN protein for its intracellular localization in HeLa cells. It also raises the possibility that nascent h-GOLSYN protein is first sorted to ER, and then transported to the Golgi apparatus. Because h-GOLSYN and m-Golsyn appear to be ubiquitously expressed, they may be regulators of vesicle transport in all cell types. However, the cellular location of both proteins may vary from cell to cell. For example, the proteins are retained in the ER rather than in the Golgi apparatus in neuronal cells, and vice versa in HeLa cells. It would be of interest to study the subcellular distribution of h-GOLSYN in mouse brain cells transfected with cDNA encoding h-GOLSYN protein.
In summary, we demonstrated that the m-Golsyn gene consisted of 8 exons spanning 115 kb on chromosome 15B3.2 and that the gene could produce three isoforms, namely, m-Golsyn A, B, and C, with different amino-terminal sequences. We also showed abundant expression of the protein in neuronal cells of the brain. Our findings suggest that m-Golsyn protein plays an important role in intracellular protein transport in various cell types including the neuronal cells of the brain. The sequence information on the m-Golsyn gene will be extremely useful for generating genetically altered mice. Further studies including knockdown of m-Golsyn protein expression will provide us a clue to understand the biological function of this protein.
ACKNOWLEDGMENTS
This work was supported in part by Grant-in-Aid for Young Scientists (B), 16790066, 2004, from the Ministry of Education, Science, Sports and Culture, Japan, and by a Fund for “Research for the Future” Program from the Japan Society for the Promotion of Science (JSPS) and Ministry of Education, Culture, Sports, Science and Technology (MEXT).
REFERENCES
- 1. Altschul S. F.; Gish W.; Miller W.; Myers E. W.; Lipman D. J. Basic local alignment search tool. J. Mol. Biol. 215:403–410; 1990. [DOI] [PubMed] [Google Scholar]
- 2. Chakrabortty S.; Kitada M.; Matsumoto N.; Taketomi M.; Kimura K.; Ide C. Choroid plexus ependymal cells enhance neurite outgrowth from dorsal root ganglion neurons in vitro. J. Neurocytol. 29:707–717; 2000. [DOI] [PubMed] [Google Scholar]
- 3. Davson H. A comparative study of the aqueous humour and cerebrospinal fluid in the rabbit. J. Physiol. 129:111–133; 1955. [DOI] [PMC free article] [PubMed] [Google Scholar]
- 4. Debus E.; Weber K.; Osborn M. Monoclonal antibodies specific for glial fibrillary acidic (GFA) protein and for each of the neurofilament triplet polypeptides. Differentiation 25:193–203; 1983. [DOI] [PubMed] [Google Scholar]
- 5. Dynan W. S.; Tjian R. Control of eukaryotic messenger RNA synthesis by sequence-specific DNA-binding proteins. Nature 316:774–778; 1985. [DOI] [PubMed] [Google Scholar]
- 6. Funakoshi E.; Nakagawa K. Y.; Hamano A.; Hori T.; Shimizu A.; Asakawa S.; Shimizu N.; Ito F. Molecular cloning and characterization of gene for Golgi-localized syntaphilinrelated protein on human chromosome 8q23. Gene 344:259–271; 2005. [DOI] [PubMed] [Google Scholar]
- 7. Glowinski J.; Iversen L. L. Regional studies of catecholamines in the rat brain. I. The disposition of [3H]norepinephrine, [3H]dopamine and [3H]dopa in various regions of the brain. J. Neurochem. 13:655–669; 1996. [DOI] [PubMed] [Google Scholar]
- 8. Hagen G.; Muller S.; Beato M.; Suske G. Sp1-mediated transcriptional activation is repressed by Sp3. EMBO J. 13:3843–3851; 1994. [DOI] [PMC free article] [PubMed] [Google Scholar]
- 9. Hirning U.; Schmid P.; Schulz W. A.; Rettenberger G.; Hameister H. A comparative analysis of N-myc and c-myc expression and cellular proliferation in mouse organogenesis. Mech. Dev. 33:119–125; 1991. [DOI] [PubMed] [Google Scholar]
- 10. Huttner W. B.; Schiebler W.; Greengard P.; De Camilli P. Synapsin I (protein I), a nerve terminal-specific phosphoprotein. III. Its association with synaptic vesicles studied in a highly purified synaptic vesicle preparation. J. Cell Biol. 96:1374–1388; 1983. [DOI] [PMC free article] [PubMed] [Google Scholar]
- 11. Ide C.; Kitada M.; Chakrabortty S.; Taketomi M.; Matsumoto N.; Kikukawa S.; Mizoguchi A.; Kawaguchi S.; Endoh K.; Suzuki Y. Grafting of choroid plexus ependymal cells promotes the growth of regenerating axons in the dorsal funiculus of rat spinal cord: A preliminary report. Exp. Neurol. 167:242–251; 2001. [DOI] [PubMed] [Google Scholar]
- 12. Kimura K.; Matsumoto N.; Kitada M.; Mizoguchi A.; Ide C. Neurite outgrowth from hippocampal neurons is promoted by choroid plexus ependymal cells in vitro. J. Neurocytol. 33:465–476; 2004. [DOI] [PubMed] [Google Scholar]
- 13. Laemmli U. K. Cleavage of structural proteins during the assembly of the head of bacteriophage T4. Nature 227:680–685; 1970. [DOI] [PubMed] [Google Scholar]
- 14. Lao G.; Scheuss V.; Gerwin C.M.; Su Q.; Mochida S.; Rettig J.; Sheng Z.H. Syntaphilin: A syntaxin-1 clamp that controls SNARE assembly. Neuron 25:191–201; 2000. [DOI] [PubMed] [Google Scholar]
- 15. Mitchell P. J.; Carothers A. M.; Han J. H.; Harding J. D.; Kas E.; Venolia L.; Chasin L. A. Multiple transcription start sites, DNase I-hypersensitive sites, and an opposite-strand exon in the 5′ region of the CHO dhfr gene. Mol. Cell. Biol. 6:425–440; 1986. [DOI] [PMC free article] [PubMed] [Google Scholar]
- 16. Mullen R. J.; Buck C. R.; Smith A. M. NeuN, a neuronal specific nuclear protein in vertebrates. Development 116:201–211; 1992. [DOI] [PubMed] [Google Scholar]
- 17. Ogita K.; Nitta Y.; Watanabe M.; Nakatani Y.; Nishiyama N.; Sugiyama C.; Yoneda Y. In vivo activation of c-Jun N-terminal kinase signaling cascade prior to granule cell death induced by trimethyltin in the dentate gyrus of mice. Neuropharmacology 47:619–630; 2004. [DOI] [PubMed] [Google Scholar]
- 18. Okui M.; Ide T.; Morita K.; Funakoshi E.; Ito F.; Ogita K.; Yoneda Y.; Kudoh J.; Shimizu N. High-level expression of the Mnb/Dyrk1A gene in brain and heart during rat early development. Genomics 62:165–171; 1999. [DOI] [PubMed] [Google Scholar]
- 19. Oyler G. A.; Higgins G. A.; Hart R. A.; Battenberg E.; Billingsley M.; Bloom F. E.; Wilson M. C. The identification of a novel synaptosomal-associated protein, SNAP-25, differentially expressed by neuronal subpopulations. J. Cell Biol. 109:3039–3052; 1989. [DOI] [PMC free article] [PubMed] [Google Scholar]
- 20. Ray K.; Mukhopadhyay A.; Acharya M. Recent advances in molecular genetics of glaucoma. Mol. Cell. Biochem. 253:223–231; 2003. [DOI] [PubMed] [Google Scholar]
- 21. Reynolds G. A.; Basu S. K.; Osborne T. F.; Chin D. J.; Gil G.; Brown M. S.; Goldstein J. L.; Luskey K. L. HMG CoA reductase: A negatively regulated gene with unusual promoter and 5′ untranslated regions. Cell 38:275–285; 1984. [DOI] [PubMed] [Google Scholar]
- 22. Rezaie T.; Child A.; Hitchings R.; Brice G.; Miller L.; Coca-Prados M.; Heon E.; Krupin T.; Ritch R.; Kreutzer D.; Crick R. P.; Sarfarazi M. Adult-onset primary open-angle glaucoma caused by mutations in optineurin. Science 295:1077–1079; 2002. [DOI] [PubMed] [Google Scholar]
- 23. Sarfarazi M.; Child A.; Stoilova D.; Brice G.; Desai T.; Trifan O. C.; Poinoosawmy D.; Crick R. P. Localization of the fourth locus (GLC1E) for adult-onset primary open-angle glaucoma to the 10p15-p14 region. Am. J. Hum. Genet. 62:641–652; 1998. [DOI] [PMC free article] [PubMed] [Google Scholar]
- 24. Sawai S.; Kato K.; Wakamatsu Y.; Kondoh H. Organization and expression of the chicken N-myc gene. Mol. Cell. Biol. 10:2017–2026; 1990. [DOI] [PMC free article] [PubMed] [Google Scholar]
- 25. Sawai S.; Shimono A.; Wakamatsu Y.; Palmes C.; Hanaoka K.; Kondoh H. Defects of embryonic organogenesis resulting from targeted disruption of the N-myc gene in the mouse. Development 117:1445–1455; 1993. [DOI] [PubMed] [Google Scholar]
- 26. Sheffield V. C.; Stone E. M.; Alward W. L.; Drack A. V.; Johnson A. T.; Streb L. M.; Nichols B. E. Genetic linkage of familial open angle glaucoma to chromosome 1q21-q31. Nat. Genet. 4:47–50; 1993. [DOI] [PubMed] [Google Scholar]
- 27. Stoilova D.; Child A.; Trifan O. C.; Crick R. P.; Coakes R. L.; Sarfarazi M. Localization of a locus (GLC1B) for adult-onset primary open angle glaucoma to the 2cen-q13 region. Genomics 36:142–150; 1996. [DOI] [PubMed] [Google Scholar]
- 28. Stone E. M.; Fingert J. H.; Alward W. L.; Nguyen T. D.; Polansky J. R.; Sunden S. L.; Nishimura D.; Clark A. F.; Nystuen A.; Nichols B. E.; Mackey D. A.; Ritch R.; Kalenak J. W.; Craven E. R.; Sheffield V. C. Identification of a gene that causes primary open angle glaucoma. Science 275:668–670; 1997. [DOI] [PubMed] [Google Scholar]
- 29. Trifan O. C.; Traboulsi E. I.; Stoilova D.; Alozie I.; Nguyen R.; Raja S.; Sarfarazi M. A third locus (GLC1D) for adult-onset primary open-angle glaucoma maps to the 8q23 region. Am. J. Ophthalmol. 126:17–28; 1998. [DOI] [PubMed] [Google Scholar]
- 30. Wirtz M. K.; Samples J. R.; Kramer P. L.; Rust K.; Topinka J. R.; Yount J.; Koler R. D.; Acott T. S. Mapping a gene for adult-onset primary open-angle glaucoma to chromosome 3q. Am. J. Hum. Genet. 60:296–304; 1997. [PMC free article] [PubMed] [Google Scholar]
- 31. Wirtz M. K.; Samples J. R.; Rust K.; Lie J.; Nordling L.; Schilling K.; Acott T. S.; Kramer P. L. GLC1F, a new primary open-angle glaucoma locus, maps to 7q35-q36. Arch. Ophthalmol. 117:237–241; 1999. [DOI] [PubMed] [Google Scholar]


