

Abstract
Stannin (Snn) is a highly conserved, vertebrate protein whose cellular function is unclear. We have recently demonstrated in human umbilical vein endothelial cells (HUVECs) that Snn gene expression is significantly induced by tumor necrosis factor-α (TNF-α) in a protein kinase C-ε (PKC-ε)-dependent manner. In HUVEC, TNF-α stimulation of HUVECs results in altered gene expression, and a slowing or halting of cell growth. An initial set of experiments established that Snn knockdown via siRNA, prior to TNF-α treatment, resulted in a significant inhibition of HUVEC growth compared to TNF-α treatment alone. In order to assess how Snn may be involved in TNF-α signaling in HUVEC growth arrest, we performed microarray analysis of TNF-α-stimulated HUVECs with and without Snn knockdown via siRNA. The primary comparison made was between TNF-α-stimulated HUVECs and TNF-α-exposed HUVECs that had Snn knocked down via Snn-specific siRNAs. Ninety-six genes were differentially expressed between these two conditions. Of particular interest was the significant upregulation of several genes associated with control of cell growth and/or the cell cycle, including interleukin-4, p29, WT1/PRKC, HRas-like suppressor, and MDM4. These genes act upon cyclin D1 and/or p53, both of which are key regulators of the G1 phase of the cell cycle. Functional studies further supported the role of Snn in cell growth, as cell cycle analysis using flow cytometry shows a significant increase of G1 cell cycle arrest in HUVECs with Snn knockdown in response to TNF-α treatment. Together these studies suggest a functional role of Snn in regulation of TNF-α-induced signaling associated with HUVEC growth arrest.
Key words: Stannin, TNF-α, HUVEC, Microarray, Cell growth, Cell cycle
STANNIN (Snn) is an 88-amino acid protein that is highly conserved throughout vertebrate evolution (7,30). Rat and mouse Snn amino acid sequences are 100% identical, and human Snn differs by only two amino acids at the C-terminus. Further, human and mouse Snn nucleotide sequences are 90% identical (7). Such a highly conserved nature implies an important role for Snn in normal cellular function. To this end, we have previously demonstrated that Snn is necessary, but not sufficient, for trimethyltin (TMT) toxicity (35). In addition, we have recently demonstrated that Snn mRNA expression is induced by tumor necrosis factor-α (TNF-α) treatment in a protein kinase C-ε (PKC-ε)-dependent manner in human umbilical vein endothelial cells (HUVEC) (30). This implies a potential functional role of Snn in TNF-α-stimulated HUVECs.
TNF-α is known to be involved in many cellular processes including: apoptosis, inflammation, and regulation of cellular proliferation (4,21,22,26,29). TNF-α is a pleiotropic cytokine capable of regulating many cellular processes in a dose- and cell type-specific manner. In endothelial cells, TNF-α slows cell growth and induces activation/differentiation (9,18,28). Specifically, TNF-α causes an increase in the expression of cellular adhesion molecules, such as E-selectin, and alters the expression and activity of proteins involved in cytoskeletal rearrangement such as integrins and cdc42 (9,10). Further, TNF-α activates many signaling molecules leading to growth arrest including interleukin (IL)-4 (15).
The functional analysis of native Snn protein is difficult due to the lack of specific, high-affinity antisera. Without a Snn-specific antibody, alternative methods are required to determine the functional role of Snn in normal cellular processes. Thus, in this study, microarray technology was utilized in order to elucidate the potential role of Snn in HUVEC cell growth in response to TNF-α exposure. Specifically, we examined the effects of Snn knockdown, via siRNA, on the HUVEC response to TNF-α. Detailed analysis revealed that several critical genes associated with cell cycle, transcription, and cytoskeletal integrity were significantly altered. Knockdown of Snn expression via siRNA resulted in further inhibition of cell growth beyond that observed with TNF-α alone, indicating a potential regulatory role of Snn in cell cycle control at the G1/S checkpoint.
MATERIALS AND METHODS
Cell Culture
Pooled HUVEC were obtained from Cambrex (East Rutherford, NJ). HUVECs were maintained as recommended by Cambrex. Briefly, cells were cultured in the chemically defined EGM™ medium (Cambrex, East Rutherford, NJ) containing 2% fetal bovine serum (FBS). For all experiments, HUVECs were passage 3–5. In addition, HUVECs were allowed 24 h of undisturbed growth prior to any experimental manipulation after plating. TNF-α (Roche, Indianapolis, IN) was dissolved in sterile PBS and administered at 200 ng/ml.
Microarray Fabrication
A total of 9998 amine-modified, human 50-meroligonucleotide probes (MWG Biotech, Germany) were printed onto epoxysilane slides (Schott-Nexterion) using a MicroGrid II robotic microarrayer (Genomic Solutions, Ann Arbor, MI). The printed arrays were then incubated at 45% relative humidity for 8 h to allow for optimal binding of the probe to the surface of the slide, then washed in 0.02% SDS for 2 min at room temperature. The slides were rinsed with several volumes of distilled, deionized water, immediately spun dry via centrifugation, then stored in a dessicator prior to their use.
Microarray cDNA Probe Synthesis and Indirect Labeling With AlexaFluor 555 and 647
A total of 10 μg RNA from each sample or 10 μg of universal reference RNA (Stratagene, La Jolla, CA) was reverse transcribed to generate cDNA probes for hybridization. Amino-modified dUTP and dATP were incorporated into each transcript using Super Script™ III RT (Invitrogen Corporation, Carlsbad, CA) per manufacturer’s protocol. After reverse transcription, template RNA was degraded by base hydrolysis, and the reaction neutralized with 1 N HCl. The reaction volume was brought up to 500 μl with water and transferred to Microcon® Centrifugal Filter Units (Millipore, Billerica, MA) for removal of unincorporated nucleotides and primers.
The concentrated cDNA was coupled to the active form of either Alexa Fluor® 555 (reference group) or 647 (experimental groups) labeling conjugates (Molecular Probes, Eugene, OR). Dye-labeled cDNAs were then purified with a low-elution spin column to remove any unreacted dye molecules. Each labeled experimental condition sample was cohybridized with the labeled exogenous universal human reference sample, in a 1:1 ratio of 1500 ng per sample. Directly comparing the experimental samples to the on-chip reference sample enabled indirect comparisons between experimental groups to be met with equal efficiency (6).
Gene Expression Analysis
The scanned images of each microarray were quantitated with Scanarray Express™ image analysis software (Perkin Elmer Life and Analytical Sciences, Inc., Boston). The raw data was then formatted and imported into Genespring 7.2 (Silicon Genetics, Redwood City, CA) for normalization and comparative analyses. A LOWESS curve was used to normalize the two-color gene expression dataset and adjust the control value (universal human reference) for each measurement. An additional normalization step was applied to pair each experimental condition against the average intensity of the control condition array replicates. The measurement for each gene present in the experimental samples was divided by the median of that gene’s measurements in the corresponding control sample. The control measurements had to be flagged as being present or the data were not reported.
Cell Growth
The trypan blue exclusion test was used as a measure of cell growth. HUVECs were incubated in 0.2% trypan blue (Sigma, St. Louis, MO) diluted in phosphate-buffered saline (PBS) and then subsequently washed once with PBS. The numbers of normal and blue-stained, dead cells were counted in four independent microscopic fields per culture, with three independent cultures being used for each condition (12 total fields). The number of viable cells was compared in each treatment condition with the initial plating density, which was considered 100% for the purposes of relative viability.
RNA Isolation/cDNA Synthesis
RNA isolation was accomplished using the RNeasy kit, according to the protocol recommended by the manufacturer (Qiagen, Valencia, CA). Briefly, HUVECs were harvested using 0.05% trypsin-EDTA and pelleted at 2000 × g. Cells were then resuspended in 350 μl of RLT cell lysis buffer and homogenized using QIAshredder homogenization columns (Qiagen, Valencia, CA). The homogenized mixture was combined with an equal volume of 70% ethanol and added to an Rneasy RNA isolation column and spun at 8000 × g for 15 s. The RNA bound on the column was washed three times, and finally eluted with Rnase-free water as indicated by the manufacturer. The synthesis of cDNA for QRT-PCR was carried out using the First Strand cDNA Synthesis Kit (MBI Fermentas, Hanover, MD). This kit employs a standard M-MLV reverse transcriptase reaction and was used according to the recommendations of the manufacturer.
Quantitative Real-Time PCR (QRT-PCR)
The cDNA template from HUVECs were normalized based on their relative expression of β-actin. To detect human Snn, the following primers and probe were used to amplify a 100-bp product corresponding to bases 222-322 of the mRNA: forward primer: 5′-TTG TCA TCC TCA TTG CCA TC-3′; reverse primer: 5′-GCT CTC CTC GTC CTC TGA CT-3′; probe: 5′-CCT GGG CTG CTG GTG CTA CCT-3′.
Predeveloped 20X primer-probe assay kits (Applied Biosystems, Foster City, CA) were used for the following genes: β-Actin, E-selectin, cdc42BP, HRasLS, PRKC, phospholipase A2, GCIP, IL-4, and MDM4.
Reactions were carried out using a protocol from Qiagen (Valencia, CA). The PCR program was as follows: step 1—95°C for 15 min, step 2—95°C for 15 s, step 3—60°C for 1 min, with steps 2 and 3 repeated for 40 cycles. All reactions were carried out using the ABI Prism 7700 Lightcycler.
siRNA Construction
Snn siRNA was constructed using the Silencer™ siRNA Construction Kit (Ambion, Austin, TX). The following oligonucleotides were utilized to construct siRNA (only the sense strand is given, shown without T7 adapter sequence): Snn siRNA 1: 5′-AAG GAA CCC TTC CTG CTG GTG-3′ and Snn siRNA 2: 5′-AAG GGA CCG TGC GTG GAG AGA-3′.
The procedure for contructing the Snn siRNA was as outlined by Ambion. In brief, sense and antisense DNA oligonucleotides, each containing an 8 nucleotide sequence complementary to the T7 promoter, were separately hybridized to a T7 promoter and made double-stranded with Exo-Klenow DNA polymerase. Each reaction was mixed with a T7 RNA polymerase in order to generate the siRNA templates. Both the sense and antisense reactions were combined and incubated to form dsRNA. Finally, each double-stranded siRNA was purified and eluted into nuclease-free water. The efficiency of this siRNA has been previously validated (30).
Transfection of siRNA
All siRNA used in these studies was transfected into HUVECs using the siPORT Lipid reagent (Ambion, Austin, TX). Briefly, siPORT Lipid reagent was diluted in Opti-MEM I (Gibco, Carlsbad, CA) and allowed to incubate at room temperature for 20 min. Each siRNA was separately diluted in Opti-MEM I and allowed to incubate at room temperature for 5 min. The mixtures containing the siPORT Lipid and siRNA were then combined and allowed to incubate at room temperature for 15 min. HUVECs were washed in Opti-MEM I, then fresh Opti-MEM I was added to the cells in place of EGM media. The siPORT Lipid/siRNA mixture was then overlaid dropwise onto the cells. In all experiments, a 50:50 mix of two Snn-specific siRNA was used.
Statistical Analysis
After normalizations, the TNF-α alone and combo groups were compared using a one-way ANOVA with a cutoff p-value of p < 0.001. The results of this ANOVA were then filtered to show only those genes that differed between the two groups by 2.5-fold or more. For the QRT-PCR and cell cycle experiments significance was determined using a Student’s t-test between treatment conditions and the control or vehicle condition, unless otherwise specified. A p-value of <0.05 was considered significant in all cases. Each experiment consisted of at least three replicates per condition. The growth curve presented in Figure 6 was analyzed using a two-way analysis of variance (ANOVA) followed by a Fisher’s least significant difference (LSD) post hoc test.
Figure 6.
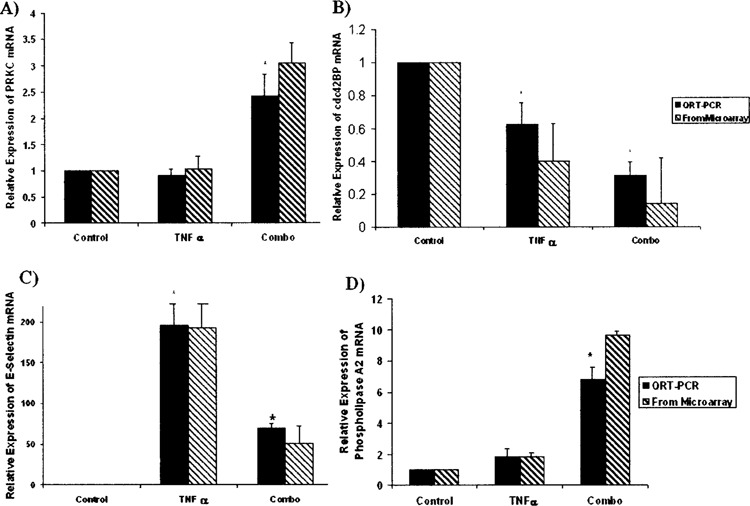
Differential expression of genes involved in cell growth, transcription, and cell adhesion. (A) No significant difference in WT1/PRKC mRNA was observed between the control and TNF-α groups. A significant upregulation of WT1/PRKC mRNA was observed between the control and Combo groups. (B) TNF-α administration results in a significant downregulation of cdc42BP mRNA, while the levels of cdc42BP mRNA in the Combo group are significantly decreased compared to both the control and TNF-α alone conditions. (C) E-Selectin is known TNF-α-responsive gene in HUVECs; a significant increase in E-selectin mRNA was observed between the control and TNF-α alone groups. This upregulation was dampened, though still significant, when the control and Combo groups were compared. (D) Phospholipase A2 mRNA levels are unaltered by TNF-α administration alone, but are significantly altered when TNF-α is administered under conditions of Snn knockdown. All expression levels are relative to the control condition. *p < 0.05 (Student’s t-test, n = 3).
RESULTS
Knockdown of Snn Gene Expression Enhances TNF-α-Mediated HUVEC Cell Growth Inhibition
TNF-α is known to inhibit the growth of HUVECs in culture (12,20,25). To examine the functional role of Snn in TNF-α inhibition of HUVEC proliferation, the effect of Snn knockdown using siRNA was examined.
Snn knockdown was achieved by using previously validated, Snn-specific siRNAs (30). Cell growth was assessed in order to determine the role of Snn in TNF-α-mediated inhibition of HUVEC growth. HUVECs were initially plated at a density of 2.0 × 10⁵ cells per condition. After 24 h of growth, HUVECs were then transfected with 20 nM Snn siRNA for 24 h. Subsequently, cells were treated with 200 ng/ml TNF-α for 24 or 48 h. As shown in Figure 1, when Snn was knocked down via siRNA, we observed an additional impairment of HUVEC growth at both 24 and 48 h post-TNF-α exposure. Specifically, knockdown of Snn resulted in approximately 50% of the number of cells being present in culture after 24 and 48 h of exposure to TNF-α relative to HUVEC cells treated with TNF-α alone. Further, a significant decrease was observed in the number of cells treated with Snn siRNA alone compared to vehicle control. Finally, all conditions differed significantly in the number of cells present after 48 h of TNF-α exposure with/without Snn siRNA treatment.
Figure 1.
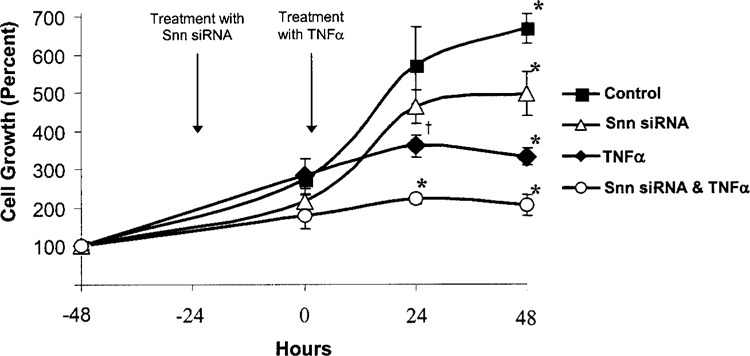
Alteration of HUVEC cell growth by treatment with TNF-α and/or Snn siRNA. Cell numbers were determined using a hemacytometer after treatment with TNF-α (200 ng/ml) for up to 48 h with/without exposure to Snn siRNA (20 nM for up to 72 h). Growth is presented as a percent of the plating density of 2.0 ± 105 cells. Treatment with TNF-α alone resulted in significant inhibition of growth at both 24 and 48 h of exposure (72 and 96 h of growth). Treatment of TNF-α-stimulated HUVECs with Snn siRNA resulted in significant inhibition of cell growth compared with TNF-α alone or siRNA alone and both 24 and 48 h of TNF-α exposure. Treatment of Snn siRNA alone resulted in a significant inhibition of cell growth compared to vehicle-treated controls by 72 h of exposure. *p < 0.05 from each other group at that time point; †p < 0.05 from both vehicle and TNF-α + Snn siRNA groups at that time point (two-way ANOVA, Fishers LSD post hoc test, n = 3). Scrambled siRNAs had no significant effect on growth or TNF-α-mediated growth inhibition.
As a control, a scrambled control siRNA was used in vehicle and TNF-treated cells using the identical protocol shown in Figure 1. After 48 h (72 h total siRNA exposure), neither scrambled siRNA group was significantly different from either untreated (571% vs. 490%) or TNF-treated (360% vs. 371%) groups. This suggests that the effects seen on growth inhibition and TNF-α were specific to the Snn siRNA treatment.
Snn Knockdown Results in Significantly Altered Gene Expression in TNF-α-Stimulated HUVEC
TNF-α stimulates Snn gene expression in a PKC-ε-dependent manner in HUVECs (30). In addition, from our cell growth studies, it appeared that Snn may play a role in HUVEC cell growth. In an effort to better define a potential functional role for Snn in TNF-α signaling in HUVECs, microarray technology was utilized.
Specifically, HUVEC were divided into four independent experimental groups for the analysis of differential gene expression: a control group of HUVECs growing in EGM™ complete medium (control), a group of HUVECs stimulated with a single 200 ng/ml dose of TNF-α (TNF-α alone), a group that was transfected with a 20 nM Snn siRNA mix (Snn siRNA alone), and a group that was transfected with Snn siRNA then stimulated with TNF-α (Combo; see Fig. 2 for experimental design). Results were normalized first in a LOWESS algorithm, then back to the average signal intensity of the control group on a gene-to-gene basis. This second normalization allows for a more meaningful comparison of the other groups to control HUVECs. The control and Snn siRNA alone groups were compared using a one-way ANOVA with a p-value cutoff of p < 0.001 and a 2.5-fold difference in expression filter. A total of eight genes passed this combination of normalizations and statistical tests and, because the purpose of this study was to examine a potential role for Snn in TNF-α signaling, these eight genes were excluded from the final analysis. For clarity, because the significant changes between the control and Snn siRNA alone groups were excluded, the Snn siRNA alone group was not considered further in this study. This same combination of normalizations, filters, and statistical tests was used to compare the TNF-α alone group to the Combo group. These groups proved much more divergent, with 100 genes passing these normalizations and tests. This group of 100 genes was deemed “significantly altered” for the purposes of the remainder of the analysis. A hierarchical cluster diagram of the raw data is shown in Figure 3, with the genes that are upregulated compared to the control condition highlighted in red and the genes that were downregulated compared to the control condition highlighted in green. Of the genes that were deemed significantly altered, an ontological classification is shown in Figure 4. This classification was made using the Database for Annotation, Visualization, and Integrated Discovery (DAVID; apps1.niaid.nih.gov/david/upload.asp). Of the 100 genes to be entered into the DAVID software, 96 were successfully grouped into a biological function with 68.75% being categorized as involved in cell growth and maintenance, signal transduction, or nucleobase, nucleoside, nucleotide, and nucleic acid metabolism.
Figure 2.
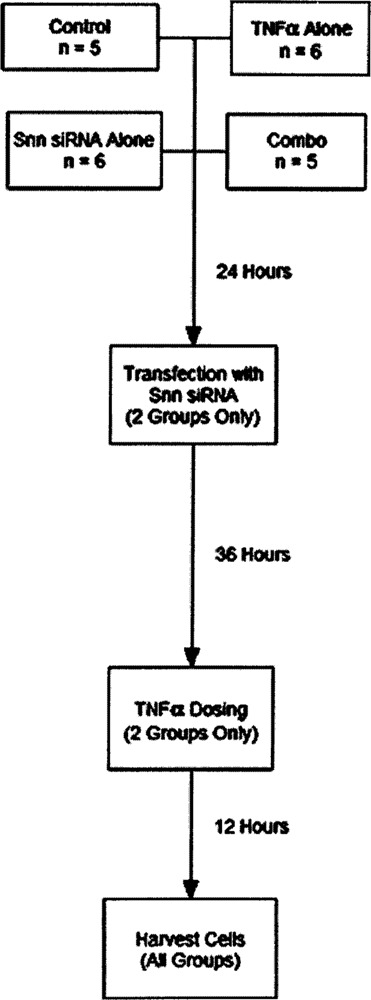
Microarray experimental design. Four groups of HUVECs were plated (two biological replicates per group). The groups were: a control group grown in EGM complete media, a group that was grown as control but that received a 200 ng/ml dose of TNF-α 60 h after plating, a group grown as control that received 20 nM Snn siRNA 24 h after plating, and a “Combo” group that was both transfected with Snn siRNA and dosed with TNF-α at the appropriate time points. Before any treatments, HUVECs were allowed 24 h of undisturbed growth subsequent to plating. The RNA isolated from each plate of HUVECs at the “Harvest” time point was split into three aliquots, each used on a separate microarray for a total of six technical replicates per group (one array each from the control and combo groups did not process correctly and so these groups have n = 5 rather than 6).
Figure 3.
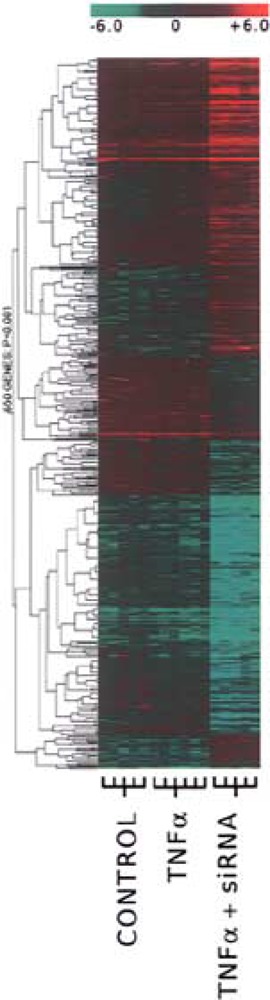
A cluster-based representation of the altered genes across the control, TNF-α only, and Combo treatment groups. Genes that are upregulated relative to the control condition are colored green and genes that are downregulated are colored red. Initial analysis comparing the control condition to the Snn siRNA alone condition resulted in 7 genes out of 9998 being statistically different. Because the two groups were so similar, this condition has been left out of the cluster diagram.
Figure 4.
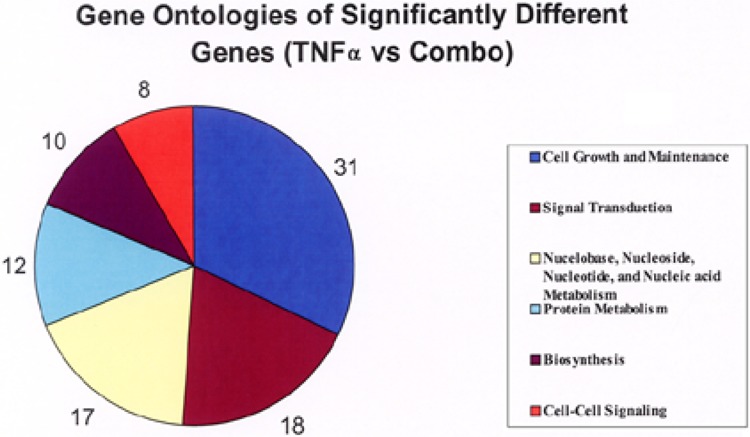
Gene ontologies of significantly different genes (TNF-α vs. Combo groups). After LOWESS normalization of each condition, the TNF-α alone and the Combo groups were normalized to the control condition according to signal intensity. Following these normalizations, a one-way ANOVA was run on the average signal intensity values for the TNF-α alone versus the Combo group (cutoff p-value was 0.001). From the genes that passed this test, those that were 2.5-fold different between groups were assembled as meaningfully different genes. Of the 100 genes that met these criteria, 96 genes were successfully grouped according to ontology using the Database for Annotation, Visualization, and Integrated Discovery. The number of genes that were classified into each ontological classification is noted.
Snn Knockdown Significantly Affects Several Genes Associated With Cell Cycle
The cell growth and maintenance classification represents 33% of the total of significantly altered genes, with signal transduction and nucleobase, nucleoside, nucleotide, and nucleic acid metabolism representing 18.75% and 17.7%, respectively. Because these ontological classifications represented a large majority of the significantly altered genes, we chose to validate our array results by using QRT-PCR on eight genes from these classifications. These genes were: IL-4, p29, PRKC/WT1, MDM4, PLA2, E-selectin, cdc42 binding protein (BP), and human Ras-like suppressor (HRasLS). Three of the eight genes (IL-4, p29, and MDM4) have direct implications for cell cycle regulation at the G1/S checkpoint and seven of the eight (excluding E-selectin) have been described as important for control of cell growth. Interleukin 4 (IL-4) is a soluble cytokine known to have anti-inflammatory actions (31). In addition, IL-4 has been shown to strongly inhibit the progression of HUVECs in the G0 + G1 phase of the cell cycle by affecting p53, p21WAF, cyclin D1, and cyclin E (15). When Snn was knocked down, TNF-α exposure resulted in a significant increase in IL-4 mRNA expression (9.25 + 0.89-fold), whereas with no Snn knockdown, a less robust but significant increase was observed (3.21 + 0.82-fold) (Fig. 5A). The gene p29 (GCIP) has been implicated in regulation of the G1/S transition through its association with cyclin D, with an increase in GCIP expression correlating with a halt of the cell cycle at G1 (5). When Snn was knocked down, TNF-α exposure resulted in a significant increase in GCIP mRNA expression (3.36 ± 1.44-fold); no significant increase was observed in the absence of Snn knockdown, (Fig. 5B).
Figure 5.
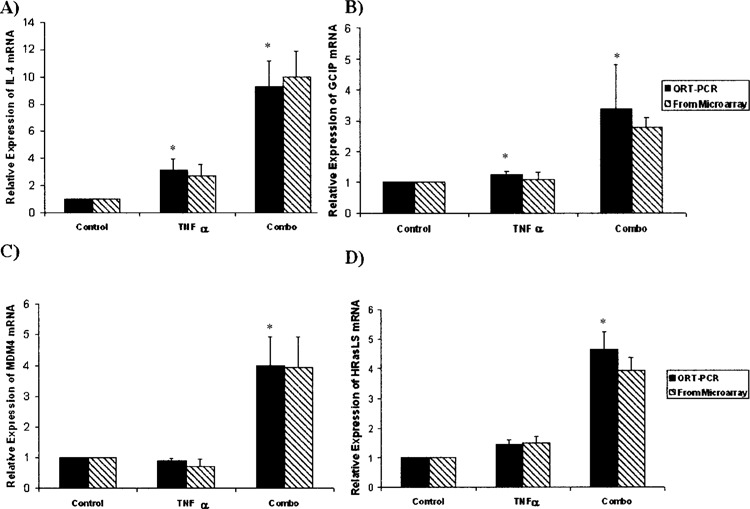
Differential gene expression of known cell growth effector genes. To validate the results of the microarrays, QRT-PCR was used. (A) In response to 200 ng/ml TNF-α, HUVECs normally respond with a threefold upregulation of IL-4 mRNA. When Snn is knocked down, however, HUVECs respond to this same dose of TNF-α with a 10-fold upregulation of IL-4 mRNA compared to the control group. (B) The levels of p29/GCIP mRNA do not normally change in HUVECs after exposure to TNF-α. However, Snn knockdown results in a threefold increase in p29/GCIP mRNA in response to TNF-α compared to the control condition. (C) No significant difference was found in the levels of MDM4 mRNA between TNF-α-exposed HUVECs and control cells. However, under conditions of Snn knockdown, TNF-α results in a fourfold upregulation of MDM4 mRNA compared to the control condition. (D) HRasLS mRNA was upregulated fourfold after both Snn knockdown and TNF-α exposure. No significant difference was found in HRasLS mRNA levels between control and TNF-α alone groups. All expression levels are relative to the control condition. *p < 0.05 (Student’s t-test, n = 3).
The gene MDM4 has been characterized as a p53 inhibitor and loss of MDM4 resulted in G1 arrest in MDM4-deficient mouse embryos and mouse embryonic fibroblasts (27). When Snn was knocked down, TNF-α exposure resulted in a significant increase in MDM4 mRNA expression (3.97 ± 0.94-fold); no change in MDM4 was observed under control conditions (Fig. 5C).
HRasLS has not been extensively characterized, but multiple studies have implicated HRasLS expression with growth inhibition (2,14). When Snn was knocked down, TNF-α exposure resulted in a significant increase in HRasLS mRNA expression (4.63 ± 0.62-fold), no significant increase was observed under control conditions (Fig. 5D).
PRKC/WT1 is a transcriptional regulator, and can both activate and repress transcription depending upon conditions in the cell (13). PRKC is involved in regulating cell growth via interaction with p53 (23,24). When Snn was knocked down, TNF-α exposure resulted in a significant increase in PRKC mRNA expression (2.42 ± 0.4-fold); with no Snn knockdown, no significant increase was observed (Fig. 6A).
Cdc42 binding protein (cdc42BP) is thought to act as a downstream effector of cdc42, mediating the formation of new actin filaments and promoting growth via cytoskeletal reorganization (19). Upon stimulation with TNF-α, HUVECs showed a significant decrease in cdcd42BP (0.62 ± 0.07-fold) (Fig. 6B); this decrease was significantly enhanced when HUVECs were treated with Snn siRNA prior to TNF-α stimulation (0.31 ± 0.08-fold) (Fig. 6B).
E-Selectin is a cell adhesion molecule involved in tumor metastasis and atherosclerosis (17,36). In addition, E-selectin levels increase in HUVECs after TNF-α stimulation (16,34). As expected, upon TNF-α stimulation, a significant increase in E-selectin mRNA was observed (195.86 ± 28.25) (Fig. 6C). This increase was partially attenuated under conditions of Snn knockdown (69.30 ± 6.65) (Fig. 6C).
Phospholipase A2, group VII (PLA2), also known as platelet activating factor acetylhydrolase, has potent anti-inflammatory effects and is thought have a protective function against oxidized phospholipids on low density lipoprotein (LDL) (31). In addition, PLA2-mediated arachidonic acid release inhibits the proliferation of renal proximal tubule cells (11). When Snn was knocked down, TNF-α exposure resulted in a significant increase in phospholipase A2 mRNA expression (6.76 ± 0.78-fold), whereas with no Snn knockdown, no significant increase was observed (Fig. 6D).
Knockdown of Snn Directly Alters Gene Expression of Several Genes Linked to Cell Growth
Treatment of HUVEC with Snn siRNA alone significantly reduced cell growth after 48 h. An examination of significant changes in gene expression caused by Snn siRNA alone versus control is shown in Table 1. Of those gene products showing significant changes, COP1, a negative regulator of p53, was reduced approximately threefold. This alteration may explain how Snn siRNA alone can cause modest growth inhibition after 48 h of treatment (Fig. 1). Two additional gene products are related to interferon stimulation (IFIT1 and G1P2), and could reflect a role for Snn in this pathway.
TABLE 1.
GENES SIGNIFICANTLY ALTERED IN HUVEC BY Snn siRNA
| Access Number | Normalized Change | Proposed Function | |
|---|---|---|---|
| Control | Snn siRNA | ||
| NM-022457/COP1 | 1.151 | 0.382 | Negative regulator of p53 |
| NM-014364/GAPDS | 1.041 | 0.288 | G3PDH isoform |
| NM-001548/IFIT1 | 1.069 | 4.999 | Interferon-induced gene |
| NM-005101/G1P2 | 1.041 | 3.543 | Interferon-induced gene |
Knockdown of Snn Inhibits the Ability of TNF-α-Treated HUVEC Cells to Progress Through the Cell Cycle
In an effort to verify the mechanism suggested by the microarray studies underlying the differential growth of TNF-α-treated HUVEC cells due to Snn knockdown, cell cycle analysis was performed using flow cytometry after cells were stained with propidium iodide. As shown in Figure 7, there was a significant increase (7 ± 0.13%) in the proportion of HUVECs in the G1 phase of the cell cycle when they were treated with both TNF-α and Snn siRNA versus TNF-α or Snn siRNA alone. Accordingly, cotreatment with TNF-α and Snn siRNA resulted in a significant decrease in the proportion of cells in the S (5–6 ± 0.08%) and G2 (3–4 ± 0.21%) phases compared to those treated with TNF-α or Snn siRNA alone. These results indicate that Snn may play a role in progression of the cell cycle at the G1/S transition phase in HUVEC cells.
Figure 7.
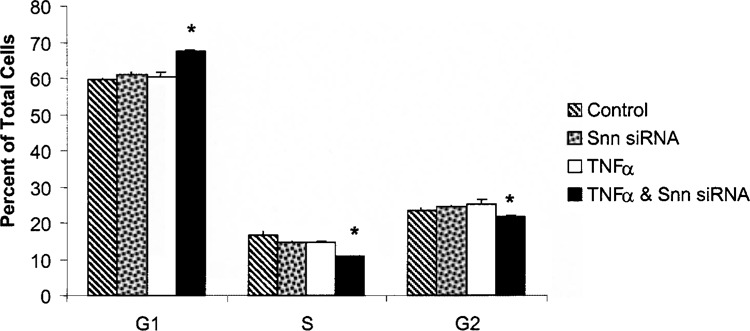
Cotreatment with TNF-α and Snn siRNA alters HUVEC progression through the cell cycle. The proportion of cells in each phase of the cell cycle was analyzed via flow cytometry after propidium iodide staining. HUVECs exposed to both TNF-α and Snn siRNA showed significant changes in their cell cycle compared to those treated with either TNF-α or Snn siRNA alone. HUVECs were transfected with Snn siRNA (20 nM for 24 h) and were then treated with TNF-α (200 ng/ml) and allowed to incubate for an additional 24 h. Neither TNF-α nor Snn siRNA alone had any effect on the progression of HUVECs through the cell cycle. *p < 0.05 (Student’s t-test, n = 3).
DISCUSSION
Differential gene expression profiling using microarray analysis indicates that Snn may have a functional role in controlling cell cycle machinery in TNF-α-stimulated HUVEC. Major shifts in relative gene expression were observed between the TNF-α and Combo (Snn siRNA + TNF-α) experimental microarray groups (Fig. 3). An unexpected result was the high degree of similarity between the control and the Snn siRNA only groups. This may imply that the effect of Snn on cellular gene expression is normally passive and requires a stimulus, such as TNF-α, to activate expression. Of note is the finding that Snn siRNA treatment did significantly alter several genes of interest, including COP1, a negative regulator of p53 (8). COP1 directly interacts with p53, leading to a reduction in levels of p53. This reduction leads to growth arrest and can sensitize cells to ionizing radiation. Reduction of both COP1 and MDM2 led to a synergistic sensitization. Thus, the growth arrest seen by Snn siRNA alone (Fig. 1) may reflect a reduction of COP1 levels.
However, microarray technology is limited to mRNA measures of gene expression and the functional role of the respective protein results must be thoroughly validated using other approaches. With that in mind, we further validated eight genes that were significantly altered from the microarray analysis using QRT-PCR. The consistency between the microarray and QRT-PCR assays is evident in Figures 5 and 6. It appears that Snn regulates genes such as IL-4 and MDM4, which play a role in regulating cell growth in response to TNF-α. Though the exact mechanism is not known, TNF-α is capable of slowing or halting HUVEC growth in vitro (9,12,18,28). This TNF-α-induced inhibition of HUVEC growth is significantly augmented when Snn is knocked down via siRNA (Fig. 1).
There are two possibilities underlying the difference in cell growth shown in Figure 1. One is that cell death is occurring and two is that the cell cycle is being halted at one of the cell cycle checkpoints. Cell death was ruled out because a terminal deoxynucleotidyl transferase biotin-dUTP Nick End Labeling (TUNEL) assay revealed no significant cell death in our experimental paradigm (data not shown). Further, the growth curves were generated using a trypan blue exclusion assay so that only viable cells were counted. Analysis of the cell cycle was made using flow cytometry and showed that a significant perturbation of the cell cycle occurred in the G1 phase of the cell cycle (Fig. 7), consistent with the results from the microarray experiments.
PKC-ε is involved in cellular proliferation (33), inflammation (1), and the immune response (3). The apparent role of Snn in cellular proliferation via PKC-ε is supported by the observation that stimulation of PKC-ε in vitro augmented cellular proliferation via increased cyclin D1 and cyclin E expression (33). Thus, the knockdown of Snn was predicted to inhibit cellular proliferation. The significant alteration of genes known to be present in cyclin D1 signaling pathways (IL-4, p29) further supports this hypothesis. Specifically, IL-4 has been shown to decrease the expression of cyclin D1 and E in HUVECs and p29 is known to inhibit the transcription factor E2F, which is induced by cyclin D1 and transactivates the expression of genes that are involved in S phase progression of the cell cycle (5,15).
One challenge in interpretation of the microarray data is the confounding effects that may be occurring with respect to p53. The upregulation of MDM4 (Fig. 5C), a strong p53 inhibitor, contrasts with the upregulation of IL-4, which can induce the expression of p53. Upregulation of WT1/PRKC is known to increase the effective level of p53 in cells via stabilization of the protein (15,23,27). The p53 protein is a primary inhibitor of the cell cycle at the G1 checkpoint and limits the ability of the cell to advance through the cell cycle. From the growth and cell cycle studies, p53 is a likely final target for the observed effects on cell cycle and that the upregulation of MDM4 may be a transient compensatory response initiated by the cell to maintain homeostasis.
In summary, we have shown that knocking Snn down via targeted siRNA results in differential gene expression between TNF-α-exposed HUVECs and HUVECs that had both Snn siRNA and TNF-α treatments. Using QRT-PCR, we further validated eight significantly altered genes associated with the regulation of the cell cycle and/or cell growth. Functional studies show that HUVEC growth is inhibited in response to TNF-α treatment and that this inhibition is further augmented by Snn knockdown. The most likely mechanism responsible for this decrease in growth rate is an arrest of the cell cycle at the G1 checkpoint via disruption of cyclin D1 and/or p53.
ACKNOWLEDGMENTS
We would like to thank Rob Brucklacher from the Functional Genomics Core Facility at the Penn State College of Medicine for helping to expedite the QRT follow up assays.
REFERENCES
- 1. Akita Y. Protein kinase C-epsilon (PKC-epsilon): Its unique structure and function. J. Biochem. (Tokyo) 132(6):847–852; 2002. [DOI] [PubMed] [Google Scholar]
- 2. Akiyama H.; Hiraki Y.; Noda M.; Shigeno C.; Ito H.; Nakamura T. Molecular cloning and biological activity of a novel Ha-Ras suppressor gene predominantly expressed in skeletal muscle, heart, brain, and bone marrow by differential display using clonal mouse EC eells, ATDC5. J. Biol. Chem. 274(45):32192–32197; 1999. [DOI] [PubMed] [Google Scholar]
- 3. Aksoy E.; Goldman M.; Willems F. Protein kinase C epsilon: A new target to control inflammation and immune-related disorders. Int. J. Biochem. Cell Biol. 36(2):183–188; 2004. [DOI] [PubMed] [Google Scholar]
- 4. Baines C. P.; Zhang J.; Wang G. W.; Zheng Y. T.; Xiu J. X.; Cardwell E. M.; Bolli R.; Ping P. Mitochondrial PKCε and MAPK form signaling modules in the murine heart. Circ. Res. 90:390–397; 2002. [DOI] [PubMed] [Google Scholar]
- 5. Chang M. S.; Chang C. L.; Huang C. J.; Yang Y. C. p29, a novel GCIP-interacting protein, localizes in the nucleus. Biochem. Biophys. Res. Commun. 279:732–737; 2000. [DOI] [PubMed] [Google Scholar]
- 6. Churchill G. A. Fundamentals of experimental design for cDNA microarrays. Nat. Genet. Suppl. 32:490–495; 2002. [DOI] [PubMed] [Google Scholar]
- 7. Dejneka N. S.; Polavarapu R.; Deng X.; Martin-DeLeon P. A.; Billingsley M. L. Chromosomal localization and characterization of the stannin (Snn) gene. Mamm. Genome 9:556–564; 1998. [DOI] [PubMed] [Google Scholar]
- 8. Dornan D.; Wertz I.; Shimizu H.; Arnott D.; Frantz G. D.; Dowd P.; O’Rourke K.; Koeppen H.; Dixit V. M. The ubiquitin ligase COP1 is a critical regulator of p53. Nature 429:86–92; 2004. [DOI] [PubMed] [Google Scholar]
- 9. Fukushima K.; Miyamoto S.; Tsukimori K.; Kobayashi H.; Seki H.; Takeda S.; Kensuke E.; Ohtani K.; Shibuya M.; Nakano H. Tumor necrosis factor and vascular endothelial growth factor induce endothelial integrin repertories, regulating endovascular differentiation and apoptosis in a human extravillous trophoblast cell line. Biol. Reprod. 73(1):172–179; 2005. [DOI] [PubMed] [Google Scholar]
- 10. Gadea G.; Roger L.; Anguille C.; de Toledo M.; Gire V.; Roux P. TNF-α induces sequential activation of cdc42- and p38/p53-dependent pathways that antagonistically regulate filopodia formation. J. Cell Sei. 117:6355–6364; 2004. [DOI] [PubMed] [Google Scholar]
- 11. Han H. J.; Lim M. J.; Lee Y. J. Oxalate inhibits renal proximal tubule cell proliferation via oxidative stress, p38 MAPK/JNK, and cPLA2 signaling pathways. Am. J. Physiol. Cell Physiol. 287:C1058–C1066; 2004. [DOI] [PubMed] [Google Scholar]
- 12. Jin Z.; Pei L.; Wang D. Effects of tumor necrosis factor-alpha on proliferation and intracellular free calcium concentration in endothelium of human umbilical vein endothelial cells. Zhonghua Fu Chan Ke Za Zhi 35:657–659; 2000. [PubMed] [Google Scholar]
- 13. Johnstone R. W.; See R. H.; Sells S. F.; Wang J.; Muthukkumar S.; Englert C.; Haber D. A.; Licht J. D.; Sugrue S. P.; Roberts T.; Rangnekar V. M.; Shi Y. A novel repressor, par-4, modulates transcription and growth suppression functions of the Wilms’ tumor suppressor WT1. Mol. Cell. Biol. 16(12):6945–6956; 1996. [DOI] [PMC free article] [PubMed] [Google Scholar]
- 14. Kaneda A.; Wakazono K.; Tsukamoto T.; Watanabe N.; Yagi Y.; Tatematsu M.; Kaminishi M.; Sugimura T.; Ushijima T. Lysyl oxidase is a tumor suppressor gene inactivated by methylation and loss of heterozygosity in human gastric cancers. Cancer Res. 64(18):6410–6415; 2004. [DOI] [PubMed] [Google Scholar]
- 15. Kim J.; Cheon I. S.; Won Y. J.; Na H. J.; Kim Y. M.; Choe J. IL-4 inhibits cell cycle progression of human umbilical vein endothelial cells by affecting p53, p21WAFl, cyclin Dl, and cyclin E expression. Mol. Cells 16(l):92–96; 2003. [PubMed] [Google Scholar]
- 16. Klein C. L.; Kohier H.; Bittinger F.; Wagner M.; Hermanns I.; Grant K.; Lewis J. C.; Kirkpatrick C. J. Comparative studies on vascular endothelium in vitro. I. Cytokine effects on the expression of adhesion molecules by human umbilical vein, saphenous vein, and femoral artery endothelial cells. Pathobiology 62(4):199–208; 1994. [DOI] [PubMed] [Google Scholar]
- 17. Laferriere J.; Houle F.; Huot J. Adhesion of HT-29 colon carcinoma cells to endothelial cells requires sequential events involving E-selectin and integrin β4. Clin. Exp. Metastasis 21:257–264; 2004. [DOI] [PubMed] [Google Scholar]
- 18. Langeggen H.; Johnson E.; Hetland G. Effects of C5a and FMLP on interleukin-8 production and proliferation of human umbilical vein endothelial cells. Inflammation 25(2):83–89; 2001. [DOI] [PubMed] [Google Scholar]
- 19. Leung T.; Chen X. Q.; Tan I.; Manser E.; Lim L. Myotonie dystrophy kinase-related Cdc42-binding kinase acts as a Cdc42 effector in promoting cytoskeletal reorganization. Mol. Cell. Biol. 18(1):130–140; 1998. [DOI] [PMC free article] [PubMed] [Google Scholar]
- 20. Lin P. S.; Ho K. C.; Sung S. J.; Gladding J. Effect of tumor necrosis factor, heat, and radiation on the viability and microfilament organization in cultured endothelial cells. Int. J. Hypertherm. 8:667–677; 1992. [DOI] [PubMed] [Google Scholar]
- 21. Locksley R. M.; Killeen N.; Lenardo M. J. The TNF and TNF receptor superfamilies: Integrating mammalian biology. Cell 104:487–501; 2001. [DOI] [PubMed] [Google Scholar]
- 22. MacEwan D. J. TNF receptor subtype signalling: Differences and cellular consequences. Cell Signal. 14:477–492; 2001. [DOI] [PubMed] [Google Scholar]
- 23. Maheswaran S.; Englert C.; Bennett P.; Heinrich G.; Haber A. D. The WT1 gene product stabilizes p53 and inhibits p53-mediated apoptosis. Genes Dev. 9:2143–2156; 1995. [DOI] [PubMed] [Google Scholar]
- 24. Maheswaran S.; Park S.; Bernard A.; Morris J. F.; Rauscher F. J.; Hill D. E.; Haber D. A. Physical and functional interaction between WTl and p53 proteins. Proc. Natl. Acad. Sci. USA 90:5100–5104; 1993. [DOI] [PMC free article] [PubMed] [Google Scholar]
- 25. Mauerhoff T.; Belfiore A.; Pujol-Borrell R.; Bottazzo G. F. Growth inhibition of human endothelial cells by human recombinant tumor necrosis factor alpha and interferon-gamma. Tumori 80:301–305; 1994. [DOI] [PubMed] [Google Scholar]
- 26. Mcjilton M. A.; Sikes C. V.; Wescott G. G.; Wu D.; Foreman T. L.; Gregory C. W.; Weidner D. A.; Ford O. H.; Lasater A. M.; Mohler J. L.; Terrian D. M. Protein kinase Ce interacts with Bax and promotes survival of human prostate cancer cells. Oncogene 22:7958–7968; 2003. [DOI] [PubMed] [Google Scholar]
- 27. Migliorini D.; Denchi E. L.; Danovi D.; Jochemsen A.; Capillo M.; Gobbi A.; Helin K.; Pelicci P. G.; Marine J. C. Mdm4 (Mdmx) regulates p53-induced growth arrest and neuronal cell death during early embryonic mouse development. Mol. Cell. Biol. 22(15):5527–5538; 2002. [DOI] [PMC free article] [PubMed] [Google Scholar]
- 28. Moldenhauer A.; Nociari M.; Lam, G; Salama A.; Rafu S.; Moore M. A. S. Tumor necrosis factor alpha-stimulated endothelium: An inducer of dendritic cell development from hematopoietic progenitors and myeloid leukemie cells. Stem Cells 22:144–157; 2004. [DOI] [PubMed] [Google Scholar]
- 29. Petrovics, G; Bird T.; Lehel C.; Oravecz T.; Anderson W. B. Protein Kinase Ce mediates PMA-induced growth inhibition of low population density NIH 3T3 fibroblasts. Arch. Biochem. Biophys. 397(2):217–223; 2001. [DOI] [PubMed] [Google Scholar]
- 30. Reese B. E.; Davidson C. E.; Billingsley M. L.; Yun J. K. Protein kinase C epsilon regulates TNFalpha-induced stannin gene expression. J. Pharmacol. Exp. Ther. 314(l):61–69; 2005. [DOI] [PubMed] [Google Scholar]
- 31. Rocken M.; Rocke M.; Shevach E. M. IL-4-induced immune deviation as antigen-specific therapy for inflammatory autoimmune disease. Immunol, Today 17:225–231; 1996. [DOI] [PubMed] [Google Scholar]
- 32. Six D. A.; Dennis E. A. The expanding superfamily of phospholiase A2 enzymes: Classification and characterization. Biochim. Biophys. Acta 1488:1–19; 2000. [DOI] [PubMed] [Google Scholar]
- 33. Soh J. W.; Weinstein I. B. Roles of specific isoforms of protein kinase C in the transcriptional control of cyclin Dl and related genes. J. Biol. Chem. 278(36):34709–34716; 2003. [DOI] [PubMed] [Google Scholar]
- 34. ten Kate M.; Hofland L. J.; van Grevenstein W. M.; van Koetsveld P.; Jeekel J.; van Eijck C. H. Influence of proinflammatory cytokines on the adhesion of human colon carcinoma cells to lung microvascular endothelium. Int. J. Cancer 112(6):943–950; 2004. [DOI] [PubMed] [Google Scholar]
- 35. Thompson T. A.; Lewis J. M.; Dejneka N. S.; Severs W. B.; Polavarapu R.; Billingsley M. L. Induction of apoptosis by organotin compounds in vitro: Neuronal protection with antisense oligonucleotides directed against stannin. J. Pharmacol. Exp. Ther. 276:1201–1215; 1996. [PubMed] [Google Scholar]
- 36. Zhang B. H.; Chen H.; Yao X. P.; Cong W. M.; Wu M. C. E-Selectin and its ligand-sLeX in the metastasis of hepatocellular carcinoma. Hepatobiliary Pancreat. Dis. Int. 1(1):80–82; 2002. [PubMed] [Google Scholar]