

Abstract
The development of hepatocellular carcinoma (HCC) is generally preceded by cirrhosis, which occurs at the end stage of fibrosis. This is a common and potentially lethal problem of chronic liver disease in Asia. The development of microarrays permits us to monitor transcriptomes on a genome-wide scale; this has dramatically speeded up a comprehensive understanding of the disease process. Here we used dimethylnitrosamine (DMN), a nongenotoxic hepatotoxin, to induce rat necroinflammatory and hepatic fibrosis. During the 6-week time course, histopathological, biochemical, and quantitative RT-PCR analyses confirmed the incidence of necroinflammatory and hepatic fibrosis in this established rat model system. Using the Affymetrix microarray chip, 256 differentially expressed genes were identified from the liver injury samples. Hierarchical clustering of gene expression using a gene ontology database allowed the identification of several stage-specific characters and functionally related clusters that encode proteins related to metabolism, cell growth/maintenance, and response to external challenge. Among these genes, we classified 44 potential necroinflammatory-related genes and 62 potential fibrosis-related markers or drug targets based on histopathological scores. We also compared the results with other data on well-known markers and various other microarray datasets that are available. In conclusion, we believe that the molecular picture of necroinflammatory and hepatic fibrosis from this study may provide novel biological insights into the development of early liver damage molecular classifiers than can be used for basic research and in clinical applications. A public accessible website is available at http://LiverFibrosis.nchc.org.tw:8080/LF.
Key words: Dimethylnitrosamine, Histopathology, Necroinflammatory, Fibrosis, Biochemical data, Microarray, Quantitative RT-PCR, Tgfb1, Timp1, Spp1
INTRODUCTION
Liver fibrosis and cirrhosis, which appear during the end stage of fibrosis, are the major risk factors of hepatocellular carcinoma (HCC). Although a range of factors, such as hepatitis B virus (HBV), hepatitis C virus (HCV), hepatotoxins, metabolic disorders, and alcoholism, can induce liver cirrhosis, hepatic fibrogenesis is also induced by these risk factors and shares a similar phenotype (4,8,20,23,39). However, it is not clear what types of genes are involved or how they act when liver injury takes place and is repaired. Moreover, the cirrhosis caused by these risk factors often progresses insidiously. Patients with end-stage liver cirrhosis usually die unless they accept liver transplantation, which has a 5-year survival rate of 75% (23).
Previous biochemical studies have reported that there are 39 well-known fibrosis or cirrhosis markers (13,19,23) and these include invasive and noninvasive markers. Recently, the development of microarrays, which permit us to monitor transcriptomes on a genome-wide scale, has dramatically expedited a comprehensive understanding of gene expression profiles and this includes how the transcription profiles for genes vary across the progressive of a disease’s development. Moreover, the application of microarray may ultimately reveal unique and identifiable signatures, which are essential to the discovery of new insights into the mechanisms common to, for example, liver fibrosis. Recently, two microarray studies have been carried out that relate to liver fibrosis and cirrhosis. Firstly, liver fibrosis was induced in rats by continuous administration of thioacetamide (TAA) in the drinking water for 12 weeks. The liver samples at a single time point (14th week) were subjected to the Agilent Rat cDNA microarray analysis (45). Secondly, Kim and his colleagues identified 556 chronic liver disease (CLD)-related genes, which included 273 HCC-associated gene signatures and 283 etiology-associated signatures; this involved a comparison of low-risk and high-risk CLD groups using an Incyte human cDNA microarray (26). Thirdly, it is well known that the liver regenerates in response to a variety of injuries (10,34). Rodent partial hepatectomy has been a useful tool and model with which to investigate the signals that regulate the regenerative response. White and his colleagues used a microarray strategy to identify a total of 640 different expression pattern genes that are involved in the hepatic regenerative response (50).
Several animal models have been established to study liver fibrosis (7,17,40,45). In this study, we employed dimethylnitrosamine (DMN), which is a potent nongenotoxic hepatotoxin, to simulate liver fibrosis (16,37) and to perform a 6-week time course Affymetrix microarray study. DMN has been demonstrated to induce liver damage rapidly and also has been empirically proven to be useful for the study of early human fibrosis formation (1,14,25). Moreover, the implementation of histopathological grading of each rat and a statistical approach allows quantitative depiction of the transcriptional regulation during liver fibrosis over a time course. The expression patterns enabled us to identify 256 differentially expressed genes, including 44 necroinflammatory-related and 62 fibrosis-related genes. Comparison of our dataset with earlier related studies reveals multiple overlapping gene identities and these may potentially serve as markers for fibrosis, cirrhosis, and/or HCC diagnosis. Finally, the histopathological, clinical biochemical, and microarray data are stored at http://LiverFibrosis.nchc.org.tw:8080/LF to allow the scientific community to freely access this invaluable information and knowledge.
MATERIALS AND METHODS
Animal Treatments
DMN-induced liver fibrosis model was performed as previously described (25). Male Sprague-Dawley rats (Slc:SD; Japan SLC, Shizuoka, Japan), weighing 300–350 g, were used in all experiments. To induce hepatic fibrosis over a 6-week time course experiment, the rats were given DMN (Sigma, St. Louis, MO) by IP injection. The chemical was dissolved in normal saline and injected three consecutive days a week at a dose of 6.7 mg/kg per body weight. This is a much lower dosage than the one used in other experiments where the level was 100 mg/kg/day DMN. This higher level is able to cause toxicity in rat liver (47,48). The treatment with DMN lasted for only the first 3 weeks (Fig. 1A). Four to seven rats at each time point for each group were treated with either DMN or with an equal volume of normal saline without DMN as the control. All of these rats (26 DMN-treated rats and 24 control rats) were subjected to biochemical and histopathological analysis. However, only two rats for each group at each time point were subjected to microarray analysis. Rats were weighed and sacrificed on days 11, 18, 25, 32, 39, and 46 and these were designated as weeks 1 through 6 (Fig. 1A).
Figure 1.

A schematic illustration of DMN-induced fibrosis in rats. (A) Each rat was either injected with DMN three times per week for 3 consecutive weeks (triangle) or injected with normal saline as a control under the same regime. Rats were weighed and sacrificed each week (starting on day 11, which are referred to as first week to sixth week). Blood samples were collected for biochemical assay (summary in Table 1) and livers were excised and weighed, followed by either fixing in formaldehyde for histopathology or isolation of RNA for microarray analysis. (B) The quantitative real-time PCR result for Tgfbl. The TaqMan® assays were conducted in triplicate for each sample, and a mean value was used for calculation of expression levels. To standardize the quantification of the target genes, 18S rRNA from each sample was quantified at the same time as the target genes.
Serum Biochemical Data
Blood samples, collected from the animals at necropsy, were used to measure serum concentrations or activity of albumin, glutamic oxaloacetic transaminase (GOT), glutamic pyruvic transaminase (GPT), total bilirubin, acid phosphatase (ACP), α-fetoprotein (AFP), blood urea nitrogen (BUN), lactate dehydrogenase (LDH), globulin, prothrombin time (PT), and blood platelets (PLT) using an Hitachi 747 and ACL 3000 clinical chemistry analyzer system (MYCO, Renton, WA) at Taichung Veterans General Hospital, Taiwan.
RNA Extraction, Reverse Transcription, and Quantitative Real-Time Reverse Transcriptase Polymerase Chain Reaction (Q-RT-PCR)
We used the same total RNA samples for both microarray and Q-RT-PCR analyses. RNA preparation and analysis were performed according to the Affymetrix’s instructions. Briefly, RNA was subjected to reverse transcription with random hexamer primers and the ThermoScript™ RT-PCR system (Life Technologies, Gaithersburg, MD). The cDNAs also served as templates (diluted 200 times) for Q-PCR using an ABI Prism 7700 sequence detection system with TaqMan® Universal PCR Master Mix kit (Applied Biosystems, Foster City, CA). To standardize the quantization of the selected target genes, 18S small subunit ribosomal RNA (18S rRNA) from each sample served as an internal control and was quantified at the same time as the target genes. The cycle threshold (CT) value of the 18S rRNA was used to normalize the target gene expression, referred to as ΔCT, and this was used to correct differences between samples. The Assays-on-Demand IDs of Tgfb1, Timp1, and 18S rRNA are Rn00572010_m1, Rn00587558_m1, and Hs99999901_s1 (Applied Biosystems, Foster City, CA).
Microarray Analysis
The quality of the total RNA for microarray analysis was determined using Spectra Max Plus (Molecular Devices) and had an A260/A280 ratio ranging from 1.9 to 2.1. Protocols and reagents for hybridization, washing, and staining followed the Affymetrix instructions (http://www.affymetrix.com/support/technical/manuals.affx). Labeled cRNA was hybridized to the Affymetrix GeneChip Test 3 Array to verify the quality prior to hybridization to the Affymetrix Rat Genome U34A Array.
Data Analysis and Clustering Algorithm
The images were transformed into text files containing intensity information using GeneChip® Operating Software (GCOS, similar to MAS 5.0) developed by Affymetrix. The microarray datasets were then analyzed using GeneSpring® 7.2 software (Silicon Genetics, Redwood City, CA).
Western Blot Analysis
Liver samples were lysed in 50% lysate buffer (20 mM PIPES, pH 7.2, 100 mM NaCl, 1 mM EDTA, 0.1% CHAPS, 10% sucrose, 1 mM Na3VO4, 1 mM PMSF, and 10 μg/ml each of leupeptin, aprotinin, chymostatin, and pepstatin) and 50% IP washing buffer (10 mM HEPES, pH 7.6, 2 mM MgCl2, 50 mM NaCl, 5 mM EGTA, 0.1% Triton X-100, and 40 mM β-glycerolphosphate) as described previously (51). Protein lysates (50 μg) were resolved by SDS-PAGE on 12% acrylamide gels (Bio-Red, Hercules, CA). Proteins were transferred to PVDF membranes and detected with antibodies by Western blotting analysis. The antibodies used secreted phosphoprotein 1 (Spp1; 1:1000) (R&D Systems) and β-actin (Actb; 1:2500) (Sigma). Bound antibodies were detected by incubation with horseradish-phosphatase conjugated secondary antibodies at 1:3000 for 1 h followed by washing and staining with a Western Lighting™ solution (PerkinElmer Life Sciences, Boston, MA).
Histopathological Examination
The scoring system, modified from the scoring system of the Histology Activity Index (HAI) (24,27), includes necroinflammatory, fibrosis, and fatty change. Briefly, liver samples were immediately removed after sacrifice. The fixed liver samples were then processed for paraffin embedding. Sections (5 μm) were prepared for hematoxylin and eosin staining (to score necroinflammatory and fatty changes) and for Sirius red/fast green collagen staining (to score for fibrosis) (29). To examine the intensity of the necroinflammatory lesions, each liver sample was first given necrosis and inflammation scores. The grading for necrosis was divided into four scores: normal (N0), mild piecemeal necrosis (N1), bridge necrosis (N2), and confluent necrosis (N3). Similarly, inflammation was also divided into four scores: none (I0), mild (I1), moderate (I2), and marked (I3) according to the intensity of inflammatory cell infiltration at portal areas. The necroinflammatory scores were the sum of the necrosis and inflammation scores and ranged from 0 to 6, designated A0 to A6. In addition, fibrosis was divided into four scores: normal (F0), fibrous expansion of portal tracts (F1), bridging fibrosis (F2), and frequent bridging fibrosis with focal nodule formation (F3). The fatty changes were classified as presence or absence (+/−). There were 4–7 rats per treatment per week. Three represented images of each histology sample section (at 100× magnification) of each rat were selected randomly and have been deposited on a public accessible website (http://LiverFibrosis.nchc.org.tw:8080/LF).
Statistical Analysis
All statistical analyses were performed by SAS/STAT 8e (SAS Institute, Cary, NC). The biochemical data were expressed as mean ± SD. Two-way analysis of variance (ANOVA) was used to build an explicit model about the sources of variances that affect the measurements. The relationship between the experimental chips was analyzed by linear regression. The similarity between Q-RT-PCR and microarray data of Timp1 was analyzed by Pearson’s correlation coefficients. The differentially regulated genes from microarray data were identified based on the Student’s t-test at the 1% significance level. Furthermore, the necroinflammatory and fibrosis associated genes were calculated by statistic analysis. Least squares means (LSM), separately estimated for each three-subgroup variation according to necroinflammatory score, were used for the necroinflammatory-related analysis. The Student’s t-test was used for the fibrosis-related analysis as it was based on a two-subgroup variation in fibrosis score. A p value of less than 0.05 was considered to be statistically significant.
RESULTS
Establishment of the DMN-Induced Rat Hepatic Fibrosis Model
To monitor the process of liver fibrosis, we set up the DMN-induced rat hepatic fibrosis animal model as described in Materials and Methods. Schematically, this model is shown in Figure 1. Over the timeline of 6 weeks, 26 rats were treated with DMN and 24 rats were treated with saline (4–7 rats for each group at each time point). In agreement with previous observations (14), after 3 weeks of DMN treatment, collagen fiber deposition in rat liver could be observed, along with bile duct proliferation, centrilobular necrosis, bridging fibrosis, and fibrosis surrounding the central veins (see below for a detailed description). To gain additional information about the established animal model, the gene expression profile of tumor growth factor-beta 1 (Tgfb1), which is the strongest known inducer of fibrogenesis in the effecter cells of hepatic fibrosis and can stimulate the adipocyte transformation (5,9,15,41), was evaluated. The Q-RT-PCR result showed that a higher level of Tgfb1 mRNA expression was observed in DMN-treated rat livers than in the controls (Fig. 1B). These initial examinations warrant further characterization of the DMN-induced rat hepatic fibrosis model.
Clinical Biochemistry Results
The serum of each rat, 50 rats in total, was subjected to various biochemical examinations related to liver damages. These examinations are shown in Table 1. The variable marker values of the control and DMN-treated rats were further divided into three subgroups (first to second week, third to fourth week, and fifth to sixth week) for statistical analysis. The biochemical data of all DMN-treated subgroups showed abnormal values when compared with controls, as illustrated in Table 1. Two-way ANOVA at a 5% significance level was performed to distinguish the various variations (e.g., treatment vs. controls and differences due to the time course) and to estimate the variance of each individual variable in the ANOVA model. The results are shown in Table 2. No significant differences (p < 0.05) were present in the baseline values of all parameters evaluated in the control groups (data not shown). When the DMN-treated and controls were compared, there were 10 serum markers that showed significant differences, including albumin, glutamic pyruvic transferase (GPT), glutamic oxaloacetic transferase (GOT), bilirubin, alkaline phosphatase (AKP), α-fetoprotein (AFP), cholesterol (CHOL), blood urea nitrogen (BUN), prothrombin time (PT), and platelet count (PLT). These differences were not due to changes over the time course (1–6 weeks). In contrast, two-way ANOVA analysis indicated that the time course showed an effect on lactate dehydrogenase (LDH), globulin, and acid phosphatase (ACP). Taken together, the biochemical data for the DMN-treated group suggest that there were changes in many serum markers and that the protein expression levels or physical responses are similar to liver damage phenotypes in human (21,28).
TABLE 1.
CLINICAL, CHEMICAL, AND FIBROSIS PARAMETERS IN TREATED AND UNTREATED GROUPS OF RATS
| Numeric Variable | Control | DMN Treatment | ||||
|---|---|---|---|---|---|---|
| 1–2 Week (n) | 3–4 Week (n) | 5–6 Week (n) | 1–2 Week (n) | 3–4 Week (n) | 5–6 Week (n) | |
| Albumin (g/dl) | 4.4 ± 0.4 (7) | 4.6 ± 0.2 (8) | 4.7 ± 0.2 (8) | 3.9 ± 0.7 (7) | 3.5 ± 0.6 (11) | 3.2 ± 0.1 (7) |
| GPT (U/L) | 61.1 ± 26.7 (8) | 65.9 ± 19.7 (7) | 50.3 ± 4.9 (8) | 459.5 ± 78.5 (8) | 566.6 ± 313.5 (11) | 763.6 ± 405.2 (7) |
| GOT (U/L) | 110.3 ± 37.6 (8) | 84.0 ± 23.5 (7) | 109.1 ± 23.5 (8) | 661.5 ± 134.4 (8) | 1006.1 ± 749.6 (11) | 1572.9 ± 965.3 (7) |
| Bilirubin (mg/dl) | 0.13 ± 0.05 (8) | 0.10 ± 0.01 (8) | 0.13 ± 0.05 (8) | 0.72 ± 0.53 (8) | 1.01 ± 0.74 (11) | 1.13 ± 1.00 (7) |
| AKP (KA) | 46.0 ± 3.7 (4) | 44.8 ± 2.2 (4) | 47.0 ± 13.6 (4) | 600.8 ± 93.0 (4) | 668.3 ± 222.0 (3) | 468 ± 12.7 (2) |
| LDH (IU/L) | 262.3 ± 5.1 (4) | 289.3 ± 31.7 (3) | 292.3 ± 31.3 (4) | 414.8 ± 102.7 (4) | 562.0 ± 120.8 (3) | 853.5 ± 91.2 (2) |
| Globulin (g/dl) | 6.9 ± 0.3 (3) | 6.9 ± 0.5 (4) | 7.3 ± 0.2 (4) | 6.7 ± 0.1 (2) | 5.0 ± 0.8 (4) | 3.6 ± 0.3 (2) |
| Triglyceride (mg/dl) | 130 ± 48 (4) | 144 ± 8 (4) | 170 ± 27 (4) | 151 ± 107 (4) | 181 ± 144 (7) | 103 ± 35 (5) |
| AFP (ng/dl) | 0.32 ± 0.04 (4) | 0.2 ± 0.01 (2) | 0.24 ± 0.03 (4) | 0.40 ± 0.19 (4) | 0.38 ± 0.05 (4) | 0.35 ± 0.07 (2) |
| CHOL (mg/dl) | 88 ± 5 (4) | 71 ± 20 (4) | 91 ± 5 (4) | 77 ± 8 (4) | 70 ± 13 (6) | 67 ± 18 (5) |
| BUN (mg/dl) | 31 ± 2 (4) | 25 ± 6 (4) | 26 ± 9 (4) | 33 ± 4 (4) | 36 ± 2 (4) | 31 ± 5 (2) |
| ACP (mg/dl) | 2.3 ± 0.8 (4) | 2.6 ± 0.5 (4) | 2.3 ± 0.8 (4) | 1.9 ± 0.6 (4) | 6.2 ± 1.1 (4) | 8.2 ± 0.6 (2) |
| PT (s) | 14 ± 1 (7) | 13 ± 1 (8) | 13 ± 1 (7) | 18 ± 4 (8) | 20 ± 4 (9) | 22 ± 5 (6) |
| PLT (103/ml) | 741 ± 245 (8) | 981 ± 124 (8) | 893 ± 109 (8) | 407 ± 72 (7) | 300 ± 165 (11) | 229 ± 302 (7) |
Values are mean ± SD from 1–2-, 3–4-, or 5–6-week treated and untreated groups. n: number of rats. GPT, glutamic pyruvic transaminase; GOT, glutamic oxaloacetic transaminase; bilirubin, total bilirubin; AKP, alkaline phosphatase; LDH, lactate dehydrogenase; AFP, α-fetoprotein; CHOL, cholesterol; BUN, blood urea nitrogen; ACP, acid phosphatase; PT, prothrombin time; PLT, blood platelet.
TABLE 2.
SUMMARY OF STATISTICAL ANALYSIS OF BIOCHEMICAL DATA
| Numeric Variable | p-Value of Control or DMN Treatment Groups | ||
|---|---|---|---|
| Drug | Week | Drug × Week | |
| Albumin (g/dl) | <0.0001* | 0.89 | 0.15 |
| GPT (U/ml) | <0.0001* | 0.18 | 0.13 |
| GOT (U/ml) | <0.0001* | 0.055 | 0.06 |
| Bilirubin | <0.0001* | 0.59 | 0.57 |
| AKP | <0.0001* | 0.20 | 0.19 |
| LDH | <0.0001* | 0.005* | 0.002* |
| Globulin | <0.0001* | 0.005* | 0.0004* |
| Triglyceride | 0.93 | 0.80 | 0.41 |
| AFP | 0.02* | 0.32 | 0.67 |
| CHOL | 0.02* | 0.17 | 0.21 |
| BUN | 0.02* | 0.50 | 0.23 |
| ACP | <0.0001* | <0.0001* | <0.0001* |
| PT | <0.0001* | 0.60 | 0.31 |
| PLT | <0.0001* | 0.40 | 0.02* |
Significance was calculated using two-way ANOVA.
p < 0.05 versus untreated group (control).
Gene Expression Profiling During DMN-Induced Liver Damage
Over the 6-week time course experiment, the liver samples of 12 controls and 12 DMN-treated rats (2 rats for each time point) were selected and microarray experiments performed on them. Before any statistical analyses were applied to the microarray data, reproducibility was assessed. Genes were selected as present when they were assigned a present call according to the perfect match (PM)/mismatch (MM) algorithm of Affymetrix in all gene chips (31). Of the 8799 probe sets analyzed, overall expression patterns for 2385 transcripts on the chips were reported to be present (p < 0.04). To verify that intrasample variability did not obscure differences between the controls and DMN-treated groups, as well as to determine the fold change that we should consider to be significant, we compared the expression profiles among the 24 control datasets. Scatter graphs of expression levels of the 2385 transcripts represented on the microarray were compared with each other. Figure 2A shows the duplicate samples at week 4. Overall, there was no statistical difference at all, with 3.2% of the transcripts deviated more than twofold. To investigate the time course variability, the reliable signals of these 2385 probe sets between the first and sixth week of controls were calculated. Again, they were no statistically difference, with 4.6% of the transcripts deviated more than twofold (Fig. 2B). In contrast, a significant scatter was found between controls and DMN-treated groups, with 28.7% of the transcripts deviated more than twofold (Fig. 2C).
Figure 2.

Interactive scatter plot display of the absolute intensity values for the 2385 unique transcripts represented on the Gene Chip. (A) Biological variability of s in the duplicate experiments (C41 and C42); 3.2% of transcripts deviated more than twofold. (B) Biological variability of s from the first versus sixth week (C12 and C62); 4.6% of transcripts deviated more than twofold. (C) Biological variability between the control and DMN-treated rats at the fourth week (C41 and D42); 28.7% of transcripts deviated more than twofold.
We further investigated whether the controls and DMN-treated groups could be classified into groups on the basis of their gene expression profiles. As the first step to minimize the likelihood of false positives, we filtered all transcripts by forming two independent clusters from the microarray data and identified those that were potentially differentially expressed (Fig. 3). For detailed analysis, the first cluster generated 2385 transcripts as previous described. Of these, 268 were differentially expressed transcripts either higher or lower by 1.5-fold or more when compared with the controls and DMN-treated groups. The second method, which used the “detection flag” selection (31), reported 23 transcripts to be “present” in the DMN-treated groups but not in the controls. In contrast, there was only one transcript reported to be “absent” in all DMN-treated groups but not in the controls. Altogether, 256 genes (or 292 transcripts), including 137 upregulated and 119 downregulated genes, exhibited a differentially expressed gene expression pattern when the DMN-treated groups and controls were compared. Detailed descriptions of all 256 genes including GeneBank ID, name, and fold change are shown in Table 3 and on our liver fibrosis website (see below). Hierarchical clustering generated a dendrogram for the gene expression patterns of these 292 transcripts across the 24 samples as shown in Figure 4A.
Figure 3.
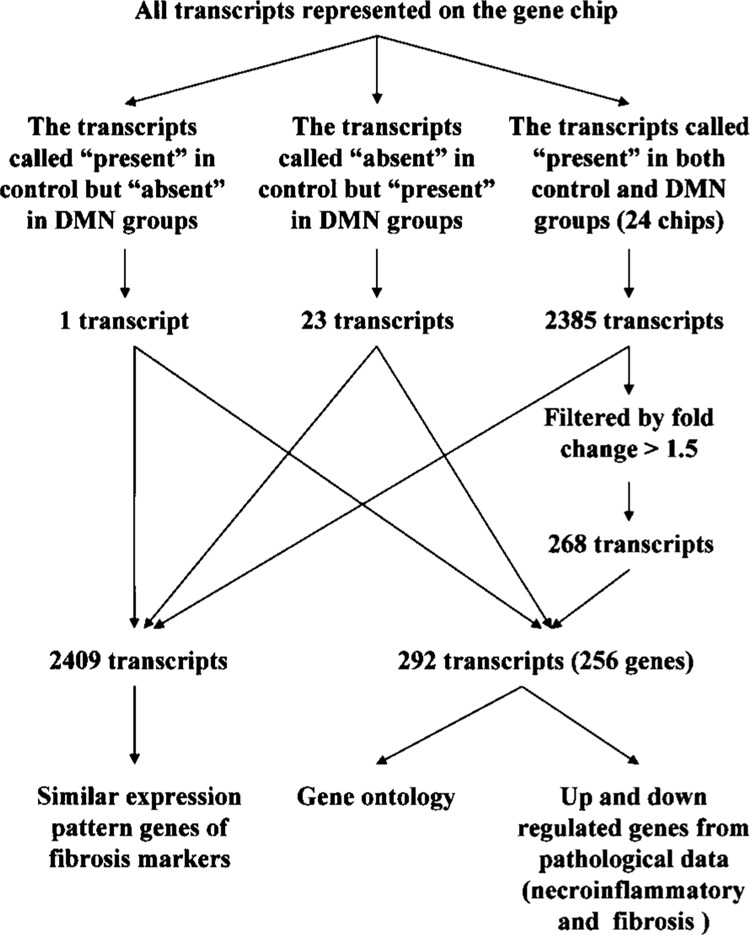
Flowchart of steps for implementation of statistical protocols and our comprehensive cutoff points for data mining. Transcripts (2409) were filtered in control group and DMN-treated group. One and 24 transcripts were clustered as all present in the control but all absent in the DMN-treated group and all present in the DMN-treated but all absent in control group, respectively. In total, 2385 present transcripts were clustered from all 24 chips. All reliable transcripts were found to have similar expression pattern as genes that are well known as fibrosis markers by Pearson correlation (r > 0.8). A further 268 transcripts were further filtered as showing a 1.5-fold change from the initial 2385 genes. Two hundred and ninety-two transcripts (256 genes) were identified and subjected to more detailed analysis including gene ontology detection and histopathology (necroinflammatory and fibrosis)-related genes analysis.
TABLE 3.
GENES WITH MOST SIGNIFICANT CHANGES IN EXPRESSION BETWEEN TREATED AND UNTREATED GROUPS
| GenBank Accession No. | Description | Mean ± SD of Control | Mean ± SD of DMN Treatment | Fold Change | p-Value |
|---|---|---|---|---|---|
| Downregulated genes | |||||
| X14552 | Protein phosphatase 2 (formerly 2A), regulatory subunit B (PR 52), alpha isoform | 10.58 ± 4.22 | 0.70 ± 0.29 | ↓ 15.2 | <0.0001 |
| D14564 | Rattus norvegicus gene for l-gulono-gamma-lactone oxidase, exon 7 | 3.07 ± 0.69 | 0.49 ± 0.28 | ↓ 6.2 | <0.0001 |
| M64755 | Cysteine-sulfinate decarboxylase | 3.26 ± 1.28 | 0.53 ± 0.29 | ↓ 6.2 | <0.0001 |
| AA893325 | Ornithine aminotransferase | 4.41 ± 1.12 | 0.83 ± 0.29 | ↓ 5.3 | <0.0001 |
| M93297 | Rattus norvegicus ornithine aminotransferase (rOAT) gene, exon 7 | 4.10 ± 1.51 | 0.78 ± 0.19 | ↓5.3 | <0.0001 |
| AA892345 | Rat mRNA for dimethylglycine dehydrogenase (EC number 1.5.99.2) | 2.72 ± 0.71 | 0.53 ± 0.29 | ↓ 5.1 | <0.0001 |
| J05210 | ATP citrate lyase | 2.93 ± 1.58 | 0.60 ± 0.33 | ↓ 4.9 | 0.00031 |
| AA893552 | Rattus norvegicus kallistatin mRNA, complete cds | 2.70 ± 0.52 | 0.65 ± 0.27 | ↓ 4.1 | <0.0001 |
| M00002 | Apolipoprotein A-IV | 2.99 ± 1.34 | 0.75 ± 0.31 | ↓ 4.0 | <0.0001 |
| D00362 | Rattus norvegicus mRNA for carboxyesterase E1, partial cds | 1.33 ± 0.24 | 0.33 ± 0.24 | ↓ 4.0 | <0.0001 |
| AI232087 | Hydroxyacid oxidase 3 (medium-chain) | 2.43 ± 0.52 | 0.62 ± 0.34 | ↓ 3.9 | <0.0001 |
| X52625 | 3-Hydroxy-3-methylglutaryl-Coenzyme A synthase 1 | 2.65 ± 0.77 | 0.69 ± 0.27 | ↓ 3.8 | <0.0001 |
| S49003 | Short isoform growth hormone receptor (rats, mRNA, 1136 nt) | 1.93 ± 0.42 | 0.52 ± 0.23 | ↓ 3.7 | <0.0001 |
| M22359 | Alpha(1)-inhibitor 3, variant I | 2.12 ± 1.03 | 0.57 ± 0.43 | ↓ 3.7 | 0.00024 |
| AF038870 | Betaine-homocysteine methyltransferase | 2.04 ± 0.30 | 0.55 ± 0.24 | ↓ 3.7 | <0.0001 |
| H31813 | ESTs, moderately similar to T14781 hypothetical protein DKF-Zp586B1621.1 (H. sapiens) | 1.92 ± 0.59 | 0.55 ± 0.29 | ↓ 3.5 | <0.0001 |
| M59861 | 10-Formyltetrahydrofolate dehydrogenase | 1.86 ± 0.37 | 0.54 ± 0.28 | ↓ 3.5 | <0.0001 |
| M77479 | Solute carrier family 10 (sodium/bile acid cotransporter family), member 1 | 1.66 ± 0.45 | 0.48 ± 0.36 | ↓ 3.4 | <0.0001 |
| M22993 | Alpha(1)-inhibitor 3, variant I | 2.32 ± 1.84 | 0.69 ± 0.45 | ↓ 3.3 | 0.01129 |
| U32314 | Pyruvate carboxylase | 1.88 ± 0.40 | 0.57 ± 0.31 | ↓ 3.3 | <0.0001 |
| AA891774 | ESTs, similar to RIKEN cDNA 1810013B01 | 1.76 ± 0.28 | 0.54 ± 0.24 | ↓ 3.3 | <0.0001 |
| U39206 | Rattus norvegicus cytochrome P450 4F4 (CYP4F4) mRNA, complete cds | 1.87 ± 0.44 | 0.58 ± 0.40 | ↓ 3.2 | <0.0001 |
| M16235 | Lipase, hepatic | 1.74 ± 0.40 | 0.55 ± 0.28 | ↓ 3.2 | <0.0001 |
| AF097723 | Plasma glutamate carboxypeptidase | 1.86 ± 0.30 | 0.60 ± 0.24 | ↓ 3.1 | <0.0001 |
| M26127 | Rat cytochrome P-450 ISF/BNF-G mRNA | 1.76 ± 0.46 | 0.57 ± 0.38 | ↓ 3.1 | <0.0001 |
| AA893032 | ESTs, NAD(P) dependent steroid dehydrogenase-like | 1.70 ± 0.46 | 0.55 ± 0.28 | ↓ 3.1 | <0.0001 |
| D90109 | Fatty acid Coenzyme A ligase, long chain 2 | 1.65 ± 0.37 | 0.54 ± 0.28 | ↓ 3.1 | <0.0001 |
| AA926193 | Sulfotransferase family, cytosolic, 1C, member 2 | 1.81 ± 0.35 | 0.60 ± 0.31 | ↓ 3.0 | <0.0001 |
| U10697 | Carboxylesterase 1 | 1.70 ± 0.37 | 0.57 ± 0.32 | ↓ 3.0 | <0.0001 |
| X76456 | Unnamed protein product; R. norvegicus (Sprague Dawley) alpha albumin gene | 1.72 ± 0.52 | 0.58 ± 0.26 | ↓ 2.9 | <0.0001 |
| AA893244 | ESTs, 3′-phosphoadenosine 5′-phosphosulfate synthase 2 (pre-dieted) | 2.20 ± 0.54 | 0.75 ± 0.24 | ↓ 2.9 | <0.0001 |
| AA893495 | ESTs, highly similar to CORTICOSTEROID-BINDING GLOBULIN PRECURSOR (R. norvegicus) | 1.52 ± 0.32 | 0.52 ± 0.33 | ↓ 2.9 | <0.0001 |
| U72497 | Fatty acid amide hydrolase | 1.84 ± 0.32 | 0.63 ± 0.21 | ↓ 2.9 | <0.0001 |
| S46785 | Insulin-like growth factor binding protein complex acid-labile subunit (rats, liver, mRNA, 2190 nt) | 1.91 ± 0.50 | 0.66 ± 0.38 | ↓ 2.9 | <0.0001 |
| D00752 | Serine protease inhibitor | 1.60 ± 0.34 | 0.55 ± 0.31 | ↓ 2.9 | <0.0001 |
| AA859994 | ESTs, cDNA clone IMAGE:7308494 | 1.85 ± 0.51 | 0.64 ± 0.16 | ↓ 2.9 | <0.0001 |
| U68168 | Kynureninase (l-kynurenine hydrolase) | 1.81 ± 0.48 | 0.64 ± 0.41 | ↓ 2.8 | <0.0001 |
| AA817846 | 3-Hydroxybutyrate dehydrogenase (heart, mitochondrial) | 1.63 ± 0.43 | 0.57 ± 0.38 | ↓ 2.8 | <0.0001 |
| AF080468 | Glucose-6-phosphatase, transport protein 1 | 1.62 ± 0.45 | 0.58 ± 0.26 | ↓ 2.8 | <0.0001 |
| U39943 | Rattus norvegicus cytochrome P450 pseudogene (CYP2J3P1) mRNA | 1.49 ± 0.20 | 0.53 ± 0.30 | ↓ 2.8 | <0.0001 |
| AA892916 | ESTs, similar to RIKEN cDNA 2310001A20 (predicted) | 1.98 ± 0.68 | 0.71 ± 0.20 | ↓ 2.8 | <0.0001 |
| U04733 | Arachidonic acid epoxygenase | 1.44 ± 0.26 | 0.51 ± 0.43 | ↓ 2.8 | <0.0001 |
| AA859645 | Attractin | 2.11 ± 0.53 | 0.76 ± 0.20 | ↓ 2.8 | <0.0001 |
| AA859899 | ESTs, hypothetical protein XP_379516 (Homo sapiens) | 1.67 ± 0.48 | 0.60 ± 0.23 | ↓ 2.8 | <0.0001 |
| AA799560 | N-myc downstream-regulated gene 2 | 1.55 ± 0.22 | 0.56 ± 0.30 | ↓ 2.8 | <0.0001 |
| S76489 | This sequence comes from Figure 1; estrogen sulfotransferase isoform 3 (rats, male, liver, mRNA, 1000 nt) | 1.46 ± 0.21 | 0.53 ± 0.33 | ↓ 2.7 | <0.0001 |
| Ml1266 | Ornithine carbamoyltransferase | 1.55 ± 0.27 | 0.56 ± 0.28 | ↓ 2.7 | <0.0001 |
| M67465 | Hydroxy-delta-5-steroid dehydrogenase, 3 beta- and steroid delta-isomerase | 1.80 ± 0.53 | 0.66 ± 0.36 | ↓ 2.7 | <0.0001 |
| M13646 | Rattus norvegicus Sprague Dawley testosterone 6-beta-hydroxylase, cytochrome P450/6-beta-A, (CYP3A2) | 1.45 ± 0.43 | 0.54 ± 0.30 | ↓ 2.7 | <0.0001 |
| AA892234 | ESTs, moderately similar to microsomal glutathione S-transferase 3 (H. sapiens) | 1.63 ± 0.20 | 0.61 ± 0.25 | ↓ 2.7 | <0.0001 |
| U10357 | Pyruvate dehydrogenase kinase 2 subunit p45 (PDK2) | 1.70 ± 0.34 | 0.64 ± 0.18 | ↓ 2.7 | <0.0001 |
| J05031 | Isovaleryl Coenzyme A dehydrogenase | 1.60 ± 0.20 | 0.61 ± 0.25 | ↓ 2.6 | <0.0001 |
| AF075382 | Cytokine inducible SH2-containing protein 2 | 2.95 ± 1.39 | 1.13 ± 0.69 | ↓ 2.6 | 0.00090 |
| M81183 | Rat insulin-like growth factor I gene, 3′ end of exon 6 | 1.90 ± 0.58 | 0.73 ± 0.35 | ↓ 2.6 | <0.0001 |
| D28560 | Ectonucleotide pyrophosphatase/phosphodiesterase 2 | 1.41 ± 0.35 | 0.54 ± 0.36 | ↓ 2.6 | <0.0001 |
| AB002584 | Beta-alanine-pyruvate aminotransferase | 1.90 ± 0.61 | 0.74 ± 0.26 | ↓ 2.6 | <0.0001 |
| AA946532 | ATP-binding cassette, subfamily D (ALD), member 3 | 1.74 ± 0.55 | 0.68 ± 0.17 | ↓ 2.5 | <0.0001 |
| H33491 | Phenylalkylamine Ca2+ antagonist (emopamil) binding protein | 1.67 ± 0.44 | 0.66 ± 0.19 | ↓ 2.5 | <0.0001 |
| AB008424 | Rat cytochrome P-450 IID3 mRNA, complete cds | 1.55 ± 0.25 | 0.61 ± 0.33 | ↓ 2.5 | <0.0001 |
| J02791 | Acyl-coenzyme A dehydrogenase, C-4 to C-12 straight-chain | 1.67 ± 0.32 | 0.66 ± 0.31 | ↓ 2.5 | <0.0001 |
| J03588 | Guanidinoacetate methyltransferase | 1.27 ± 0.24 | 0.50 ± 0.27 | ↓ 2.5 | <0.0001 |
| Z50144 | Kynurenine aminotransferase II | 1.65 ± 0.22 | 0.66 ± 0.41 | ↓ 2.5 | <0.0001 |
| AI172017 | Aldehyde dehydrogenase 2, mitochondrial | 1.72 ± 0.27 | 0.69 ± 0.20 | ↓ 2.5 | <0.0001 |
| Ml1670 | Catalase | 1.55 ± 0.63 | 0.62 ± 0.33 | ↓ 2.5 | 0.00035 |
| S48325 | RLM6; diabetes-inducible cytochrome P450RLM6 (rats, liver, mRNA Partial, 1093 nt) | 1.37 ± 0.24 | 0.55 ± 0.24 | ↓ 2.5 | <0.0001 |
| M23601 | Monoamine oxidase B | 1.67 ± 0.24 | 0.67 ± 0.32 | ↓ 2.5 | <0.0001 |
| D85035 | Dihydropyrimidine dehydrogenase | 1.61 ± 0.34 | 0.65 ± 0.27 | ↓ 2.5 | <0.0001 |
| L24207 | Cytochrome P450, subfamily IIIA, polypeptide 3 | 1.62 ± 0.48 | 0.66 ± 0.25 | ↓ 2.5 | <0.0001 |
| X06150 | Glycine methyltransferase | 1.61 ± 0.41 | 0.65 ± 0.38 | ↓ 2.5 | <0.0001 |
| J04591 | Dipeptidyl peptidase 4 | 1.50 ± 0.28 | 0.61 ± 0.21 | ↓ 2.5 | <0.0001 |
| D63704 | Dihydropyrimidinase | 1.57 ± 0.18 | 0.64 ± 0.36 | ↓ 2.4 | <0.0001 |
| AA892675 | ESTs, weakly similar to T20360 hypothetical protein D2030.9b—Caenorhabditis elegans (C. elegans) | 1.74 ± 0.35 | 0.72 ± 0.24 | ↓ 2.4 | <0.0001 |
| AA891733 | ESTs, normalized rat kidney, Bento Soares Rattus sp. cDNA clone RKIAG10 3-end, mRNA sequence | 1.68 ± 0.42 | 0.70 ± 0.18 | ↓ 2.4 | <0.0001 |
| S45663 | SC2=synaptic glycoprotein (rats, brain, mRNA, 1178 nt) | 1.47 ± 0.31 | 0.61 ± 0.23 | ↓ 2.4 | <0.0001 |
| AA893235 | ESTs, G0/G1 switch gene 2 (predicted) | 1.78 ± 0.72 | 0.75 ± 0.36 | ↓ 2.4 | 0.00037 |
| AA799771 | ESTs, normalized rat heart, Bento Soares Rattus sp. cDNA clone RHEAF15 3-end, mRNA sequence | 1.78 ± 0.47 | 0.75 ± 0.22 | ↓ 2.4 | <0.0001 |
| AI639418 | Thyroxine deiodinase, type I | 1.47 ± 0.27 | 0.63 ± 0.27 | ↓ 2.4 | <0.0001 |
| M26594 | Rattus norvegicus malic enzyme (MAL) gene, exon 14 and complete cds | 1.74 ± 1.25 | 0.75 ± 0.24 | ↓ 2.3 | 0.01885 |
| L14323 | Phospholipase C-betal | 1.58 ± 0.16 | 0.68 ± 0.26 | ↓ 2.3 | <0.0001 |
| U17697 | Cytochrom P450 Lanosterol 14 alpha-demethylase | 1.62 ± 0.62 | 0.71 ± 0.25 | ↓ 2.3 | 0.00028 |
| AI013861 | 3-Hydroxyisobutyrate dehydrogenase | 1.44 ± 0.25 | 0.63 ± 0.21 | ↓ 2.3 | <0.0001 |
| H33426 | ESTs, farnesyl diphosphate farnesyl transferase 1 | 1.67 ± 0.40 | 0.73 ± 0.20 | ↓ 2.3 | <0.0001 |
| AF080568 | Phosphate cytidylyltransferase 2, ethanolamine | 1.66 ± 0.34 | 0.73 ± 0.26 | ↓ 2.3 | <0.0001 |
| X56228 | Thiosulfate sulphurtransferase (rhodanese) | 1.35 ± 0.17 | 0.60 ± 0.31 | ↓ 2.3 | <0.0001 |
| M86235 | Rattus norvegicus mRNA for ketohexokinase | 1.35 ± 0.16 | 0.60 ± 0.18 | ↓ 2.3 | <0.0001 |
| M12337 | Phenylalanine hydroxylase | 1.57 ± 0.17 | 0.70 ± 0.23 | ↓ 2.2 | <0.0001 |
| AI229440 | Diaphorase (NADH) (cytochrome b-5 reductase) | 1.74 ± 0.37 | 0.78 ± 0.20 | ↓ 2.2 | <0.0001 |
| M60103 | Protein tyrosine phosphatase, receptor-type, F | 1.77 ± 0.38 | 0.80 ± 0.21 | ↓ 2.2 | <0.0001 |
| U94856 | Paraoxonase 1 | 1.33 ± 0.13 | 0.60 ± 0.27 | ↓ 2.2 | <0.0001 |
| AA799645 | FXYD domain-containing ion transport regulator 1 | 1.70 ± 0.37 | 0.78 ± 0.28 | ↓ 2.2 | <0.0001 |
| AA892832 | ESTs, ELOVL family member 5, elongation of long chain fatty acids (yeast) | 1.51 ± 0.31 | 0.69 ± 0.29 | ↓ 2.2 | <0.0001 |
| M27467 | Cytochrome oxidase subunit VIc | 1.66 ± 1.12 | 0.76 ± 0.23 | ↓ 2.2 | 0.01813 |
| M33648 | Rat mitochondrial 3-hydroxy-3-methylglutaryl-CoA synthase mRNA, complete cds | 1.35 ± 0.31 | 0.63 ± 0.19 | ↓ 2.2 | <0.0001 |
| H31897 | ESTs, rat PC-12 cells, untreated Rattus norvegicus cDNA clone RPCBC56 3- end, mRNA sequence | 1.48 ± 0.32 | 0.69 ± 0.27 | ↓ 2.1 | <0.0001 |
| J03914 | Glutathione S-transferase Yb subunit; rat glutathione S-transferase Yb subunit gene, complete cds | 1.43 ± 0.27 | 0.67 ± 0.22 | ↓ 2.1 | <0.0001 |
| K00996 | Cytochrome p-450e; rat cytochrome p-450e (phenobarbital-induced) mRNA, 3′ end | 1.58 ± 0.44 | 0.76 ± 0.21 | ↓ 2.1 | <0.0001 |
| AA875050 | ESTs, weakly similar to KICE RAT CHOLINE/ETHANOLAMINE KINASE (R. norvegicus) | 1.23 ± 0.14 | 0.60 ± 0.21 | ↓ 2.1 | <0.0001 |
| M89945 | Rat farnesyl diphosphate synthase gene, exons 1-8 | 1.33 ± 0.39 | 0.65 ± 0.30 | ↓ 2.1 | <0.0001 |
| L07736 | Carnitine palmitoyltransferase 1 alpha, liver isoform | 1.39 ± 0.42 | 0.68 ± 0.18 | ↓ 2.0 | <0.0001 |
| X12459 | Arginosuccinate synthetase 1 | 1.57 ± 0.22 | 0.78 ± 0.19 | ↓ 2.0 | <0.0001 |
| S83279 | HSD IV = peroxisome proliferator-inducible gene (rats, F344, liver, mRNA partial, 2480 nt) | 1.46 ± 0.30 | 0.73 ± 0.27 | ↓ 2.0 | <0.0001 |
| X64336 | Protein C | 1.36 ± 0.38 | 0.68 ± 0.22 | ↓ 2.0 | <0.0001 |
| M13100 | Rat long interspersed repetitive DNA sequence LINE3 (L1Rn) | 1.48 ± 0.60 | 0.74 ± 0.25 | ↓ 2.0 | 0.00151 |
| M15185 | S-adenosyl-l-homocysteine hydrolase (EC 3.3.1.1) | 1.41 ± 0.27 | 0.72 ± 0.20 | ↓ 2.0 | <0.0001 |
| AA859980 | T-complex 1 | 1.64 ± 0.52 | 0.84 ± 0.17 | ↓ 2.0 | 0.00020 |
| D13921 | Acetyl-Co A acetyltransferase 1, mitochondrial | 1.28 ± 0.23 | 0.65 ± 0.19 | ↓ 2.0 | <0.0001 |
| AB000199 | Rattus norvegicus cca2 mRNA, complete cds | 1.50 ± 0.48 | 0.77 ± 0.24 | ↓ 1.9 | 0.00023 |
| AA866302 | 4-Hydroxyphenylpyruvic acid dioxygenase | 1.46 ± 0.24 | 0.76 ± 0.22 | ↓ 1.9 | <0.0001 |
| X78855 | Organic cation transporter | 1.58 ± 0.38 | 0.82 ± 0.17 | ↓ 1.9 | <0.0001 |
| X16481 | Parathymosin | 1.41 ± 0.26 | 0.73 ± 0.18 | ↓ 1.9 | <0.0001 |
| AA892821 | Aldo-keto reductase family 7, member A2 (aflatoxin aldehyde reductase) | 1.32 ± 0.24 | 0.70 ± 0.18 | ↓ 1.9 | <0.0001 |
| X55660 | Proprotein convertase subtilisin/kexin type 3 | 1.49 ± 0.36 | 0.78 ± 0.13 | ↓ 1.9 | <0.0001 |
| AI639504 | ESTs, weakly similar to T13607 hypothetical protein EG: 87B1.3—fruit fly (D. melanogaster) | 1.40 ± 0.31 | 0.75 ± 0.24 | ↓ 1.9 | <0.0001 |
| AA799762 | ESTs, similar to RIKEN cDNA 2700038C09 (predicted) | 1.49 ± 0.24 | 0.80 ± 0.30 | ↓ 1.9 | <0.0001 |
| D85844 | Rabaptin 5 | 1.47 ± 0.14 | 0.80 ± 0.17 | ↓ 1.8 | <0.0001 |
| L12016 | Immature protein; rat tricarboxylate transport protein mRNA, complete cds | 1.55 ± 0.32 | 0.84 ± 0.14 | ↓ 1.8 | <0.0001 |
| AI639097 | rx01264s rat mixed-tissue library Rattus norvegicus cDNA clone rx01264 3′, mRNA sequence | 1.64 ± 0.59 | 0.89 ± 0.32 | ↓ 1.8 | 0.00122 |
| AA945583 | Hydroxysteroid (17-beta) dehydrogenase 10 | 1.31 ± 0.25 | 0.76 ± 0.15 | ↓ 1.7 | <0.0001 |
| AI639417 | ESTs, membrane targeting (tandem) C2 domain containing 1 | 1.50 ± 0.47 | 0.86 ± 0.30 | ↓ 1.7 | 0.00092 |
| X75253 | Phosphatidylethanolamine binding protein | 1.37 ± 0.16 | 0.80 ± 0.15 | ↓ 1.7 | <0.0001 |
| Upregulated genes | |||||
| M81855 | ATP-binding cassette, sub-family B (MDR/TAP), member 1 (P-glycoprotein/multidrug resistance 1) | 0.02 ± 0.01 | 1.62 ± 0.50 | ↑ 80.2 | <0.0001 |
| AI169327 | Tissue inhibitor of metalloproteinase 1 | 0.07 ± 0.04 | 2.65 ± 1.57 | ↑ 35.6 | 0.00014 |
| M14656 | Sialoprotein (osteopontin) | 0.12 ± 0.04 | 4.19 ± 3.26 | ↑ 34.8 | 0.00121 |
| AI169612 | Adipocyte lipid-binding protein | 0.07 ± 0.08 | 1.36 ± 0.50 | ↑ 19.1 | <0.0001 |
| J03627 | S-100 related protein, clone 42C | 0.16 ± 0.05 | 2.70 ± 1.86 | ↑ 17.2 | 0.00062 |
| AI071531 | Oxidized low density lipoprotein (lectin-like) receptor 1 | 0.22 ± 0.12 | 3.01 ± 1.52 | ↑ 13.9 | <0.0001 |
| X70871 | Cyclin Gl | 0.20 ± 0.08 | 2.28 ± 0.81 | ↑ 11.6 | <0.0001 |
| AI639107 | ESTs, similar to RIKEN cDNA C730007L20 gene (LOC364396), mRNA | 0.14 ± 0.07 | 1.47 ± 0.43 | ↑ 10.2 | <0.0001 |
| AI639488 | ESTs, highly similar to A42772 mdm2 protein-rat (R. norvegicus) | 0.26 ± 0.05 | 2.59 ± 1.11 | ↑ 10.0 | <0.0001 |
| M58404 | Thymosin, beta 10 | 0.18 ± 0.06 | 1.78 ± 0.88 | ↑ 9.6 | <0.0001 |
| M32062 | Fc receptor, IgG, low affinity III | 0.20 ± 0.07 | 1.90 ± 0.80 | ↑ 9.4 | <0.0001 |
| U49729 | Bcl2-associated X protein | 0.20 ± 0.10 | 1.90 ± 0.84 | ↑ 9.4 | <0.0001 |
| AI172064 | Beta-galactoside-binding lectin | 0.17 ± 0.06 | 1.61 ± 0.89 | ↑ 9.3 | 0.00016 |
| AB010635 | Carboxylesterase 2 (intestine, liver) | 0.17 ± 0.05 | 1.49 ± 0.34 | ↑ 8.8 | <0.0001 |
| AA892506 | Coronin, actin binding protein 1A | 0.28 ± 0.16 | 2.49 ± 1.84 | ↑ 8.7 | 0.00164 |
| AA819500 | ESTs, highly similar to AC12_HUMAN ACTIVATOR 1 37 KD SUBUNIT (H. sapiens) | 0.20 ± 0.19 | 1.77 ± 0.88 | ↑ 8.7 | <0.0001 |
| M63282 | Activating transcription factor 3 | 0.37 ± 0.11 | 3.19 ± 2.43 | ↑ 8.6 | 0.00204 |
| J02962 | Lectin, galactose binding, soluble 3 | 0.18 ± 0.05 | 1.51 ± 0.49 | ↑ 8.4 | <0.0001 |
| M60921 | B-cell translocation gene 2, anti-proliferative | 0.30 ± 0.15 | 2.46 ± 1.95 | ↑ 8.3 | 0.00265 |
| M35300 | Serine protease inhibitor, kanzal type 1/trypsin inhibitor-like protein, pancreatic | 0.40 ± 0.16 | 3.36 ± 1.06 | ↑ 8.3 | <0.0001 |
| X95986 | Monomer; R. norvegicus CBR gene | 0.22 ± 0.14 | 1.84 ± 0.88 | ↑ 8.3 | <0.0001 |
| AA892775 | Lysozyme | 0.17 ± 0.05 | 1.39 ± 0.33 | ↑ 8.2 | <0.0001 |
| X62952 | Vimentin | 0.19 ± 0.05 | 1.40 ± 0.35 | ↑ 7.4 | <0.0001 |
| AA893246 | ESTs, ATPase, H+ transporting, V1 subunit D | 0.29 ± 0.06 | 1.79 ± 0.81 | ↑ 6.2 | <0.0001 |
| U18729 | Cytochrome b558 alpha-subunit | 0.23 ± 0.11 | 1.37 ± 0.79 | ↑ 6.0 | 0.00038 |
| M57276 | Leukocyte antigen (Ox-44) | 0.30 ± 0.13 | 1.80 ± 0.56 | ↑ 5.9 | <0.0001 |
| AA859536 | ESTs, brain abundant, membrane attached signal protein 1 | 0.32 ± 0.09 | 1.78 ± 0.81 | ↑ 5.5 | <0.0001 |
| AI233219 | Pineal specific PG25 protein | 0.38 ± 0.26 | 2.04 ± 0.79 | ↑ 5.4 | <0.0001 |
| X61654 | CD63 antigen | 0.30 ± 0.09 | 1.53 ± 0.76 | ↑ 5.2 | 0.00015 |
| AI639029 | ESTs, similar to lung inducible neuralized-related C3HC4 RING finger protein | 0.45 ± 0.14 | 2.33 ± 1.36 | ↑ 5.2 | 0.00056 |
| AI169104 | ESTs, highly similar to PLATELET FACTOR 4 PRECURSOR (R. norvegicus) | 0.35 ± 0.16 | 1.82 ± 0.97 | ↑ 5.1 | 0.00028 |
| X62951 | Rattus norvegicus mRNA (pBUS19) with repetitive elements | 0.52 ± 0.19 | 2.61 ± 1.74 | ↑ 5.1 | 0.00151 |
| AF001898 | Aldehyde dehydrogenase 1, subfamily A1 | 0.24 ± 0.10 | 1.15 ± 0.47 | ↑ 4.8 | <0.0001 |
| U02320 | Rattus norvegicus clone ndf40 neu differentiation factor mRNA, partial cds | 0.42 ± 0.20 | 1.97 ± 0.58 | ↑ 4.7 | <0.0001 |
| J05122 | Benzodiazepin receptor (peripheral) | 0.44 ± 0.09 | 2.07 ± 1.01 | ↑ 4.7 | 0.00016 |
| AA894004 | ESTs, highly similar to CAPG MOUSE MACROPHAGE CAPPING PROTEIN (M. musculus) | 0.41 ± 0.10 | 1.82 ± 0.90 | ↑ 4.5 | 0.00019 |
| AI231821 | Leukemia-associated cytosolic phosphoprotein stathmin | 0.39 ± 0.10 | 1.71 ± 0.85 | ↑ 4.4 | 0.00021 |
| AJ009698 | Embigin | 0.38 ± 0.14 | 1.55 ± 0.52 | ↑ 4.1 | <0.0001 |
| AA900505 | rhoB gene | 0.53 ± 0.12 | 2.09 ± 0.66 | ↑ 3.9 | <0.0001 |
| AF023087 | NGFI-A; Rattus norvegicus nerve growth factor induced factor A mRNA, partial 3′UTR | 0.35 ± 0.16 | 1.39 ± 0.38 | ↑ 3.9 | <0.0001 |
| AA891527 | Four and a half LIM domains 2 | 0.33 ± 0.14 | 1.30 ± 0.38 | ↑ 3.9 | <0.0001 |
| X13044 | CD74 antigen (invariant polpypeptide of major histocompatibility class II antigen-associated) | 0.35 ± 0.10 | 1.36 ± 0.91 | ↑ 3.8 | 0.00271 |
| X52196 | Arachidonate 5-lipoxygenase activating protein | 0.41 ± 0.08 | 1.53 ± 0.56 | ↑ 3.8 | <0.0001 |
| D13122 | ATPase inhibitor (rat mitochondrial IF1 protein) | 0.40 ± 0.09 | 1.48 ± 0.43 | ↑ 3.7 | <0.0001 |
| M76704 | O 6 -methylguanine-DNA methyltranferase | 0.33 ± 0.07 | 1.20 ± 0.27 | ↑ 3.6 | <0.0001 |
| U25264 | Selenoprotein W muscle 1 | 0.40 ± 0.16 | 1.44 ± 0.54 | ↑ 3.6 | <0.0001 |
| AI171966 | Rattus norvegicus mRNA for RT1.Mb | 0.37 ± 0.09 | 1.27 ± 0.49 | ↑ 3.5 | <0.0001 |
| X14254 | Invariant chain (AA 1-280); rat mRNA for MHC class II-associated invariant chain | 0.41 ± 0.10 | 1.39 ± 1.12 | ↑ 3.4 | 0.01136 |
| AI008888 | Cystatin beta | 0.41 ± 0.12 | 1.36 ± 0.26 | ↑ 3.3 | <0.0001 |
| X13016 | Rat mRNA for MRC OX-45 surface antigen | 0.40 ± 0.11 | 1.32 ± 0.23 | ↑ 3.3 | <0.0001 |
| M12919 | Aldolase A, fructose-bisphosphate | 0.43 ± 0.10 | 1.41 ± 0.61 | ↑ 3.3 | 0.00015 |
| U49930 | Caspase 3, apoptosis related cysteine protease (ICE-like cysteine protease) | 0.58 ± 0.11 | 1.91 ± 0.74 | ↑ 3.3 | <0.0001 |
| M83678 | RAB13 | 0.48 ± 0.07 | 1.55 ± 0.78 | ↑ 3.3 | 0.00057 |
| AF083269 | Actin-related protein complex 1b | 0.39 ± 0.08 | 1.26 ± 0.30 | ↑ 3.3 | <0.0001 |
| X52815 | Cytoskeletal gamma-actin (AA 1-375); rat mRNA for cytoplasmic-gamma isoform of actin | 0.45 ± 0.08 | 1.44 ± 0.40 | ↑ 3.2 | <0.0001 |
| U17919 | Allograft inflammatory factor 1 | 0.37 ± 0.07 | 1.17 ± 0.38 | ↑ 3.2 | <0.0001 |
| AA799717 | ESTs, polymerase (RNA) II (DNA directed) polypeptide I (predicted) | 0.50 ± 0.13 | 1.57 ± 0.74 | ↑ 3.1 | 0.00039 |
| AF017437 | Integrin-associated protein | 0.55 ± 0.18 | 1.71 ± 0.72 | ↑ 3.1 | 0.00014 |
| X07944 | Rat ornithine decarboxylase gene (EC 4.1.1.17) | 0.57 ± 0.12 | 1.77 ± 0.76 | ↑ 3.1 | 0.00018 |
| AA875523 | ESTs, similar to myosin, light polypeptide 6, alkali, smooth muscle and non-muscle isoform 1 (Canis familiaris) | 0.42 ± 0.11 | 1.30 ± 0.53 | ↑ 3.1 | 0.00011 |
| M17412 | Growth and transformation-dependent protein | 0.55 ± 0.10 | 1.70 ± 0.83 | ↑ 3.1 | 0.00058 |
| K02815 | Butyrophilin-like 2 (MHC class II associated) | 0.49 ± 0.20 | 1.47 ± 1.25 | ↑ 3.0 | 0.02078 |
| AF065438 | Rattus norvegicus mama mRNA, complete cds | 0.43 ± 0.12 | 1.28 ± 0.48 | ↑ 3.0 | <0.0001 |
| AA892005 | ESTs, SCIRP10-related protein | 0.55 ± 0.10 | 1.59 ± 0.75 | ↑ 2.9 | 0.00058 |
| J00797 | Rat alpha-tubulin gene, exon 1 | 0.49 ± 0.16 | 1.42 ± 0.29 | ↑ 2.9 | <0.0001 |
| S57478 | This sequence comes from Figure 2; lipocortin I (rats, genomic, 361 nt, segment 13 of 13) | 0.44 ± 0.07 | 1.25 ± 0.41 | ↑ 2.9 | <0.0001 |
| X51707 | Ribosomal protein S19 (AA 1-145); rat mRNA for ribosomal protein S19 | 0.47 ± 0.16 | 1.36 ± 0.47 | ↑ 2.9 | <0.0001 |
| M60666 | Tropomyosin 1 (alpha) | 0.54 ± 0.17 | 1.54 ± 0.36 | ↑ 2.8 | <0.0001 |
| D10587 | Rattus sp. mRNA for 85kDa sialoglycoprotein (LGP85), complete cds | 0.57 ± 0.20 | 1.61 ± 0.55 | ↑ 2.8 | <0.0001 |
| U64030 | dUTPase | 0.47 ± 0.10 | 1.33 ± 0.27 | ↑ 2.8 | <0.0001 |
| M34253 | Interferon regulatory factor 1 | 0.60 ± 0.17 | 1.64 ± 0.75 | ↑ 2.7 | 0.00051 |
| X53517 | CD37 antigen | 0.51 ± 0.11 | 1.39 ± 0.72 | ↑ 2.7 | 0.00143 |
| AI233173 | Expressed in nonmetastatic cells 1, protein (NM23A) (nucleoside diphosphate kinase) | 0.59 ± 0.08 | 1.58 ± 0.54 | ↑ 2.7 | <0.0001 |
| X78949 | Prolyl 4-hydroxylase alpha subunit | 0.56 ± 0.21 | 1.49 ± 0.40 | ↑ 2.6 | <0.0001 |
| X89225 | Rattus norvegicus mRNA for protein linked to system l-like neutral amino acid transport activity | 0.68 ± 0.33 | 1.77 ± 0.69 | ↑ 2.6 | 0.00017 |
| M12156 | Heterogeneous nuclear ribonucleoprotein A1 | 0.56 ± 0.10 | 1.42 ± 0.27 | ↑ 2.5 | <0.0001 |
| AF052596 | Synaptosomal-associated protein, 23 kD | 0.53 ± 0.18 | 1.34 ± 0.29 | ↑ 2.5 | <0.0001 |
| AB003042 | Complement component 5, receptor 1 | 0.53 ± 0.13 | 1.32 ± 0.23 | ↑ 2.5 | <0.0001 |
| S72594 | Tissue inhibitor of metalloproteinase type 2, TIMP-2 | 0.50 ± 0.06 | 1.24 ± 0.22 | ↑ 2.5 | <0.0001 |
| X05566 | Rat mRNA for myosin regulatory light chain (RLC) | 0.54 ± 0.10 | 1.35 ± 0.41 | ↑ 2.5 | <0.0001 |
| AF020618 | Myeloid differentiation primary response gene 116 | 0.77 ± 0.12 | 1.91 ± 1.18 | ↑ 2.5 | 0.00667 |
| X65228 | Rattus norvegicus mRNA for ribosomal protein L23a | 0.54 ± 0.20 | 1.33 ± 0.44 | ↑ 2.5 | <0.0001 |
| AA859305 | Rattus norvegicus mRNA for tropomyosin isoform 6 | 0.52 ± 0.24 | 1.27 ± 0.31 | ↑ 2.4 | <0.0001 |
| AB015433 | Solute carrier family 3 (activators of dibasic and neutral amino acid transport), member 2 | 0.69 ± 0.23 | 1.68 ± 0.63 | ↑ 2.4 | 0.00016 |
| L19699 | v-ral simian leukemia viral oncogene homolog B (ras related) | 0.58 ± 0.08 | 1.40 ± 0.26 | ↑ 2.4 | <0.0001 |
| M15474 | Striated-muscle alpha tropomyosin; Rat alpha-tropomyosin gene, exon 11 | 0.50 ± 0.18 | 1.21 ± 0.38 | ↑ 2.4 | <0.0001 |
| AA944397 | ESTs, moderately similar to HS9B RAT HEAT SHOCK PROTEIN HSP 90-BETA (R. norvegicus) | 0.52 ± 0.29 | 1.26 ± 0.44 | ↑ 2.4 | 0.00011 |
| X54617 | Rat RLC-A gene for myosin regulatory light chain, exon 4 | 0.52 ± 0.07 | 1.26 ± 0.26 | ↑ 2.4 | <0.0001 |
| AA892373 | Syntenin | 0.63 ± 0.11 | 1.51 ± 0.70 | ↑ 2.4 | 0.00117 |
| D17445 | Tyrosine 3-monooxygenase/tryptophan 5-monooxygenase activation protein, eta polypeptide | 0.54 ± 0.15 | 1.30 ± 0.38 | ↑ 2.4 | <0.0001 |
| AA893670 | ESTs, tumor protein D52 (predicted) | 0.67 ± 0.16 | 1.61 ± 0.52 | ↑ 2.4 | <0.0001 |
| X78327 | Ribosomal protein L13 | 0.59 ± 0.16 | 1.41 ± 0.52 | ↑ 2.4 | 0.00016 |
| Y12635 | ATPase, H+ transporting, lysosomal (vacuolar proton pump), beta 56/58 kDa, isoform 2 | 0.58 ± 0.18 | 1.36 ± 0.40 | ↑ 2.4 | <0.0001 |
| AI072634 | Rattus norvegicus cytokeratin-18 mRNA, partial cds | 0.71 ± 0.22 | 1.68 ± 0.53 | ↑ 2.4 | <0.0001 |
| L03201 | Cathepsin S | 0.46 ± 0.15 | 1.07 ± 0.36 | ↑ 2.3 | <0.0001 |
| AA860030 | Rattus norvegicus mRNA for class I beta-tubulin, complete cds | 0.58 ± 0.06 | 1.36 ± 0.46 | ↑ 2.3 | 0.00010 |
| M63983 | Hypoxanthine guanine phosphoribosyl transferase | 0.53 ± 0.13 | 1.24 ± 0.30 | ↑ 2.3 | <0.0001 |
| U60882 | Heterogeneous nuclear ribonucleoproteins methyltransferase-like 2 (S. cerevisiae) | 0.61 ± 0.20 | 1.41 ± 0.44 | ↑ 2.3 | <0.0001 |
| J02780 | Tropomyosin 4 | 0.54 ± 0.11 | 1.26 ± 0.19 | ↑ 2.3 | <0.0001 |
| M31038 | RT1 class Ib gene | 0.64 ± 0.33 | 1.48 ± 0.61 | ↑ 2.3 | 0.00068 |
| AA944856 | RAP1B, member of RAS oncogene family | 0.63 ± 0.12 | 1.44 ± 0.23 | ↑ 2.3 | <0.0001 |
| X76453 | HRAS like suppressor | 0.58 ± 0.27 | 1.32 ± 0.45 | ↑ 2.3 | 0.00011 |
| AA892851 | ESTs, protein tyrosine kinase 9 (predicted) | 0.61 ± 0.28 | 1.38 ± 0.69 | ↑ 2.3 | 0.00271 |
| AA892308 | ESTs, similar to hypothetical protein D11Ertd497e (predicted) | 0.66 ± 0.12 | 1.50 ± 0.53 | ↑ 2.3 | 0.00018 |
| AA893584 | ESTs, biogenesis of lysosome-related organelles complex-1, sub-unit 2 (predicted) | 0.65 ± 0.20 | 1.47 ± 0.50 | ↑ 2.2 | 0.00012 |
| AI009806 | Dynein, cytoplasmic, light chain 1 | 0.56 ± 0.08 | 1.26 ± 0.18 | ↑ 2.2 | <0.0001 |
| S82383 | TM-5; slow-twitch alpha TM/hTMnm homolog (rats, macrophages, mRNA partial, 1742 nt) | 0.52 ± 0.10 | 1.16 ± 0.21 | ↑ 2.2 | <0.0001 |
| U21871 | Rattus norvegicus outer mitochondrial membrane receptor rTOM20 mRNA, complete cds | 0.69 ± 0.20 | 1.52 ± 0.48 | ↑ 2.2 | <0.0001 |
| M37584 | H2A histone family, member Z | 0.57 ± 0.19 | 1.26 ± 0.32 | ↑ 2.2 | <0.0001 |
| AI235585 | Cathepsin D | 0.61 ± 0.24 | 1.33 ± 0.33 | ↑ 2.2 | <0.0001 |
| AI228738 | FK506-binding protein 1 (12kD) | 0.61 ± 0.13 | 1.32 ± 0.40 | ↑ 2.2 | <0.0001 |
| AA899253 | Myristoylated alanine-rich protein kinase C substrate | 0.56 ± 0.13 | 1.18 ± 0.36 | ↑ 2.1 | <0.0001 |
| D42116 | Rattus norvegicus mRNA for 5I2 antigen, clone 17, partial cds | 0.55 ± 0.11 | 1.15 ± 0.23 | ↑ 2.1 | <0.0001 |
| AI177096 | ESTs, highly similar to APT RAT ADENINE PHOSPHORIBOSYLTRANSFERASE (R. norvegicus) | 0.65 ± 0.09 | 1.36 ± 0.32 | ↑ 2.1 | <0.0001 |
| D84477 | Rattus norvegicus mRNA for RhoA, partial cds | 0.58 ± 0.21 | 1.20 ± 0.23 | ↑ 2.1 | <0.0001 |
| M12672 | GTP-binding protein (G-alpha-i2) | 0.58 ± 0.12 | 1.21 ± 0.28 | ↑ 2.1 | <0.0001 |
| AI169417 | Phosphoglycerate mutase 1 | 0.70 ± 0.21 | 1.43 ± 0.44 | ↑ 2.0 | 0.00011 |
| X78167 | Rattus norvegicus (Sprague Dawley) ribosomal protein L15 mRNA | 0.64 ± 0.12 | 1.29 ± 0.30 | ↑ 2.0 | <0.0001 |
| AI231292 | Cystatin C (cysteine proteinase inhibitor) | 0.58 ± 0.15 | 1.17 ± 0.28 | ↑ 2.0 | <0.0001 |
| AF052042 | Rattus norvegicus zinc finger protein Y1 (RLZF-Y) mRNA, complete cds | 0.61 ± 0.22 | 1.22 ± 0.28 | ↑ 2.0 | <0.0001 |
| AA799545 | ESTs, weakly similar to TCPA RAT T-COMPLEX PROTEIN 1, ALPHA SUBUNIT (R. norvegicus) | 0.74 ± 0.21 | 1.46 ± 0.46 | ↑ 2.0 | 0.00017 |
| AA892014 | HLA-B associated transcript 1A | 0.73 ± 0.20 | 1.44 ± 0.36 | ↑ 2.0 | <0.0001 |
| X58465 | Rat mRNA for ribosomal protein S5 | 0.64 ± 0.11 | 1.28 ± 0.22 | ↑ 2.0 | <0.0001 |
| AA799501 | NADH ubiquinone oxidoreductase subunit B13 | 0.72 ± 0.19 | 1.42 ± 0.40 | ↑ 2.0 | <0.0001 |
| AI169370 | Alpha-tubulin | 0.60 ± 0.14 | 1.19 ± 0.18 | ↑ 2.0 | <0.0001 |
| AF022083 | Guanine nucleotide-binding protein beta 1 | 0.71 ± 0.15 | 1.40 ± 0.29 | ↑ 2.0 | <0.0001 |
| U44948 | Cysteine-rich protein 2 | 0.75 ± 0.14 | 1.47 ± 0.21 | ↑ 2.0 | <0.0001 |
| AA942751 | Tyrosine 3-monooxygenase/tryptophan 5-monooxygenase activation protein, theta polypeptide | 0.65 ± 0.15 | 1.25 ± 0.23 | ↑ 1.9 | <0.0001 |
| X62322 | Granulin | 0.57 ± 0.23 | 1.08 ± 0.31 | ↑ 1.9 | 0.00020 |
| X02904 | Glutathione S-transferase, pi 2 | 0.67 ± 0.15 | 1.27 ± 0.33 | ↑ 1.9 | <0.0001 |
| AI639132 | ESTs, similar to RIKEN cDNA 6720467C03 (predicted) | 0.76 ± 0.16 | 1.41 ± 0.28 | ↑ 1.9 | <0.0001 |
| L38615 | Glutathione synthetase gene | 0.63 ± 0.13 | 1.15 ± 0.15 | ↑ 1.8 | <0.0001 |
| U13895 | Rattus norvegicus MSS1 protein (MSS1) mRNA, partial cds | 0.73 ± 0.22 | 1.33 ± 0.25 | ↑ 1.8 | <0.0001 |
| X14181 | Ribosomal protein L18a (AA 1-175); rat mRNA for ribosomal protein L18a | 0.72 ± 0.15 | 1.27 ± 0.27 | ↑ 1.8 | <0.0001 |
| AA944324 | ADP-ribosylation factor 6 | 0.69 ± 0.10 | 1.19 ± 0.14 | ↑ 1.7 | <0.0001 |
| AI178135 | Complement component 1, q subcomponent binding protein | 0.77 ± 0.18 | 1.26 ± 0.15 | ↑ 1.6 | <0.0001 |
Genes are ranked by fold change.
Significance was calculated using the t-test.
Figure 4.

The 256 gene expression patterns of experimental samples. (A) Hierarchical clustering results of these gene expression patterns. The results are shown in a diagram format, in which rows represent individual transcripts and columns represent time course sample. The color in each cell reflected the expression level of the corresponding sample, relative to its mean expression level. The scale extends from fluorescence ratios of 0.25 to 4 relative to the mean level for all samples. (B) Gene ontology results of 256 genes. The plots of different category of these genes by gene ontology database (http://fatigo.bioinfo.cnif.es/). (C) The hierarchical clustering results of the three biology processes are: metabolism, cell growth and/or maintenance and response stimulus. These diagrams are formatted as rows representing individual transcripts and columns representing time course sample. The color in each cell reflects the expression level of the corresponding sample relative to its mean expression level and the scale extends from fluorescence ratios of 0.25 to 4 relative to the mean level for all samples. (D) The comparison of Timpl expression between the Q-RT-PCR results and microarray data. The TaqMan® assays were conducted in triplicate for each sample, and a mean value was used for calculation of expression levels (marked by the square). To standardize the quantification of the Timpl, 18S rRNA from each sample was quantified at the same time as the target gene and a log scale was used as indicated on the right side of plot. For the two Timpl transcripts, rc_AI169327_at and rc_AI169327_g_at (marked by circle and triangle), the expression levels of the microarray data were relative to the mean of all gene expression levels and the scale is indicated on the left side of plot. The Pearson correlation coefficients (r), which compared the Q-RT-PCR result and the microarray data of two Timpl transcripts (rc_AI169327_at and rc_AI169327_g_at), were 0.79 and 0.92, respectively. (E) Endogenous Spp1 protein expression pattern in DMN-induced rat liver samples. Rat liver samples were lysed and 50 itg protein lysates were subjected to immunoblot analysis with antibody against Spp1 and Actb. Spp1 was significantly overexpressed at the protein level after the fourth week of DMN treatment.
These 256 genes were further classified on biological process, molecular function, and cellular component involved based on gene ontology analysis (http://fatigo.bioinfo.cipf.es/) (2). In either category, the largest proportion (approximately 50%) was found to be uncharacterized genes and the summary results are shown in Figure 4B. A hierarchical clustering was further employed to organize each of these top three categories of biological process into a dendrogram (Fig. 4C).
To validate our microarray data, Q-RT-PCR analysis was performed for tissue inhibitor of metalloproteinase 1 (Timp1), tissue inhibitor of metalloproteinase 2 (Timp2), matrix metalloproteinase 3 (Mmp3), and gammaglutamyl transpeptidase (Ggtp). These genes were chosen for validation because these genes were identified both in this GeneChip study and in previous studies. As determined by Q-RT-PCR, Timp1 (Fig. 4D), Timp2, Mmp3, Ggtp (data not shown), and Tgfb1 (shown previously in Fig. 1B) were elevated in DMN-treated samples. The results of Q-RT-PCR analysis of these five genes were consistent with previous reports examining these individual markers (13,19). Moreover, we observed good concordance based on the fold changes between the microarray data and the Q-RT-PCR results. As shown in Figure 4D, Timp1 expression was elevated over 20-fold in DMN-treated rats in both microarray and Q-RT-PCR. The expression patterns for Timp1 was highly correlated between the Q-RT-PCR results and the GeneChip analysis (the Pearson’s correlation coefficients were 0.79 and 0.92, respectively) (Fig. 4D), suggesting that our gene expression results were reliable when subject to more detailed analysis.
SPP1, secreted phosphoprotein 1 (also known as osteopontin), is a secreted matrix protein. Recently, it has been shown to be overexpressed in metastatic HCC (33). However, it is not known whether the expression pattern of SPP1 exhibits any changes during early liver inflammation and fibrosis. Western blotting analysis indicated that protein level of Spp1 was significantly overexpressed after the fourth week of DMN treatment (Fig. 4E), suggesting that Spp1 may be a potential early diagnostic marker for patients with inflammation and fibrosis.
Histopathology Results
To capture the progression of liver damage, a scoring system, as described in detail in Materials and Methods was used to characterize the phenotypic changes as the result of DMN-induced liver damages (Fig. 5A). There are three histopathological gradings in this study, including necroinflammatory (A0–A6), which is the sum of necrosis (N0–N3) and inflammation (I0–I3) scores, fibrosis (F0–F3), and fatty change (classified as presence or absence; +/−). In the first 2 weeks, bridging (N2, 50%) and hemorrhagic confluent necrosis (N3, 50%) were found in all rats treated with DMN. By the third to fourth week, hemorrhagic confluent necrosis (N3) was found in most DMN-treated rats (91%). In the last 2 weeks, necrosis disappeared or regressed to a low level in small regions (N1, 12.5%). In addition, our data also suggest that the 3-week treatment with a low dose of DMN induced diffuse bridging necrosis without steatosis in this rat model system. Similarly, the majority of the DMN-treated rats displayed high inflammatory infiltration, ranging from moderate (I2, 50%) to marked (I3, 50%), during the first 2 weeks. By the third to fourth week, the intensity of inflammatory cell infiltration at portal areas was still high in most DMN-treated rats (I2, 54.5% and I3, 27.2%). In the last 2 weeks, a significant regression of liver damage to a low level in small regions (I0, 75% and I1, 12.5%) was observed. Together, for the combined necrosis and inflammation scores, mild (A1–3, 62.5%) and moderate necroinflammatory (A4–6, 36.5%) patterns were found in all rats treated with DMN in the first 2 weeks (Fig. 5B). By the third to fourth week, hemorrhagic confluent necrosis, combined with portal inflammation, was found in most DMN-treated rats (A4–6, 64%). However, in the fifth to sixth week, both necrosis and inflammation had disappeared (A0, 44%) or had regressed to a low level (A1–3, 44%) in small regions.
Figure 5.
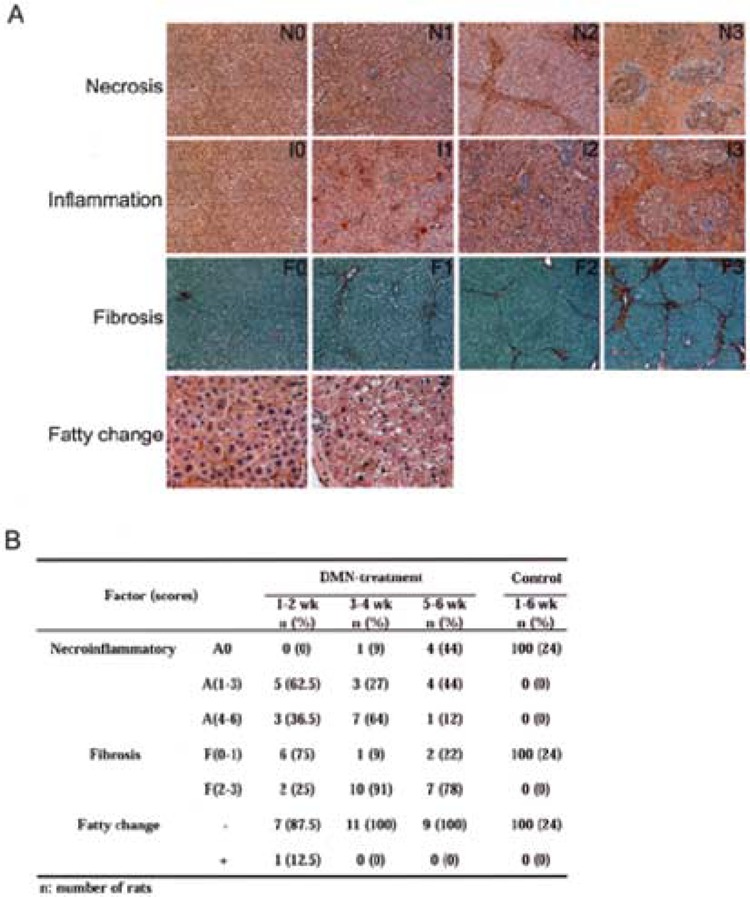
Histopathological analysis reveals DMN-induced rat liver damage. (A) The representative phenotype of the DMN-induced rat liver fibrosis was characterized by scoring the four histopathological features as follows: the necrosis scores were from N0 to N3 (the first panel), the inflammation scores were from I0 to I3 (the second panel), the fibrosis scores were from F0 to F3 (the third panel), and the fatty change scores were presence or absence (+ and −) (the last panel). The necroinflammatory scores were the sum of the necrosis and inflammation scores and range from A0 to A6. The images of the fatty change are shown at 200× original magnification, whereas the others are shown at 100× original magnification. (B) The summary of histopathological scores for the rat model. The results were ranked by time course. Necroinflammatory change was divided into three grades: A0 = “no,” A(1–3) = “mild,” and A(4–6) = “moderate” necroinflammation. Fibrosis is divided into two grades: F(0–1) = “normal to fibrous expansion of portal tracts” and F(2–3) = “bridge fibrosis to frequent bridging fibrosis with nodule formation.” The fatty change is shown as presence or absence (+/−). The number of rats was counted and used to calculate the percentage of each histopathological level at each time point.
Seventy-five percent of the DMN-treated rats had none (F0) or low levels of fibrosis (F1) in the first 2 weeks. By the third to fourth week, nearly 90% of the DMN-treated rats had high levels of fibrosis, from bridging fibrosis (F2) to frequent bridging fibrosis with focal nodule formation (F3). In the last 2 weeks, F2 and F3 were still present in 78% of DMN-treated rats. The fatty changes were only present in a few treated rats (3.7%). In contrast, there were no abnormal pathological patterns present in the control group at all (Fig. 5B). In addition, no clear abnormality was found in the kidney or spleen of the DMN-treated and normal rats (data not shown). All of the histopathological datasets have been deposited on our liver fibrosis website (see below). Together, the detailed necroinflammatory and fibrosis scoring systems of the process of the DMN-induced liver damage suggest that dramatic necrosis and inflammation took place during early liver damage progression (weeks 1–4) and this was followed by hepatic bridging fibrosis at 3–6 weeks.
Necroinflammatory and Fibrosis Candidate Genes
Necroinflammatory and fibrosis have been suggested to play important roles in liver cirrhosis progression in the rat model (1,13,24,25,27). To clarify the factors responsible for this histopathological phenotype, all rat samples were classified by histopathological evaluation with histopathological scores for necroinflammatory (A0–A6) and fibrosis (F0–F3) as describe in Figure 5B. Comparing mRNA expression levels from microarray data, 44 genes were identified by expression level to be significantly correlated with none to higher scores by the LSM method at the 5% significance level, which was separately estimated for each three-subgroup variation in necroinflammatory score (Fig. 6A and Table 4). Of these 44 genes, 33 of them were expressed at higher levels in liver with necroinflammation compared to the normal liver and of these nine were membrane or extracellular proteins as annotated by gene ontology (Fig. 6A). These nine genes might have potential to serve as marker signatures for necroinflammation. Among these 44 genes, the results for two of them [endothelial cell-specific molecule 1 (Esm1) and vimentin (Vim)] are consistent with previous studies that examined individual markers (see the Discussion) (6,38).
Figure 6.

The associated genes related to necroinflammatory and fibrosis progression. The genes related to the necroinflammatory (A) and fibrosis scores (C) were filtered from the 256 genes by their different fibrosis levels. Both upregulated and downregulated expression patterns of the necroinflammatory or fibrosis-related genes were compared against the patterns at score A0 or F0. Altogether 44 genes (35 genes and 9 ESTs) were found to be related to necroinflammatory and 62 genes (48 genes and 14 ESTs) were found to be related to the fibrosis process. Both the necroinflammatory and fibrosis-associated gene expression patterns were plotted against a time course (B and D). The color corresponds to the relative gene expression at the control first week. The scale extends from fluorescence radios of 0.25 to 4 relative to the mean level for all samples.
TABLE 4.
GENES WITH MOST SIGNIFICANT CHANGES IN EXPRESSION BETWEEN LOW AND HIGH SCORES OF NECROINFLAMMATION
| GenBank Accession No. | Description | Mean ± SD of Necroinflammatory Scores | p-Value | ||
|---|---|---|---|---|---|
| 0 | 1–3 | 4–6 | |||
| Downregulated genes | |||||
| U10357 | Pyruvate dehydrogenase kinase 2 | 1.70 ± 0.34 | 0.63 ± 0.20 | 0.64 ± 0.14 | <0.0001 |
| AA893235 | ESTs, moderate similarity to protein sp:P27469 (H. sapiens) G0S2_HUMAN putative lymphocyte G0/G1 switch protein 2 | 1.78 ± 0.72 | 0.80 ± 0.41 | 0.60 ± 0.09 | 0.001 |
| AA799771 | ESTs, EST189268 normalized rat heart, Bento Soares Rattus sp. cDNA clone RHEAF15 3-end, mRNA sequence | 1.78 ± 0.47 | 0.75 ± 0.25 | 0.75 ± 0.15 | <0.0001 |
| H31897 | ESTs, EST106437 Rat PC-12 cells, untreated Rattus norvegicus cDNA clone RPCBC56 3-end, mRNA sequence | 1.48 ± 0.32 | 0.71 ± 0.29 | 0.64 ± 0.23 | <0.0001 |
| AF080468 | Glucose-6-phosphatase, transport protein 1 | 1.62 ± 0.45 | 0.58 ± 0.30 | 0.56 ± 0.04 | <0.0001 |
| AA893552 | Kallistatin | 2.70 ± 0.52 | 0.65 ± 0.28 | 0.66 ± 0.27 | <0.0001 |
| M00002 | Apolipoprotein A-IV | 2.99 ± 1.34 | 0.80 ± 0.34 | 0.60 ± 0.17 | <0.0001 |
| H33491 | Phenylalkylamine Ca2+ antagonist (emopamil) binding protein | 1.67 ± 0.44 | 0.65 ± 0.20 | 0.67 ± 0.21 | <0.0001 |
| X78855 | Solute carrier family 22, member 1 | 1.58 ± 0.38 | 0.85 ± 0.19 | 0.74 ± 0.06 | <0.0001 |
| AI639417 | ESTs, membrane targeting (tandem) C2 domain containing 1 | 1.50 ± 0.47 | 0.93 ± 0.29 | 0.66 ± 0.23 | 0.002 |
| AB000199 | CCA2 protein | 1.50 ± 0.48 | 0.81 ± 0.23 | 0.65 ± 0.28 | 0.0006 |
| Upregulated genes | |||||
| M12156 | Heterogeneous nuclear ribonucleoprotein A1 | 0.56 ± 0.10 | 1.35 ± 0.29 | 1.60 ± 0.09 | <0.0001 |
| U64030 | Deoxyuridinetriphosphatase (dUTPase) | 0.47 ± 0.10 | 1.28 ± 0.24 | 1.46 ± 0.40 | <0.0001 |
| L38615 | Glutathione synthetase | 0.63 ± 0.13 | 1.14 ± 0.18 | 1.18 ± 0.07 | <0.0001 |
| AI169370 | ESTs, Rattus norvegicus similar to tubulin alpha-1 chain—Chinese hamster (LOC300217), mRNA | 0.60 ± 0.14 | 1.13 ± 0.17 | 1.37 ± 0.06 | <0.0001 |
| AI009806 | Dynein, cytoplasmic, light chain 1 | 0.56 ± 0.08 | 1.26 ± 0.20 | 1.23 ± 0.14 | <0.0001 |
| M12672 | GTP-binding protein (G-alpha-i2) | 0.58 ± 0.12 | 1.17 ± 0.31 | 1.31 ± 0.20 | <0.0001 |
| S72594 | Tissue inhibitor of metalloproteinase type 2, TIMP-2T | 0.50 ± 0.06 | 1.24 ± 0.24 | 1.23 ± 0.20 | <0.0001 |
| AB010635 | Carboxylesterase 2 (intestine, liver) | 0.17 ± 0.05 | 1.41 ± 0.29 | 1.73 ± 0.42 | <0.0001 |
| J02780 | Tropomyosin 4 | 0.54 ± 0.11 | 1.24 ± 0.19 | 1.29 ± 0.24 | <0.0001 |
| AI169104 | ESTs, weak similarity to protein sp:P02776 (H. sapiens) PLF4_HUMAN Platelet factor 4 precursor (PF-4) | 0.35 ± 0.16 | 1.86 ± 1.12 | 1.70 ± 0.45 | 0.0002 |
| AA944397 | Heat shock protein 86 | 0.52 ± 0.29 | 1.19 ± 0.37 | 1.47 ± 0.64 | 0.0003 |
| D17445 | Tyrosine 3-monooxygenase/tryptophan 5-monooxygenase activation protein, eta polypeptide | 0.54 ± 0.15 | 1.30 ± 0.44 | 1.29 ± 0.18 | <0.0001 |
| J00797 | Rat alpha-tubulin gene, exon 1 | 0.49 ± 0.16 | 1.31 ± 0.25 | 1.74 ± 0.11 | <0.0001 |
| U02320 | Neuregulin 1 | 0.42 ± 0.20 | 2.02 ± 0.68 | 1.81 ± 0.07 | <0.0001 |
| AA900505 | rhoB gene | 0.53 ± 0.12 | 2.10 ± 0.72 | 2.07 ± 0.55 | <0.0001 |
| AA891527 | Four and a half LIM domains 2 | 0.33 ± 0.14 | 1.18 ± 0.34 | 1.65 ± 0.30 | <0.0001 |
| X62952 | Vimentin | 0.19 ± 0.05 | 1.34 ± 0.36 | 1.57 ± 0.27 | <0.0001 |
| X78949 | Prolyl 4-hydroxylase alpha subunit | 0.56 ± 0.21 | 1.44 ± 0.44 | 1.65 ± 0.25 | <0.0001 |
| M81855 | P-glycoprotein/multidrug resistance 1 | 0.03 ± 0.01 | 1.59 ± 0.50 | 1.71 ± 0.56 | <0.0001 |
| AA860030 | Tubulin, beta 5 | 0.58 ± 0.06 | 1.16 ± 0.29 | 1.96 ± 0.33 | <0.0001 |
| X05566 | Myosin regulatory light chain | 0.54 ± 0.10 | 1.41 ± 0.45 | 1.17 ± 0.20 | <0.0001 |
| X02904 | Glutathione S-transferase, pi 2 | 0.67 ± 0.15 | 1.30 ± 0.35 | 1.17 ± 0.27 | <0.0001 |
| X13016 | CD48 antigen | 0.40 ± 0.11 | 1.31 ± 0.22 | 1.35 ± 0.28 | <0.0001 |
| S82383 | TM-5; slow-twitch alpha TM/hTMnm homolog (rats, macrophages, mRNA partial, 1742 nt) | 0.52 ± 0.10 | 1.18 ± 0.24 | 1.09 ± 0.13 | <0.0001 |
| AI233219 | Endothelial cell-specific molecule 1 | 0.38 ± 0.26 | 2.14 ± 0.85 | 1.75 ± 0.65 | <0.0001 |
| AA859536 | ESTs, brain abundant, membrane attached signal protein 1 | 0.32 ± 0.09 | 1.82 ± 0.87 | 1.65 ± 0.69 | <0.0001 |
| AI178135 | Complement component 1, q subcomponent binding protein | 0.77 ± 0.18 | 1.26 ± 0.15 | 1.24 ± 0.18 | <0.0001 |
| AA819500 | ESTs, moderate similarity to protein ref:NP_002907.1 (H. sapiens) replication factor C (activator 1) 4 (37 kD) | 0.20 ± 0.19 | 1.90 ± 0.98 | 1.41 ± 0.41 | <0.0001 |
| AI169612 | Fatty acid binding protein 4 | 0.07 ± 0.08 | 1.36 ± 0.56 | 1.38 ± 0.34 | <0.0001 |
| L19699 | v-ral simian leukemia viral oncogene homolog B | 0.58 ± 0.08 | 1.42 ± 0.30 | 1.36 ± 0.01 | <0.0001 |
| U17919 | Allograft inflammatory factor 1 | 0.37 ± 0.07 | 1.17 ± 0.43 | 1.16 ± 0.26 | <0.0001 |
| AF023087 | Early growth response 1 | 0.35 ± 0.16 | 1.34 ± 0.33 | 1.55 ± 0.55 | <0.0001 |
| X54617 | Rat RLC-A gene for myosin regulatory light chain, exon 4 | 0.52 ± 0.07 | 1.30 ± 0.27 | 1.11 ± 0.19 | <0.0001 |
Significance was calculated using least squares means of ANOVA.
Using the Student’s t-test, 62 differentially expressed genes (32 upregulated and 30 downregulated) between the F0–1 and F2–3 level of fibrosis were identified at the 5% significance level, estimated using only two subgroup variations for the fibrosis score (Fig. 6C, and Table 5). Similarly, annotation based on the gene ontology database revealed that there were 15 membrane and extracellular proteins that showed a fibrosis signature. In agreement with previous studies, three genes, including Timp1, CD63, antigen (Cd63), and annexin A1 (Anxa1), exhibited similar gene expression patterns during liver fibrosis (3,22,32,43). These necroinflammatory and fibrosis-associated gene expression patterns were plotted over the time course (Fig. 6B, 6D). The color corresponds to relative gene expression using the first week as the control. These observations indicated that oligo-microarray analysis is a powerful approach for monitoring molecular events during liver injury and repair where the pathogenesis is unknown, and these signature genes could discriminate successfully between the low-score and the high-score histopathology groups. Together, the genes would seem to be responsible for the early stage formation of necroinflammation and fibrosis; thus, we believe they are possible early markers for the detection of fibrosis.
TABLE 5.
GENES WITH MOST SIGNIFICANT CHANGES IN EXPRESSION BETWEEN LOW AND HIGH SCORES OF FIBROSIS
| GenBank Accession No. | Description | Mean ± SD of Fibrosis Score | Fold Change | p-Value | |
|---|---|---|---|---|---|
| 0–1 | 2–3 | ||||
| Downregulated genes | |||||
| D14564 | Rattus norvegicus gene for l-gulono-gamma-lactone oxidase, exon 7 | 2.48 ± 1.21 | 0.38 ± 0.28 | ↓ 6.6 | <0.0001 |
| AA892345 | Dimethylglycine dehydrogenase precursor | 2.23 ± 1.07 | 0.42 ± 0.27 | ↓ 5.3 | <0.0001 |
| AI232087 | Rattus norvegicus transcribed sequences | 2.05 ± 0.83 | 0.49 ± 0.28 | ↓ 4.2 | <0.0001 |
| M77479 | Solute carrier family 10, member 1 | 1.42 ± 0.58 | 0.36 ± 0.33 | ↓ 4.0 | <0.0001 |
| S46785 | Insulin-like growth factor binding protein complex acid-labile subunit (rats, liver, mRNA, 2190 nt) | 1.69 ± 0.59 | 0.47 ± 0.29 | ↓ 3.6 | <0.0001 |
| U68168 | Kynureninase (l-kynurenine hydrolase) | 1.61 ± 0.58 | 0.47 ± 0.35 | ↓ 3.4 | <0.0001 |
| U32314 | Pyruvate carboxylase | 1.59 ± 0.63 | 0.48 ± 0.33 | ↓ 3.3 | <0.0001 |
| D90109 | Fatty acid Coenzyme A ligase, long chain 2 | 1.42 ± 0.52 | 0.44 ± 0.26 | ↓ 3.3 | <0.0001 |
| D28560 | Ectonucleotide pyrophosphatase/phosphodiesterase 2 | 1.27 ± 0.40 | 0.39 ± 0.34 | ↓ 3.2 | <0.0001 |
| AF080468 | Glucose-6-phosphatase, transport protein 1 | 1.42 ± 0.53 | 0.45 ± 0.16 | ↓ 3.2 | <0.0001 |
| AA817846 | ESTs, strong similarity to protein ref:NP_004042.1 (H. sapiens) 3-hydroxybutyrate dehydrogenase precursor | 1.43 ± 0.52 | 0.45 ± 0.40 | ↓ 3.2 | <0.0001 |
| AA926193 | Sulfotransferase family, cytosolic, 1C, member 2 | 1.56 ± 0.57 | 0.50 ± 0.28 | ↓ 3.1 | <0.0001 |
| X06150 | Glycine methyltransferase | 1.45 ± 0.45 | 0.48 ± 0.34 | ↓ 3.0 | <0.0001 |
| M59861 | 10-Formyltetrahydrofolate dehydrogenase | 1.54 ± 0.66 | 0.52 ± 0.33 | ↓ 3.0 | <0.0001 |
| D63704 | Dihydropyrimidinase | 1.42 ± 0.32 | 0.48 ± 0.29 | ↓ 3.0 | <0.0001 |
| M11266 | Ornithine transcarbamylase | 1.35 ± 0.42 | 0.46 ± 0.26 | ↓ 2.9 | <0.0001 |
| AA799560 | N-myc downstream-regulated gene 2 | 1.35 ± 0.43 | 0.48 ± 0.30 | ↓ 2.8 | <0.0001 |
| AA893244 | ESTs, moderate similarity to protein pdb:1LBG (E. coli) B Chain B | 1.88 ± 0.74 | 0.67 ± 0.24 | ↓ 2.8 | <0.0001 |
| D85035 | Dihydropyrimidine dehydrogenase | 1.43 ± 0.44 | 0.53 ± 0.21 | ↓ 2.7 | <0.0001 |
| U10357 | Pyruvate dehydrogenase kinase 2 | 1.48 ± 0.49 | 0.55 ± 0.14 | ↓ 2.7 | <0.0001 |
| J03588 | Guanidinoacetate methyltransferase | 1.12 ± 0.34 | 0.41 ± 0.30 | ↓ 2.7 | <0.0001 |
| U72497 | Fatty acid amide hydrolase | 1.56 ± 0.57 | 0.58 ± 0.25 | ↓ 2.7 | <0.0001 |
| Z50144 | Kynurenine aminotransferase 2 | 1.37 ± 0.36 | 0.53 ± 0.34 | ↓ 2.6 | <0.0001 |
| M23601 | Monoamine oxidase B | 1.45 ± 0.44 | 0.60 ± 0.37 | ↓ 2.4 | 0.0001 |
| M12337 | Phenylalanine hydroxylase | 1.39 ± 0.35 | 0.61 ± 0.20 | ↓ 2.3 | <0.0001 |
| AI013861 | 3-Hydroxyisobutyrate dehydrogenase | 1.27 ± 0.37 | 0.56 ± 0.22 | ↓ 2.3 | <0.0001 |
| M86235 | Rattus norvegicus mRNA for ketohexokinase | 1.19 ± 0.32 | 0.54 ± 0.18 | ↓ 2.2 | <0.0001 |
| X64336 | Protein C | 1.23 ± 0.40 | 0.59 ± 0.20 | ↓ 2.1 | <0.0001 |
| M15185 | S-Adenosyl-l-homocysteine hydrolase (EC 3.3.1.1); rat S-adenosyl-l-homocysteine hydrolase mRNA, complete cds | 1.28 ± 0.34 | 0.63 ± 0.14 | ↓ 2.0 | <0.0001 |
| X12459 | Arginosuccinate synthetase | 1.40 ± 0.38 | 0.73 ± 0.20 | ↓ 1.9 | <0.0001 |
| M13100 | ORFa′; ORFa; ORFb; ORFc; ORFd1; ORFd2; putative; rat long interspersed repetitive DNA sequence LINE3 (L1Rn) | 1.32 ± 0.59 | 0.69 ± 0.29 | ↓ 1.9 | 0.0022 |
| Upregulated genes | |||||
| AI169327 | Tissue inhibitor of metalloproteinase 1 | 0.43 ± 0.65 | 3.23 ± 1.65 | ↑ 7.4 | 0.0017 |
| J03627 | S-100 related protein, clone 42C | 0.46 ± 0.55 | 3.37 ± 1.98 | ↑ 7.3 | 0.0041 |
| AI071531 | Oxidized low density lipoprotein (lectin-like) receptor 1 | 0.56 ± 0.62 | 3.73 ± 1.36 | ↑ 6.7 | 0.0002 |
| M60921 | B-cell translocation gene 2, anti-proliferative | 0.56 ± 0.50 | 3.03 ± 2.20 | ↑ 5.4 | 0.0154 |
| M63282 | Activating transcription factor 3 | 0.77 ± 0.74 | 3.80 ± 2.82 | ↑ 4.9 | 0.0189 |
| X95986 | Monomer; Rattus norvegicus CBR gene | 0.48 ± 0.54 | 2.14 ± 0.88 | ↑ 4.5 | 0.0007 |
| AA859536 | Rattus norvegicus transcribed sequences | 0.49 ± 0.32 | 2.16 ± 0.72 | ↑ 4.4 | 0.0002 |
| AI639488 | ESTs, moderate similarity to protein prf:1814460A (H. sapiens) 1814460A p53-associated protein (Homo sapiens) | 0.68 ± 0.76 | 2.93 ± 1.23 | ↑ 4.3 | 0.0008 |
| J05122 | Benzodiazepin receptor | 0.63 ± 0.35 | 2.51 ± 0.95 | ↑ 4.0 | 0.0007 |
| X61654 | CD63 antigen | 0.46 ± 0.32 | 1.82 ± 0.79 | ↑ 3.9 | 0.0016 |
| AI104781 | Arachidonate 5-lipoxygenase activating protein | 0.61 ± 0.42 | 2.38 ± 1.14 | ↑ 3.9 | 0.0027 |
| AI169104 | ESTs, weak similarity to protein sp:P02776 (H. sapiens) PLF4_HUMAN Platelet factor 4 precursor (PF-4) | 0.55 ± 0.40 | 2.16 ± 1.03 | ↑ 3.9 | 0.0027 |
| AI171962 | Annexin 1 | 0.57 ± 0.39 | 1.88 ± 0.56 | ↑ 3.3 | 0.0001 |
| X62951 | R. norvegicus mRNA (pBUS19) with repetitive elements | 0.89 ± 1.10 | 2.92 ± 1.69 | ↑ 3.3 | 0.0114 |
| U02320 | Neuregulin 1 | 0.69 ± 0.52 | 2.19 ± 0.59 | ↑ 3.2 | <0.0001 |
| AA900505 | rhoB gene | 0.78 ± 0.47 | 2.38 ± 0.61 | ↑ 3.1 | <0.0001 |
| M12919 | Aldolase A | 0.54 ± 0.23 | 1.66 ± 0.59 | ↑ 3.1 | 0.0008 |
| AJ009698 | Embigin | 0.57 ± 0.37 | 1.74 ± 0.54 | ↑ 3.0 | 0.0002 |
| Downregulated genes | |||||
| AA875523 | Rattus norvegicus similar to Myosin light chain alkali, smooth-muscle isoform (MLC3SM) (LOC297831), mRNA | 0.53 ± 0.26 | 1.52 ± 0.49 | ↑ 2.8 | 0.0005 |
| M35300 | Serine protease inhibitor, Kazal type 1 | 1.18 ± 1.49 | 3.29 ± 1.06 | ↑ 2.8 | 0.0008 |
| AF017437 | Integrin-associated protein | 0.72 ± 0.36 | 1.96 ± 0.76 | ↑ 2.7 | 0.0020 |
| AF020618 | Myeloid differentiation primary response gene 116 | 0.89 ± 0.27 | 2.24 ± 1.32 | ↑ 2.5 | 0.0231 |
| X52815 | Unnamed protein product; cytoskeletal gamma-actin (AA 1-375); rat mRNA for cytoplasmic-gamma isoform of actin | 0.63 ± 0.35 | 1.57 ± 0.41 | ↑ 2.5 | 0.0001 |
| AA892851 | Rattus norvegicus transcribed sequences | 0.68 ± 0.28 | 1.63 ± 0.73 | ↑ 2.4 | 0.0073 |
| AI233173 | Expressed in nonmetastatic cells 1 | 0.74 ± 0.32 | 1.77 ± 0.52 | ↑ 2.4 | 0.0005 |
| AA892373 | Syntenin | 0.75 ± 0.26 | 1.71 ± 0.78 | ↑ 2.3 | 0.0098 |
| AA893584 | Rattus norvegicus transcribed sequence with weak similarity to protein ref:NP_500967.1 (C. elegans) | 0.76 ± 0.26 | 1.67 ± 0.51 | ↑ 2.2 | 0.0011 |
| AI072634 | Keratin complex 1, acidic, gene 18 | 0.86 ± 0.33 | 1.86 ± 0.57 | ↑ 2.2 | 0.0011 |
| AI177096 | ESTs, moderate similarity to protein pir:RTHUA (H. sapiens) RTHUA adenine phosphoribosyltransferase (EC 2.4.2.7) | 0.76 ± 0.22 | 1.48 ± 0.33 | ↑ 1.9 | 0.0002 |
| D17445 | Tyrosine 3-monooxygenase/tryptophan 5-monooxygenase activation protein, eta polypeptide | 0.74 ± 0.21 | 1.35 ± 0.26 | ↑ 1.8 | <0.0001 |
| AI639132 | ESTs, similar to RIKEN cDNA 6720467C03 (predicted) | 0.88 ± 0.28 | 1.48 ± 0.31 | ↑ 1.7 | 0.0005 |
Genes were ranked by fold change. Significance was calculated using t-test.
Data Comparison
To assess the validity of our expression cassette of genes for distinguishing liver damage from rat liver sample specimens, we explored the overlap between our data and other published studies. We compared with four datasets. First was the intersection between our 256 significant genes and the Utsunomiya et al. gene lists, which identified 100 differentially expressed genes in TAA-induced liver fibrosis using rat cDNA microarray (45). Of these 100 genes, 14 genes, including 7 genes upregulated and 7 genes downregulated, overlapped with th our most significant 256 gene list as shown in Table 6. Failure to detect the remaining genes is probably due to most of them having “absent” calls in Affymetrix chips. Therefore, these genes did not qualify under the conditions of our analysis. Alternatively, TAA and DMN might induce different responses during liver fibrosis. In addition, there can be substantial variation in the data, which can be generated across multiple microarray platforms during the course of data analysis. Therefore, it is not surprising that only a few genes overlapped in this data comparison (44). Secondly, to allow a comparison against microarray data from patients with cirrhosis (26), we converted the most significant 256 rat genes by the GeneSpring software homology table and the HomoloGene NCBI database (http://www.ncbi.nlm.nih.gov/entrez/query.fcgi?db=homologene) into their human ortholog genes, and 213 genes were listed. From studies by Kim and his colleagues, the results showed that 8 genes, including 6 genes in the hepatocellular carcinoma-associated signature table and 2 genes in etiology-associated signature table overlapped with our most significant human homolog gene list (26) (Table 6). Even though only a few genes overlapped in this data comparison, these 213 gene expression pattern changes might aid for the detection of human early liver injury. Thirdly, the liver sample response to injury includes both hepatic bridging fibrosis and regeneration with the outcome determined by the injury (46). On comparing White’s study (50) with our 256 genes, there were 21 upregulated and 13 downregulated genes that occurred in both datasets. These overlapping genes might be referred to as liver regeneration signatures. Finally, 14 out of 39 well-known fibrosis markers (13,19,23) could be found in our results (Supplemental Table 1). Two, including Timp1 and Timp2, out of 14 genes share similar gene expression patterns to the human liver damage phenotype against our microarray dataset, as shown in Supplemental Table 2. The results suggest that these findings from a study generated using an animal model system should be extendable to clinical studies. When the liver is subjected to damage, we believed that these genes might potentially provide information for clinical and medical studies based on our time course results.
TABLE 6.
SUMMARY OF MICROARRAY DATASETS COMPARISON
| GenBank Accession No. | Description | Microarray Dataset | |||||
|---|---|---|---|---|---|---|---|
| 256 Genes | Rat* | Human† | Human‡ | Mice§ | Marker¶ | ||
| AA859305 | Tropomyosin isoform 6 | ↑ | ↑ | ||||
| AA875523 | Similar to 17,000 Da myosin light chain (LOC362816), mRNA | ↑ | ↑ | ||||
| AA892775 | Lysozyme | ↑ | ↑ | ||||
| AF001898 | Aldehyde dehydrogenase family 1, member A1 | ↑ | ↑ | ||||
| AF023087 | Early growth response 1 | ↑ | ↑ | ↑ | |||
| AF083269 | Actin related protein 2/3 complex, subunit 1B | ↑ | ↑ | ||||
| AI072634 | Keratin complex 1, acidic, gene 18 | ↑ | ↑ | ||||
| All69327 | Tissue inhibitor of metalloproteinase 1 | ↑ | ↑ | ||||
| AI169370 | Alpha-tubulin | ↑ | ↑ | ||||
| AI231292 | Cystatin C | ↑ | ↑ | ||||
| J02962 | Lectin, galactose binding, soluble 3 | ↑ | ↑ | ||||
| J05122 | Benzodiazepin receptor | ↑ | ↑ | ↑ | |||
| L38615 | Glutathione synthetase | ↑ | ↑ | ||||
| M12156 | Heterogeneous nuclear ribonucleoprotein A1 | ↑ | ↑ | ||||
| M12919 | Aldolase A | ↑ | ↑ | ||||
| M37584 | H2A histone family, member Z | ↑ | ↑ | ||||
| M58404 | Thymosin, beta 10 | ↑ | ↑ | ||||
| M60921 | B-cell translocation gene 2, antiproliferative | ↑ | ↑ | ||||
| M63282 | Activating transcription factor 3 | ↑ | ↑ | ||||
| S72594 | Tissue inhibitor of metalloproteinase type 2 | ↑ | ↑ | ||||
| U60882 | Heterogeneous nuclear ribonucleoproteins methyltransferase-like 2 (S. cerevisiae) | ↑ | ↓ | ||||
| X02904 | Glutathione S-transferase, pi 2 | ↑ | ↑ | ||||
| X07944 | Rat ornithine decarboxylase gene (EC 4.1.1.17) | ↑ | ↑ | ||||
| X54617 | Myosin regulatory light chain | ↑ | ↑ | ↑ | |||
| X58465 | Rat mRNA for ribosomal protein S5 | ↑ | ↑ | ||||
| X61654 | CD63 antigen | ↑ | ↑ | ||||
| X62322 | Granulin | ↑ | ↑ | ||||
| X70871 | Cyclin Gl | ↑ | ↓ | ||||
| AA799560 | N-myc downstream-regulated gene 2 | ↓ | ↓ | ||||
| AA799645 | FXYD domain-containing ion transport regulator 1 | ↓ | ↓ | ↓ | |||
| AA892832 | Fatty acid elongase 1 | ↓ | ↑ | ||||
| AF080468 | Glucose-6-phosphatase, transport protein 1 | ↓ | ↓ | ||||
| AI013861 | 3-Hydroxyisobutyrate dehydrogenase | ↓ | ↓ | ||||
| AI177004 | 3-Hydroxy-3-methylglutaryl-coenzyme A synthase 1 | ↓ | ↓ | ||||
| D00362 | Esterase 2 | ↓ | ↑ | ||||
| D13921 | Acetyl-coenzyme A acetyltransferase 1 | ↓ | ↓ | ||||
| D90109 | Fatty acid Coenzyme A ligase, long chain 2 | ↓ | ↓ | ||||
| J02592 | Glutathione S-transferase Yb subunit | ↓ | ↓ | ||||
| J02791 | Acetyl-coenzyme A dehydrogenase, medium chain | ↓ | ↓ | ↓ | |||
| M00002 | Apolipoprotein A-IV | ↓ | ↓ | ||||
| Ml 1670 | Catalase | ↓ | ↓ | ||||
| M12337 | Phenylalanine hydroxylase | ↓ | ↓ | ||||
| M16235 | Lipase, hepatic | ↓ | ↓ | ||||
| M26127 | Cytochrome P450, la2 | ↓ | ↓ | ||||
| M33648 | 3-Hydroxy-3-methylglutaryl-coenzyme A synthase 2 | ↓ | ↑ | ||||
| M64755 | Cysteine-sulfinate decarboxylase | ↓ | ↓ | ||||
| M67465 | Hydroxy-delta-5-steroid dehydrogenase, 3 beta- and steroid delta-isomerase | ↓ | ↓ | ||||
| M77479 | Solute carrier family 10, member 1 | ↓ | ↓ | ↓ | |||
| M89945 | Rat farnesyl diphosphate synthase gene, exons 1-8 | ↓ | ↓ | ||||
| S83279 | Peroxisome proliferator-inducible gene | ↓ | ↓ | ||||
| U17697 | Cytochrome P450, subfamily 51 | ↓ | ↓ | ||||
| U94856 | Paraoxonase 1 | ↓ | ↓ | ↓ | |||
| X06150 | Glycine methyltransferase | ↓ | ↓ | ||||
| X12459 | Arginosuccinate synthetase | ↓ | ↓ | ||||
SUPPLEMENTAL TABLE 1.
THE GENE EXPRESSION PATTERNS OF FIBROSIS MARKERS BY QUANTITATIVE REAL-TIME PCR AND MICROARRAY DATA
| Markers | Description | Invasive Detection | Expression Stage | Qualitative RT-PCR* | Probe Set ID | Microarray Data* | Reference |
|---|---|---|---|---|---|---|---|
| Lox | Lysyl oxidase | yes | mRNA | S66184_s_at | ↑ | 13 | |
| rc_AA875582_at | ↑ | ||||||
| rc_AI102814_at | ↓ | ||||||
| rc_AI234060_s_at | ↑ | ||||||
| P4h | Prolyl 4-hydroxylase | yes | mRNA | M21476_s_at | ND | 13 | |
| X02918_at | ↓ | ||||||
| X02918_g_at | ND | ||||||
| X78949_at | ↑ | ||||||
| Tnc | Tenascin C | yes | mRNA | U09361_s_at | ↑ | 13,19 | |
| U09401_s_at | ↓ | ||||||
| U15550_at | ↑ | ||||||
| Mmp2 | Matrix metalloproteinase 2 (72 kDa type IV collagenase) | yes | mRNA | U65656_at | ↑ | 13,19 | |
| X71466_at | ↓ | ||||||
| Mmp3 | Matrix metalloproteinase 3 | yes | mRNA | ↑ | X02601_at | ↑ | 19 |
| Timpl | Tissue inhibitor of metalloproteinase 1 | yes | mRNA, protein | ↑ | rc_AI169327_at | ↑ | 13,19,23 |
| rc_AI169327_g_at | ↑ | ||||||
| Timp2 | Tissue inhibitor of metalloproteinase type 2 | yes | mRNA, protein | ↑ | S72594_s_at | ↑ | 19,23 |
| Col4 | Collagen, type IV, alpha 3 | yes | mRNA, protein | L4728 l_at | ↓ | 13 | |
| Tgfbl | Transforming growth factor beta-1 gene | no | mRNA, protein | ↑ | X52498cds_at | ↑ | 23 |
| A2m | Alpha-2-macroglobulin | no | protein | X13983mRNA_at | ↓ | 13 | |
| M22670cds_g_at | ↑ | ||||||
| rc_AA900582_at | ↑ | ||||||
| rc_AI113046_at | ↑ | ||||||
| Vtn | Vitronectin | no | protein | U44845_at | ↓ | 19 | |
| Hp | Haptoglobin | no | protein | K01933_at | ↓ | 13 | |
| Ggt | Gamma-glutamyl transpeptidase | no | protein | ↑ | M33822_at | ↑ | 13 |
| X03518cds#3_s_at | ↑ | ||||||
| Apoa | Apolipoprotein A | no | protein | M00001_i_at | ↑ | 13 | |
| M00002_at | ↓ | ||||||
| X03468_at | ↓ |
Genes were ranked by invasive detection.
↑: upregulation to control; ↓: downregulation to control; ND: no different to control.
SUPPLEMENTAL TABLE 2.
THE SIMILAR EXPRESSION GENES OF FIBROSIS MARKERS
| Markers | GenBank ID | Gene Symbol | Gene Name | Pearson Correlation |
|---|---|---|---|---|
| Tissue inhibitor of metalloproteinase 1 | S72594 | Timp2 | Tissue inhibitor of metalloproteinase type 2, TIMP-2 | 0.99 |
| M32062 | Fcgr3 | Fc receptor, IgG, low affinity III | 0.99 | |
| M76704 | Mgmt | 06-methylguanine-DNA methyltransferase | 0.98 | |
| M35300 | Spink1 | Serine protease inhibitor, Kazal type 1 | 0.98 | |
| M58404 | Tmsb10 | Thymosin, beta 10 | 0.98 | |
| AI171962 | Anxa1 | Annexin 1 | 0.97 | |
| AB010635 | Ces2 | Carboxylesterase 2 (intestine, liver) | 0.97 | |
| M81855 | Pgy1 | P-glycoprotein/multidrug resistance 1 | 0.97 | |
| J03627 | S100a10 | S-100 related protein, clone 42C | 0.97 | |
| X62952 | Vim | Vimentin | 0.97 | |
| Tissue inhibitor of metalloproteinase 2 | AI169327 | Timp1 | Tissue inhibitor of metalloproteinase 1 | 0.99 |
| M32062 | Fcgr3 | Fc receptor, IgG, low affinity III | 0.98 | |
| M76704 | Mgmt | 06-methylguanine-DNA methyltransferase | 0.98 | |
| M81855 | Pgy1 | P-glycoprotein/multidrug resistance 1 | 0.98 | |
| J02962 | Lgals3 | Lectin, galactose binding, soluble 3 | 0.98 | |
| M58404 | Tmsb10 | Thymosin, beta 10 | 0.98 | |
| M12156 | Hnrpa1 | Heterogeneous nuclear ribonucleoprotein A1 | 0.98 | |
| M35300 | Spink1 | Serine protease inhibitor, Kazal type 1 | 0.98 | |
| AA892775 | Lyz | Lysozyme | 0.97 | |
| S76511 | Bax | Bax=apoptosis inducer (rats, ovary, mRNA Partial, 402 nt) | 0.97 |
Interactive and Knowledge-Sharing Website for Liver Necroinflammation and Fibrosis
To elucidate the detailed molecular signatures of liver necroinflammation and fibrosis, a large amount of sample is needed. Due to limited sample sources, our dataset only goes a small way towards a full understanding of liver fibrogenesis. To strengthen our dataset, a proprietary liver necroinflammatory and fibrosis-related gene expression data warehouse has been established, consisting of both ours and other publicly accessible microarray datasets, even though such integration remains difficult. We have downloaded the publicly accessible liver fibrosis microarray dataset (45) and manually keyed-in those genes reported to show differential expression patterns from liver fibrosis tissue samples. These collected datasets will serve as reference databases for us during further validation. All of these datasets have been deposited and reorganized at a website (http://LiverFibrosis.nchc.org.tw:8080/LF). We have deposited 24 microarray datasets (12 controls, 12 DMN treated) with four data formats: CEL, TXT, EXP, and DAT for free download and analysis. In addition, a necroinflammatory and fibrosis-related gene list from the public accessible microarray datasets and gene annotation is included at this website.
We implemented “softbots,” or software agents, to collect scattered gene annotations either by mining data sources directly or by querying publicly accessible databases. For each liver fibrosis-related gene, the gene name, aliases, locus, gene ontology, protein–protein interactions, and various links to important bioinformatics and literature websites (PubMed, Uni Gene, GeneCards, GO, etc.) are displayed such that researchers may easily find the information they need. This results in an information-harvesting system that supports flexible storage and presentation and provides necessary accurate information to liver fibrosis researchers. The system supports both flexible storage and presentation. The result is an annotation engine that provides the precise information necessary for liver fibrosis research.
To organize the histopathological data from the control group and DMN group, a histopathological section has been established in same website. This website contains the 6-week time course dataset and each experimental week of the histopathological slices taken from 2–7 different rats. In addition, the biochemical data for each rat are also included in the view panel within the website.
DISCUSSION
Liver fibrosis represents a continuous disease spectrum characterized by an increase in total liver collagen and other matrix proteins that disrupt the architecture of the liver and impair liver function (11,12). The progression of fibrosis in the liver is a response to necroinflammatory changes. The overall liver fibrosis process is a dynamic inflammation and repair, and has the potential to be resolved (23). In this study, we applied microarray analysis to continuously monitor the gene expression profile of DMN-induced liver fibrosis over 6 weeks. Classification based on histopathological gradings identified 256 liver damage-related genes and these could be divided into 44 and 62 features that acted as the best necroinflammatory and fibrosis discriminators. Moreover, data comparisons with other microarray datasets further elucidated the liver regeneration subgroups. To our knowledge, this is the first report to delineate the molecular portrait of liver fibrosis based on the process of necroinflammation, fibrosis, and liver regeneration over a time course. Interestingly, among the 256 liver damage-related genes, approximately half of them are not well annotated. In comparison with 39 well-known fibrosis markers, our study substantially increases the number of fibrosis signatures, although this inventory is not yet complete. Our data not only set the stage for a functional dissection of these liver fibrosis-related genes but also open up a new perspective on several uncharacterized novel genes linked to the human disease and provides potential targets for the rational development of therapeutic drugs.
Accumulation of data with respect to the expression profiles of liver specimens, histopathological data, and biochemical data will help us to understand the precise molecular mechanisms of necroinflammatory progression and liver hepatic bridging fibrosis. However, how to effectively utilize the vast amount of information gathered through this study remains a significant challenge. This is simply because gene annotation is scattered and its content is hard to update or improve. Therefore, it was imperative to design an information-harvesting infrastructure that supports flexible storage and presentation as well as providing a good content management environment. Using this study, we wish to cause a paradigm shift by providing a web-based service and by publishing organized information via semantic webs. Softbots, or software agents, are implemented to collect scattered gene annotations either by mining data sources directly or by querying publicly accessible databases. Because our website is an integrated biological information portal with the built-in online editing tools and versatile sharing mechanisms, we welcome other researchers who might want to contribute their liver fibrosis-related microarray and/or proteomics datasets into this public accessible website. Moreover, this website also hyperlinks to the newly established ECHO, the Encyclopedia of Hepatocellular Carcinoma Genes Online (http://ehco.nchc.org.tw), allowing geographically distant researchers to freely access these valuable genomic datasets. Expansion of this dataset is part of our continuing effort (by reviewing the literature) aimed at elucidating the transcriptome and it will easily allow the inclusion of additional gene expression data contributed by other investigators worldwide.
Among the necroinflammatory-associated genes, endothelial cell-specific molecule (Esm1) was over-expressed in DMN-treated samples. Esm1 was originally identified in lung and kidney endothelial cells, where its expression is regulated by cytokines, especially interleukin-6 (IL-6) (6,49). The expression of Esm1 is related to systemic inflammation in adipocytes and might play a role in the regulation of the inflammatory processes by a protein kinase C-mediated signal pathway (49). Based on a hepatobiliary disease study, vimentin (Vim), the cytoskeleton gene, was also found to be overexpressed in bile ductules and interlobular bile ducts. Moreover, vimentin shows a heterogeneous antigenic expression as intermediate filaments in biliary epithelial cells and may be related to proliferation and reorganization (38).
CD63, a transmembrane protein, is also one of our fibrosis gene signatures and is upregulated after DMN treatment. Hepatic stellate cells (HSC), also known as Ito cells, are now well known to be a key cellular element involved in the development of hepatic fibrosis. Following chronic injury, HSCs activate or differentiate into myofibroblast-like cells, acquiring contractile, proinflammatory, and fibrogenic properties (30,35,36). Activated HSCs migrate and accumulate at the sites of tissue repair, secreting large amounts of extracellular matrix proteins during the progression of fibrosis. Activated HSC have been identified as the major collagen (one of extracellular matrix proteins)-producing cells and an initiator of liver fibrosis when the liver is injured (4). It has been demonstrated that inhibition of CD63 will inhibit collagen secretion and HSC migration (32). It has been suggested that CD63 might be a novel diagnostic marker for the injured liver. Moreover, in an alcoholic liver disease (ALD) study (43), Annexin A1 (Anxa1) was highly expressed after liver injury. A recent study has indicated that alcohol-initiated liver injury occurs via inflammation. ALD progression involves continuing liver injury, fibrosis, and impaired liver regeneration. It suggested that Anxa1 might play a role in the progression of fibrosis.
Chronic inflammation and hepatic cell damage might provide the proliferation stimuli for the promotion of hepatocarcinogenesis (42). Proteomics analysis using human primary biliary cirrhosis and normal tissues indicated that SPP1 is also highly expressed in primary biliary cirrhosis and is involved in the formation of epithelioid granuloma (18). Recently, SPP1, which is a secreted matrix protein (33), has been identified as a lead gene for the HCC signature and it has been shown to be overexpressed in metastatic HCC. Moreover, SPP1-specific antibodies can block HCC cell invasion effectively in vitro and also inhibit pulmonary metastasis of HCC cells in nude mice (52). This data comparison supports the view that SPP1 not only acts as a potential therapeutic target for metastatic HCC, but also has the potential to be an early diagnostic marker for liver injury. Thus, it may be feasible in the future to diagnose patients with inflammation and fibrosis using only a serum sample (Fig. 4E).
The gene expression profiling carried out here provides a powerful and robust tool that is able to reveal molecular markers for liver damage at an early stage. In total, 256 genes were identified that were able to discriminate a liver damage situation from the normal situation; of these, 44 and 62 genes formed the best necroinflammatory and fibrosis discriminators, respectively. We have used these discriminators to rapidly screen potential Chinese herbs for the treatment of DMN-induced liver fibrosis. Among many herbs tested, one of them has shown a significant improvement in DMN-triggered liver damage as examined by histopathological and clinical biochemical analysis similar to those described in this study. More importantly, treatment with this newly identified herb could reverse more than 80% of these discriminators to the level of the normal control (data not shown). This result implies that identification of these discriminators not only allows them to serve as molecular classifiers that provide novel biological insights into the development of earlier liver damage but they can also help the development of new therapeutic drugs for liver disease.
ACKNOWLEDGMENTS
This work was supported in part by grants from the Liver Disease Prevention and Treatment Research Foundation, DOH (CCMP 94-RD-047) and National Health Research Institutes to L. J. Su, Taichung Veterans General Hospital and National Chi-Nan University (TCVGH-NCNU-927908 and 937903C) to S. L. Hsu, and National Health Research Institutes (MG-094-SP-01) to C. Y. F. Huang.
REFERENCES
- 1. Ala-Kokko L.; Pihlajaniemi T.; Myers J. C.; Kivirikko K. I.; Savolainen E. R. Gene expression of type I, III and IV collagens in hepatic fibrosis induced by dimethylnitrosamine in the rat. Biochem. J. 244:75–79; 1987. [DOI] [PMC free article] [PubMed] [Google Scholar]
- 2. Al-Shahrour F.; Diaz-Uriarte R.; Dopazo J. FatiGO: A web tool for finding significant associations of gene ontology terms with groups of genes. Bioinformatics 20:578–580; 2004. [DOI] [PubMed] [Google Scholar]
- 3. Arthur M. J.; Mann D. A.; Iredale J. P. Tissue inhibitors of metalloproteinases, hepatic stellate cells and liver fibrosis. J. Gastroenterol. Hepatol. 13(Suppl.):S33–38; 1998. [DOI] [PubMed] [Google Scholar]
- 4. Bataller R.; Brenner D. A. Liver fibrosis. J. Clin. Invest. 115:209–218; 2005. [DOI] [PMC free article] [PubMed] [Google Scholar]
- 5. Bauer M.; Schuppan D. TGFbeta1 in liver fibrosis: Time to change paradigms? FEBS Lett. 502:1–3; 2001. [DOI] [PubMed] [Google Scholar]
- 6. Bechard D.; Meignin V.; Scherpereel A.; Oudin S.; Kervoaze G.; Bertheau P.; Janin A.; Tonnel A.; Lassalle P. Characterization of the secreted form of endothelial-cell-specific molecule 1 by specific monoclonal antibodies. J. Vasc. Res. 37:417–425; 2000. [DOI] [PubMed] [Google Scholar]
- 7. Crabb D. W. Recent developments in alcoholism: The liver. Recent Dev. Alcohol 11:207–230; 1993. [PubMed] [Google Scholar]
- 8. Day C. P. Non-alcoholic steatohepatitis (NASH): Where are we now and where are we going? Gut 50:585–588; 2002. [DOI] [PMC free article] [PubMed] [Google Scholar]
- 9. Dooley S.; Delvoux B.; Streckert M.; Bonzel L.; Stopa M.; ten Dijke P.; Gressner A. M. Transforming growth factor beta signal transduction in hepatic stellate cells via Smad2/3 phosphorylation, a pathway that is abrogated during in vitro progression to myofibroblasts. TGFbeta signal transduction during transdifferentiation of hepatic stellate cells. FEBS Lett. 502:4–10; 2001. [DOI] [PubMed] [Google Scholar]
- 10. Fausto N. Liver regeneration. J. Hepatol. 32:19–31; 2000. [DOI] [PubMed] [Google Scholar]
- 11. Friedman S. L. Seminars in medicine of the Beth Israel Hospital, Boston. The cellular basis of hepatic fibrosis. Mechanisms and treatment strategies. N. Engl. J. Med. 328:1828–1835; 1993. [DOI] [PubMed] [Google Scholar]
- 12. Friedman S. L. Molecular regulation of hepatic fibrosis, an integrated cellular response to tissue injury. J. Biol. Chem. 275:2247–2250; 2000. [DOI] [PubMed] [Google Scholar]
- 13. Friedman S. L. Liver fibrosis—from bench to bedside. J. Hepatol. 38(Suppl. 1):S38–53; 2003. [DOI] [PubMed] [Google Scholar]
- 14. George J.; Rao K. R.; Stern R.; Chandrakasan G. Dimethylnitrosamine-induced liver injury in rats: The early deposition of collagen. Toxicology 156:129–138; 2001. [DOI] [PubMed] [Google Scholar]
- 15. Gressner A. M.; Weiskirchen R.; Breitkopf K.; Dooley S. Roles of TGF-beta in hepatic fibrosis. Front. Biosci. 7:d793–807; 2002. [DOI] [PubMed] [Google Scholar]
- 16. Haggerty H. G.; Holsapple M. P. Role of metabolism in dimethylnitrosamine-induced immunosuppression: A review. Toxicology 63:1–23; 1990. [DOI] [PubMed] [Google Scholar]
- 17. Halliday J. W.; Searle J. Hepatic iron deposition in human disease and animal models. Biometals 9:205–209; 1996. [DOI] [PubMed] [Google Scholar]
- 18. Harada K.; Ozaki S.; Sudo Y.; Tsuneyama K.; Ohta H.; Nakanuma Y. Osteopontin is involved in the formation of epithelioid granuloma and bile duct injury in primary biliary cirrhosis. Pathol. Int. 53:8–17; 2003. [DOI] [PubMed] [Google Scholar]
- 19. Hayasaka A.; Saisho H. Serum markers as tools to monitor liver fibrosis. Digestion 59:381–384; 1998. [DOI] [PubMed] [Google Scholar]
- 20. Iizuka N.; Oka M.; Yamada-Okabe H.; Mori N.; Tamesa T.; Okada T.; Takemoto N.; Hashimoto K.; Tangoku A.; Hamada K.; Nakayama H.; Miyamoto T.; Uchimura S.; Hamamoto Y. Differential gene expression in distinct virologic types of hepatocellular carcinoma: Association with liver cirrhosis. Oncogene 22:3007–3014; 2003. [DOI] [PubMed] [Google Scholar]
- 21. Imbert-Bismut F.; Ratziu V.; Pieroni L.; Charlotte F.; Benhamou Y.; Poynard T. Biochemical markers of liver fibrosis in patients with hepatitis C virus infection: A prospective study. Lancet 357:1069–1075; 2001. [DOI] [PubMed] [Google Scholar]
- 22. Iredale J. P. Tissue inhibitors of metalloproteinases in liver fibrosis. Int. J. Biochem. Cell Biol. 29:43–54; 1997. [DOI] [PubMed] [Google Scholar]
- 23. Iredale J. P. Cirrhosis: New research provides a basis for rational and targeted treatments. Br. Med. J. 327:143–147; 2003. [DOI] [PMC free article] [PubMed] [Google Scholar]
- 24. Ishak K.; Baptista A.; Bianchi L.; Callea F.; De Groote J.; Gudat F.; Denk H.; Desmet V.; Korb G.; MacSween R. N.; Phillips M. J.; Portmann B. G.; Poulsen H.; Scheuer P. J.; Schmid M.; Thaler H. Histological grading and staging of chronic hepatitis. J. Hepatol. 22:696–699; 1995. [DOI] [PubMed] [Google Scholar]
- 25. Jezequel A. M.; Mancini R.; Rinaldesi M. L.; Macarri G.; Venturini C.; Orlandi F. A morphological study of the early stages of hepatic fibrosis induced by low doses of dimethylnitrosamine in the rat. J. Hepatol. 5:174–181; 1987. [DOI] [PubMed] [Google Scholar]
- 26. Kim J. W.; Ye Q.; Forgues M.; Chen Y.; Budhu A.; Sime J.; Hofseth L. J.; Kaul R.; Wang X. W. Cancer-associated molecular signature in the tissue samples of patients with cirrhosis. Hepatology 39:518–527; 2004. [DOI] [PubMed] [Google Scholar]
- 27. Knodell R. G.; Ishak K. G.; Black W. C.; Chen T. S.; Craig R.; Kaplowitz N.; Kiernan T. W.; Wollman J. Formulation and application of a numerical scoring system for assessing histological activity in asymptomatic chronic active hepatitis. Hepatology 1:431–435; 1981. [DOI] [PubMed] [Google Scholar]
- 28. Llovet J. M.; Bustamante J.; Castells A.; Vilana R.; Ayuso Mdel C.; Sala M.; Bru C.; Rodes J.; Bruix J. Natural history of untreated nonsurgical hepatocellular carcinoma: rationale for the design and evaluation of therapeutic trials. Hepatology 29:62–67; 1999. [DOI] [PubMed] [Google Scholar]
- 29. Lopez-De Leon A.; Rojkind M. A simple micro-method for collagen and total protein determination in formalin-fixed paraffin-embedded sections. J. Histochem. Cytochem. 33:737–743; 1985. [DOI] [PubMed] [Google Scholar]
- 30. Marra F.; Arrighi M. C.; Fazi M.; Caligiuri A.; Pinzani M.; Romanelli R. G.; Efsen E.; Laffi G.; Gentilini P. Extracellular signal-regulated kinase activation differentially regulates platelet-derived growth factor’s actions in hepatic stellate cells, and is induced by in vivo liver injury in the rat. Hepatology 30:951–958; 1999. [DOI] [PubMed] [Google Scholar]
- 31. Marvanova M.; Menager J.; Bezard E.; Bontrop R. E.; Pradier L.; Wong G. Microarray analysis of nonhuman primates: Validation of experimental models in neurological disorders. FASEB J. 17:929–931; 2003. [DOI] [PubMed] [Google Scholar]
- 32. Mazzocca A.; Carloni V.; Sciammetta S.; Cordella C.; Pantaleo P.; Caldini A.; Gentilini P.; Pinzani M. Expression of transmembrane 4 superfamily (TM4SF) proteins and their role in hepatic stellate cell motility and wound healing migration. J. Hepatol. 37:322–330; 2002. [DOI] [PubMed] [Google Scholar]
- 33. Medico E.; Gentile A.; Lo Celso C.; Williams T. A.; Gambarotta G.; Trusolino L.; Comoglio P. M. Osteopontin is an autocrine mediator of hepatocyte growth factor-induced invasive growth. Cancer Res. 61:5861–5868; 2001. [PubMed] [Google Scholar]
- 34. Michalopoulos G. K.; DeFrances M. C. Liver regeneration. Science 276:60–66; 1997. [DOI] [PubMed] [Google Scholar]
- 35. Milani S.; Herbst H.; Schuppan D.; Kim K. Y.; Riecken E. O.; Stein H. Procollagen expression by nonparenchymal rat liver cells in experimental biliary fibrosis. Gastroenterology 98:175–184; 1990. [DOI] [PubMed] [Google Scholar]
- 36. Milani S.; Herbst H.; Schuppan D.; Surrenti C.; Riecken E. O.; Stein H. Cellular localization of type I III and IV procollagen gene transcripts in normal and fibrotic human liver. Am. J. Pathol. 137:59–70; 1990. [PMC free article] [PubMed] [Google Scholar]
- 37. Mirsalis J. C.; Butterworth B. E. Detection of unscheduled DNA synthesis in hepatocytes isolated from rats treated with genotoxic agents: An in vivo-in vitro assay for potential carcinogens and mutagens. Carcinogenesis 1:621–625; 1980. [DOI] [PubMed] [Google Scholar]
- 38. Nakanuma Y.; Kono N. Expression of vimentin in proliferating and damaged bile ductules and interlobular bile ducts in nonneoplastic hepatobiliary diseases. Mod. Pathol. 5:550–554; 1992. [PubMed] [Google Scholar]
- 39. Okita K.; Sakaida I.; Hino K. Current strategies for chemoprevention of hepatocellular carcinoma. Oncology 62(Suppl. 1):24–28; 2002. [DOI] [PubMed] [Google Scholar]
- 40. Rogers A. E.; Newberne P. M. Animal model: Fatty liver and cirrhosis in lipotrope-deficient male rats. Am. J. Pathol. 73:817–820; 1973. [PMC free article] [PubMed] [Google Scholar]
- 41. Schuppan D.; Krebs A.; Bauer M.; Hahn E. G. Hepatitis C and liver fibrosis. Cell Death Differ. 10(Suppl. 1):S59–67; 2003. [DOI] [PubMed] [Google Scholar]
- 42. Seow T. K.; Liang R. C.; Leow C. K.; Chung M. C. Hepatocellular carcinoma: from bedside to proteomics. Proteomics 1:1249–1263; 2001. [DOI] [PubMed] [Google Scholar]
- 43. Seth D.; Leo M. A.; McGuinness P. H.; Lieber C. S.; Brennan Y.; Williams R.; Wang X. M.; Mc-Caughan G. W.; Gorrell M. D.; Haber P. S. Gene expression profiling of alcoholic liver disease in the baboon (Papio hamadryas) and human liver. Am. J. Pathol. 163:2303–2317; 2003. [DOI] [PMC free article] [PubMed] [Google Scholar]
- 44. Tan A. C.; Gilbert D. Ensemble machine learning on gene expression data for cancer classification. Appl. Bioinformatics 2:S75–83; 2003. [PubMed] [Google Scholar]
- 45. Utsunomiya T.; Okamoto M.; Hashimoto M.; Yoshinaga K.; Shiraishi T.; Tanaka F.; Mimori K.; Inoue H.; Watanabe G.; Barnard G. F.; Mori M. A gene-expression signature can quantify the degree of hepatic fibrosis in the rat. J. Hepatol. 41:399–406; 2004. [DOI] [PubMed] [Google Scholar]
- 46. Vickers A. E.; Saulnier M.; Cruz E.; Merema M. T.; Rose K.; Bentley P.; Olinga P. Organ slice viability extended for pathway characterization: An in vitro model to investigate fibrosis. Toxicol. Sci. 82:534–544; 2004. [DOI] [PubMed] [Google Scholar]
- 47. Waring J. F.; Ciurlionis R.; Jolly R. A.; Heindel M.; Ulrich R. G. Microarray analysis of hepatotoxins in vitro reveals a correlation between gene expression profiles and mechanisms of toxicity. Toxicol. Lett. 120:359–368; 2001. [DOI] [PubMed] [Google Scholar]
- 48. Waring J. F.; Jolly R. A.; Ciurlionis R.; Lum P. Y.; Praestgaard J. T.; Morfitt D. C.; Buratto B.; Roberts C.; Schadt E.; Ulrich R. G. Clustering of hepatotoxins based on mechanism of toxicity using gene expression profiles. Toxicol. Appl. Pharmacol. 175:28–42; 2001. [DOI] [PubMed] [Google Scholar]
- 49. Wellner M.; Herse F.; Janke J.; Gorzelniak K.; Engeli S.; Bechart D.; Lasalle P.; Luft F. C.; Sharma A. M. Endothelial cell specific molecule-1—a newly identified protein in adipocytes. Horm. Metab. Res. 35:217–221; 2003. [DOI] [PubMed] [Google Scholar]
- 50. White P.; Brestelli J. E.; Kaestner K. H.; Greenbaum L. E. Identification of transcriptional networks during liver regeneration. J. Biol. Chem. 280:3715–3722; 2005. [DOI] [PubMed] [Google Scholar]
- 51. Wu J. C.; Chen T. Y.; Yu C. T.; Tsai S. J.; Hsu J. M.; Tang M. J.; Chou C. K.; Lin W. J.; Yuan C. J.; Huang C. Y. Identification of V23RalA-Ser194 as a critical mediator for Aurora-A-induced cellular motility and transformation by small pool expression screening. J. Biol. Chem. 280:9013–9022; 2005. [DOI] [PubMed] [Google Scholar]
- 52. Ye Q. H.; Qin L. X.; Forgues M.; He P.; Kim J. W.; Peng A. C.; Simon R.; Li Y.; Robles. A. I.; Chen Y.; Ma Z. C.; Wu Z. Q.; Ye S. L.; Liu Y. K.; Tang Z. Y.; Wang X. W. Predicting hepatitis B virus-positive metastatic hepatocellular carcinomas using gene expression profiling and supervised machine learning. Nat. Med. 9:416–423; 2003. [DOI] [PubMed] [Google Scholar]