

Summary
Liver fibrosis occurs during chronic injury and represents, in large part, an exaggerated matrigenic output by hepatic stellate cells (HSC) which become activated as a result of injury-induced signaling pathways in parenchymal and inflammatory cells (hepatocytes, macrophages etc). The molecular components in these pathways (e.g. CCN proteins) are modulated by transcription factors as well as by factors such as microRNAs (miRs) that act post-transcriptionally. MiRs are small (~23 nt) non-coding RNAs that regulate gene expression by specifically interacting with the 3′ untranslated region (UTR) of target gene mRNA to repress translation or enhance mRNA cleavage. As well as acting in their cells of production, miRs (and other cellular constituents such as mRNAs and proteins) can be liberated from their cells of origin in nanovesicular membrane exosomes, which traverse the intercellular spaces, and can be delivered to neighboring cells into which they release their molecular payload, causing alterations in gene expression in the target cells. Here we summarize some of the experimental approaches for studying miR action and exosomal trafficking between hepatic cells. Insights into the mechanisms involved will yield new information about how hepatic fibrosis is regulated and, further, may identify new points of therapeutic intervention.
Keywords: Immunohistochemistry, In situ hybridization, RT-PCR, immunoprecipitation, co-culture, exosome
1. Introduction
Fibrosis arises due to the overt deposition of insoluble collagenous material during chronic organ injury. In the liver, fibrogenic cascades are triggered principally within hepatic stellate cells (HSC), which are ordinarily quiescent and store vitamin A in fat droplets but which undergo a process of activation during injury. HSC activation is characterized by a phenotypic transition of the cells into myofibroblasts which unrelentingly deposit collagen into the interstitial spaces during chronic injury (1–3). Pathways of fibrosis in the liver are initiated downstream of inflammation and wound repair and are regulated by a broad variety of cytokines, growth factors and matricellular proteins that include transforming growth factor-beta (TGF-β) as well as CCN1 and CCN2 (4–8). CCN2 is directly pro-fibrotic and often acts downstream of TGF-β to drive fibrosis. Whereas quiescent HSC do not produce CCN2 or its receptors, CCN2 promoter activity is highly stimulated in HSC undergoing activation in vivo or in vitro, resulting in high levels of CCN2 mRNA expression and protein production (6).
Recent evidence has shown that microRNAs (miRs) exert important regulatory actions in liver fibrosis. MiRs are small (~23 nt) non-coding RNAs that regulate gene expression by specifically interacting with the 3′ untranslated region (UTR) of target gene mRNA to repress translation or enhance mRNA cleavage (9). We have recently identified a binding site for miR-214 in the CCN2 3′-UTR (10). High levels of miR-214 in non-injured liver or quiescent HSC engage the CCN2 3′-UTR and inhibit CCN2, thus contributing to suppressed expression of CCN2 under resting (non-pathological) conditions. In contrast the levels of miR-214 are highly diminished in fibrotic liver or activated HSC, allowing CCN2 expression to be manifested (11).
A very new area of research relates to the manner in which fibrosis is regulated by exosomes. Exosomes are 50–150nm membranous vesicles that arise by inward budding from the limiting membranes of multivesicular bodies (MBV). Upon fusion of MVBs with the plasma membrane, exosomes are liberated from the cells, traverse intercellular spaces, and may be taken up by neighboring cells (12–14). Exosomes contain a complex mixture of miRs, mRNAs and proteins and therefore their uptake by target cells represents a novel communication pathway through which molecular information is exchanged between donor and recipient cells. MiR-214 is exosomally shuttled between neighboring HSC and can exert epigenetic effects on the CCN2-UTR in recipient cells (11, 15).
2. Materials
Whenever possible, reagents and drugs administered to animals are to be pharmaceutical grade. Controlled substances should be locked securely with access restricted only to authorized individuals. Meticulous record-keeping for all drugs is essential. Animal protocols require institutional approval.
2.1 HSC Isolation Components
Perfusion solution: 1X PBS, pronase, collagenase IV. Add pronase (1.33 mg/ml) and collagenase IV (0.5mg/ml) into PBS (1X) before use.
Digest solution: Dulbecco’s Modified Eagle Medium/Nutrient Mixture F-12 (DMEM/F-12), pronase, DNase I. Dissolve pronase (1 mg/ml) and DNase I (1 mg/ml) into DMEM/F-12 medium before use.
Gradient solution: OptiPrep (Life Technology, Carlsbad, CA, USA). Dilute OptiPrep to 15% or 11% in Hank’s Buffered Salt Solution (HBSS) before use.
Culture medium: DMEM, fetal bovine serum (FBS), L-glutamine, penicillin, streptomycin. Add 10% FBS, 4.5 g/l L-glutamine, 100 U/ml penicillin and 100mg/ml streptomycin into DMEM medium. Store at 4°C.
2.2 In-situ hybridization (ISH) Components
Locked nucleic acid (LNA™) microRNA probes pre-labeled with double-DIG or pre-labeled with double-FITC (Exiqon Inc., Woburn, MA, USA). Store at −20°C.
Hybridization kit (e.g., miRCURY LNA™ microRNA ISH optimization kit, Exiqon Inc.). Store at 4°C.
MicroRNA ISH Buffer (eg., microRNA ISH Buffer, Exiqon Inc.). Store at 4°C.
Saline-sodium citrate (SSC) buffer (20X): 175.3g NaCl, 88.2g trisodium citrate. Make to 1000ml with distilled water (pH 7.0).
KTBT buffer: 7.9g Tris-HCl (50mM) pH 6.8, 8.7g NaCl (150mM) and 0.75g KCl (10mM). Make to 1000ml with distilled water.
ISH block solution (e.g., ISH block solution, Roche, Indianapolis, IN, USA).
Nitro-blue tetrazolium (NBT) and 5-bromo-4-chloro-3′-indolyphosphate (BCIP). Store at 4°C.
Eukitt® mounting Medium (VWR., Radnor, PA, USA), Prolong Gold Mounting Medium with 4′,6-diamidino-2-phenylindole (DAPI) (Life Technologies., Carlsbad, CA). Store at 4°C.
2.3 Immunofluorescence Components
Blocking reagent: Skim milk, 1X PBS. Dissolve 3g skim milk in 100ml PBS (1X).
PBS-T: PBS, 0.1% Tween 20.
Mounting Medium e.g. Vectashield (Vector Laboratories, Burlingame, CA, USA) or equivalent, containing 4′,6-diamidino-2-phenylindole (DAPI) nuclear stain. Store at 4°C.
2.4 Quantitative RT-PCR Components
MicroRNeasy mini kit (Qiagen, Valencia, CA, USA), miScript II RT kit (Qiagen). Store at 4°C.
Primers (Table 1)
Table 1.
Primers used for RT-PCR
| Gene | GenBank accession number | Primers | Product size (bp) | |
|---|---|---|---|---|
| Sense | Anti-sense | |||
| CTGF | NM_010217 | 5′ CACTCTGCCAGTGGAGTTCA 3′ | 5′ AAGATGTCATTGTCCCCAGG 3′ | 111 |
| miR-214 | NR_029796 | 5′ ACAGCAGGCACAGACAGGCA 3′ | Universal anti-sense | 20 |
| Collagen α1(I) | NM_007742 | 5′ GCCCGAACCCCAAGGAAAAGAAGC 3′ | 5′ CTGGGAGGCCTCGGTGGACATTAG 3′ | 148 |
| α-SMA | NM_007392 | 5′GGCTCTGGGCTCTGTAAGG3′ | 5′CTCTTGCTCTGGGCTTCATC3′ | 148 |
| GAPDH | NM_002046 | 5′ TGCACCACCAACTGCTTAGC 3′ | 5′ GGCATGGACTGTGGTCATGAG 3′ | 66 |
2.5 CCN2 3′-UTR construction and miR-214 targeting assay Components
Fire-Ctx sensor lentivector (SBI, Mountain View, CA, USA). Store at −20°C.
Electroporation kit (Nulceofector, Lonza., Houston, TX, USA), Store at 4°C.
Pre-mir-214 (Life Technologies.). Store at −20°C.
pRL-CMV vector, E1910 Dual Luciferase Reporter Assay System (Promega., Madison WI, USA). Store at −20°C.
Cytotoxic reagent (CTX) (Clontech, Mountain View CA, USA). Store at −20°C.
CytoSelect™ assay kit (Cell Biolabs Inc., San Diego, CA, USA). Store at 4°C.
2.6 Exosome assay Components
PureExo Exosome Isolation Kits (101Bio, Palo Alto, CA, USA).
Dymanic light scattering instrument, e.g. BI 200SM (Research Goniometer System, Brookhaven Instruments Inc., Holtville NY, USA) or equivalent.
Zeta Potential Analayzer, e.g. ZetaPALS (Brookhaven Instruments Inc., Holtsville, NY, USA) or equivalent.
Carbon-coated 400-mesh copper grids (Electron Microscopy Sciences, Hatfield, PA, USA).
Electron microscope for transmission electron microscopy (TEM) e.g. H-7650 (Hitachi High Technologies America, Pleasanton, CA, USA) or equivalent)
Electron microscope for cryogenic TEM e.g. Tecnai G2 F20 microscope (FEI, Hillsboro, Oregon, USA) or equivalent.
Radioimmunoprecipitation (RIPA) buffer: 50 mM Tris-HCl, 150 mM NaCl, 1% NP-40, 0.5% sodium deoxycholate, 0.1% SDS, (pH 7.4). Make to 100ml with distilled water. Store at 4°C.
Loading buffer (2X) for sodium dodecyl sulfate gel electrophoresis (SDS-PAGE): 8M urea, 70 mM Tris-HCl pH 6.8, 3% SDS, 0.005% bromophenolblue, 5% β-mercaptoethanol. Make in distilled water. Store at −20°C.
Western blot transfer buffer: 25mM Tris-HCl pH 8.3, 150mM glycine, 20% (v/v) methanol. Make in distilled water.
Enhanced chemiluminescence kit. Store at 4°C.
PKH26 fluorescent dye. Store at 4°C.
Culture-Insert μ-Dish 35mm system (Ibidi Inc., Verona, WI, USA).
2.7 Antibodies
We commonly use monoclonal anti-digoxigenin-alkaline phosphatase antibody (Roche, Indianapolis, IN), monoclonal anti-mouse αSMA antibody (Dako Cytomatio., Denmark), polyclonal anti-rabblit collagen α(I) (Abcam., Cambridge, MA), CD9 antibody (SBI System Biosciences., Mountain View, CA, USA), Alexa Fluor®488 goat-anti chicken IgY, Alexa Fluor® 568 goat-anti rabbit IgG, Alexa Fluor® 647 goat anti-mouse IgG (Life Technologies.).
3. Methods
3.1 Isolation of mouse HSC
HSC can be successfully isolated from the liver of a wide variety of strains of mice. Typically, HSC are collected and pooled from 5 male mice (4–6 weeks of age, approx. 25–30g) of the same strain and then cultured in vitro.
Anesthetize mice with ketamine (66mg/kg) and xylazine (14mg/kg) and ensure a very deep plane of anesthesia by strong toe pinch. Optionally, blood (0.5–0.7ml) is collected by cardiac puncture using a 25-gauge needle. Cardiac function will be compromised but the heart will still beat slowly. Place animal on its back and spray the abdomen with 70% alcohol. Access the liver through an abdominal incision. Introduce a 22GA needle (1.00IN, 0.9 × 25mm) into the infra hepatic vena cava and snip the portal vein with scissors. Initiate systemic perfusion of 20–30ml PBS (results in immediate death) followed by the perfusion solution.
Remove perfused livers from five mice, mince with scissors, and digest in the digest solution.
Stop the digestion with 3 ml serum and centrifuge at 300g for 10 mins (4°C). Rinse the pellets and centrifuge them again under the same conditions.
Filter the resulting cell suspension through a metal sieve (120μm) and centrifuge at 300g for 10 mins (4°C) and then remove the supernatant.
Prepare the gradient solutions.
Resuspend the cell pellet in 15% OptiPrep gradient solution and place in a centrifuge tube. Over the top of this solution, layer the 11% OptiPrep gradient solution, followed by HBSS on top of that. Centrifuge the resulting cell suspension at 1400g for 30 mins without braking. HSC separate into a hazy band just above the interface of the gradient in the aqueous buffer. Harvest the band.
Wash the band of cells and resuspend them at 105 cells/ml in the culture medium.
Plate the cells into flasks or multi-well plates as needed.
Verify HSC identity and purity by buoyant density, phase contrast microscopy, oil red staining, and immunostaining for glial fibrillary acidic protein (GFAP) or desmin (see Note 1). Immunostaining can also be performed for additional markers such as alpha smooth muscle actin (αSMA), connective tissue growth factor (CCN2) or collagen α1 which are induced in the cells as they become autonomously activated in culture.
3.2 Detection of microRNA in hepatic tissue by in-situ hybridization (ISH)
Tissue preparation. Superior results are obtained by perfusion of the liver to remove blood components. Follow the procedure in Subheading 3.1 step 2 except the surgical approach is to make a V-cut through the skin and abdominal wall about 1cm caudal to the last rib. Make a small incision in the diaphragm to equalize the heart chamber and external pressures, lift the sternum upwards, cut the rib cage laterally about 1cm in each direction to access the heart chamber, insert a 23–25 gauge butterfly needle into the left ventricle, and clip the aorta with scissors.
Perfuse animals with 20–30ml 4% paraformaldehyde for fixation. Resect the liver and place in 4% paraformaldehyde overnight at 4°C. Wash fixed livers three times with 70% ethanol before embedding in paraffin blocks. Cut sections of 6 μm and mount on slides (see Note 2). As an alternative approach, one lobe of the liver is tied off with suture material after PBS perfusion (for later RNA extraction) prior to perfusion of the remainder of the liver with 4% paraformaldehyde. The various lobes are then processed for histology as above or frozen for RNA extraction (see Subheading 3.5).
Hybridization is performed as described in the instructions for the miRCURY LNA™ microRNA ISH optimization kit.
De-paraffinize the liver sections with xylene and ethanol solutions at room temperature by placing with sections in a slide rack, and then move among jars according to Table 2, ending up in PBS.
Incubate with proteinase-K for 10mins at 37°C (see Note 3) and wash twice with PBS. Dehydrate the sections in graded alcohol (Table 3) and air-dry the slides on clean paper towels for 15 mins.
Place the slides on a flat surface and hybridize the sections with a probe in microRNA ISH Buffer for the microRNA of interest (e.g. miR-214 for CCN2) or scramble sequence probes (see Note 4).
Apply sterile and RNase-free glass cover slips onto the sections and seal along all four edges with Fixogum for 60 mins at 55°C (see Note 5).
Remove Fixogum using tweezers and carefully detach cover slips. Place the slides in 5X SSC solution. Wash the slides with varying concentrations of SSC buffer at 55°C as shown in Table 4 (see Note 5).
Incubate the slides with anti-digoxigenin-alkaline phosphatase antibody (1:800) for 60 mins after blocking the sections with block solution.
Wash the slides with PBS-T and apply NBT/BCIP substrates at 30°C for 2 hrs. Stop the reaction with KTBT buffer and wash with water twice.
Counterstain the slides with Nuclear Fast Red™, dehydrate the slides in graded ethanol solutions according to Table 3, mount with Eukitt® Medium, and examine by confocal microscopy.
Table 2.
De-paraffinization steps for ISH
| Step | Solvent | Duration |
|---|---|---|
| 1 | Xylene | Immerse 5 mins |
| 2 | Xylene | Immerse 5 mins |
| 3 | Xylene | Immerse 5 mins |
| 4 | 99.9% Ethanol | Dip 10 times |
| 5 | 99.9% Ethanol | Dip 10 times |
| 6 | 99.9% Ethanol | Immerse 5 mins |
| 7 | 96% Ethanol | Dip 10 times |
| 8 | 96% Ethanol | Immerse 5 mins |
| 9 | 70% Ethanol | Dip 10 times |
| 10 | 70% Ethanol | Immerse 5 mins |
| 11 | PBS | Immerse 2–5 mins |
Table 3.
Dehydraton steps for ISH
| Step | Solvent | Duration |
|---|---|---|
| 1 | 70% Ethanol | Dip 10 times |
| 2 | 70% Ethanol | Immerse for 1 min |
| 3 | 96% Ethanol | Dip10 times |
| 4 | 96% Ethanol | Immerse for 1 min |
| 5 | 99.9% Ethanol | Dip10 times |
| 6 | 99.9% Ethanol | Immerse for 1 min |
Table 4.
Post-hybridization SSC wash steps for ISH
| Step | Buffer | Duration | Temperature |
|---|---|---|---|
| 1 | 5×SSC | 5 mins | Hyb temp |
| 2 | 1×SSC | 5 mins | Hyb temp |
| 3 | 1×SSC | 5 mins | Hyb temp |
| 4 | 0.2×SSC | 5 mins | Hyb temp |
| 5 | 0.2×SSC | 5 mins | Hyb temp |
| 6 | 0.2×SSC | 5 mins | Room temp |
3.3 Detection of microRNA in mouse primary HSC by ISH
Fix HSC with 2.5% glutaraldehyde for 30 mins, wash with 4.5% sucrose in PBS, and then permeabilize the cells with 0.3% Triton X-100 in PBS for 15 mins, followed by PBS-T for 5 mins. All steps are at room temperarture.
Incubate HSC with proteinase-K for 10 mins at 37°C (see Note 6) and fix the cells with 4% paraformaldehyde for 5 mins at room temperature. Wash HSC with PBS-T and treat the cells with 50% formamide/2×SSC before hybridization.
Hybridize HSCs with probe(s) to the microRNA of interest (e.g. miR-214 for CCN2) or with a scrambled sequence (see Note 7) for 30 mins at 58°C in microRNA ISH Buffer followed by washes with graded concentrations of SSC buffer (Table 4) at 58°C. Mount cells in Prolong Gold Mounting Medium with DAPI and examine by confocal microscopy.
3.4 Immunofluorescent staining of CCN2, αSMA or collagen α(I) in liver sections or mouse HSC
Deparaffinize liver sections with xylene and ethanol as described above (Table 2). Fix cultured HSC with 4% paraformaldehyde for 1 hr at room temperature and then rinse the cells three times with PBS.
Incubate liver sections or mouse HSC with blocking reagent for 1hr at room temperature.
Rinse and apply primary antibodies against CCN2 (5 μg/ml), αSMA (1:100), or collagen α(I) (1:250) overnight at 4°C with mixing.
Rinse the sections four times with PBS-T, 15 mins each time.
Add, respectively, Alexa Fluor®488 goat-anti chicken IgY, Alexa Fluor® 568 goat-anti rabbit IgG, or Alexa Fluor® 647 goat anti-mouse IgG (all at 1:1000) for 1 hr at room temperature.
Rinse the sections three times in PBS-T for 15 min and one time in PBS for 15 min at room temperature with agitation.
Mount the slides with Vectashield Mounting Medium and examine by fluorescence or confocal microscopy.
3.5 Extraction and quantitative RT-PCR (qRT-PCR) of cellular RNAs
Extract total RNA (including microRNAs) from frozen tissues or cultured HSC using a microRNeasy mini kit according to the manufacturers’ protocols.
Reverse transcribe RNAs into cDNAs using a miScript II RT kit according to the manufacturers’ protocols.
Use qRT-PCR to analyze expression of relevant transcripts, such as those for miR-214, CCN2, αSMA or collagen αI(1) (Table 1). Run each reaction in triplicate, and normalize to GAPDH. Negative controls are reactions lacking reverse transcriptase or sample (template).
3.6 miR-Selection Fire-Ctx lentivector-CCN2 3′-UTR construction
Identify potential binding sites for microRNAs that directly regulate CCN2 (eg miR-214) by performing a BLAST search of the CCN2 3′-UTR (mouse, human).
For mouse, amplify the full-length 997bp 3′-UTR of CCN2 (Genbank SEQ ID: BC006783.1) by PCR from primary mouse HSC genomic DNA using forward primer 5′-GAGGGATCCGTCACACTCTCAACAAATAAACTGCCC-3′ and reverse primer 5′-GAGGAATTCAGCCAGGAAGTAAGGGAACCGAACTCA -3′ (Fig 1A).
Digest the PCR fragment with BamH I and EcoR I and then subclone it into Fire-Ctx sensor lentivector, downstream of the Firefly luciferase reporter and cytotoxin (CTX) drug sensor genes. Verify the construction by DNA sequencing (Fig. 1B).
Incorporate a 5-base mutation into the CCN2 3′-UTR at the predicted binding site for the miR of interest (e.g. GTCCG → ACAAT for miR-214; Fig. 1A). Amplify the mutated form of CCN2 3′-UTR from the wild-type UTR using relevant primers (eg forward primer 5′-CTGGCTCAGGGTAAGACAATATTCCTACCAGGAAG-3′ and reverse primer 5′-CTTCCTGGTAGGAATATTGTCTTACCCTGAGCCAG-3′ for the miR-214 binding mutant), and verify by DNA sequencing.
Fig 1.

Characterization of miR-214 - CCN2 3′-UTR interactions (A) Alignment of miR-214 with its binding site in the mouse CCN2 3′-UTR (Genbank SEQ ID: BC006783.1). The red box shows the mutated version of the UTR. (B) Organization of the miR-Selection Fire-Ctx lentivector containing CCN2 3′-UTR.
3.7 Demonstration that miR-214 directly targets the CCN2 3′-UTR
Co-transfect mouse HSC by electroporation (see Note 8) with 100nM of the hairpin precursor of miR-214 (pre-mir-214) and 3 μg Fire-Ctx sensor lentivectors containing wild-type or mutant CCN2 3′-UTR, or vector alone. To control for transfection efficiency, cells are also transfected with 0.8 μg pRL-CMV vector containing Renilla luciferase reporter gene.
Measure luciferase activity in triplicate using an E1910 Dual Luciferase Reporter Assay System after 24 hrs. Use Renilla luciferase activity for normalization, Compare firefly luciferase activity in pre-mir-214 transfected cells to that in mock-transfected cells.
Alternatively, 24 hours after transfection, treat the cells with CTX reagent (1:1000) for 3–4 days. Assess the cell viability using a CytoSelect™ assay.
3.8 Exosome isolation and characterization
Harvest exosomes from HSC cultures by subjecting HSC conditioned medium to a low speed centrifugation step (e.g. 1800 g for 10 mins at 4°C) from which the supernatant is then subjected to ultracentrifugation at 100,000g for 90 mins at 4°C. The supernatant is removed and pellet is resuspended in 1ml of cold (4°C) PBS and then subsequently ultracentifuged at 100,000g for 90 mins at 4°C. Resuspend the pellet in 250–500 μl PBS.
Harvest circulating exosomes from serum using PureExo Exosome Isolation Kit.
Perform dynamic light scattering (632.8nm laser, 90° detection angle) using a BI 200SM Research Goniometer System to establish the size-range of the exosomes.
Use a ZetaPALS analyzer to establish zeta potential (net charge) of the exosomes.
Perform transmission electron microscopy (TEM) to establish exosome size and morphological characteristics. Coat exosomes on to carbon-coated 400-mesh copper grids, stain with 2% uranyl acetate, air-dry, and image by TEM with an H-7650 microscope. Alternatively, to preserve membrane integrity and morphology, coat exosomes on to carbon-coated grids, blot the surface to dry it, and then plunge-freeze in liquid nitrogen-cooled ethane slush. Cyogenic TEM is performed using a Tecnai G2 F20 microscope (Fig. 2) (see Note 9).
Perform SDS-PAGE and Western blot analysis to verify the presence of well-characterized exosome markers (e.g. CD9, CD81). Resuspend the exosome-rich pellet in loading buffer, separate on a polyacrylamide gel, and transfer to a nitrocellulose membrane using transfer buffer. Block the membrane with blocking reagent and incubate first with a CD9 antibody overnight at 4 degree, followed by goat anti-rabbit HRP secondary antibody (1:2000) for 1 hrs at room temperature. Detect the immunoreactive CD9 protein band by enhanced chemiluminescence.
Fig 2.

Transmission electron microscopy of HSC-derived exosomes. Exosomes were isolated by sequential centrifugation of conditioned medium from P6 mouse HSC. TEM (left) and cryogenic TEM (right).
3.9 Determination of exosomal microRNA or protein content
Transfect P6 primary mouse HSC with pre-mir-214 (100nM) by electroporation, and incubate the cells in fresh serum-free DMEM/F12 medium in T-75 culture flasks for 36hr. Controls include non-treated or mock-transfected cells.
Harvest and purify exosomes released into the conditioned medium. Isolate total RNA from 200 μg exosomes using miRNeasy mini kits as described above. Run triplicate RT-PCR reactions for the miRs of interest. Normalize the data to an unchanged constituent, e.g. let-7a (see Note 10)
Evaluate exosomal proteins by Western blot as described in 3.8.6.
3.10 Assessment of exosomal uptake and action in target cells
Exosome components can be fluorescently tagged to allow visualization after addition to target cells (see Note 11). Either (a) Mix exosome-enriched cell medium with fluorescent dye PKH26 (4mM) for 1 hr and then purify the stained exosomes as in 3.8.1; or (b) Transfect mouse HSC with 4 μg CD9-GFP or miR-214 RFP plasmids by electroporation, incubate the transfected cells in fresh serum-free DMEM/F-12 medium in T-75 culture flasks for 48hrs, and then collect exosomes from the medium as in 3.8.1.
Add aliquots of exosomes to mouse HSC cultures for 2–48 hrs and examine for PKH26, GFP, or RFP fluorescence using confocal microscopy (Fig 3.). Alternatively, wash the recipient cells with PBS, lyse the cells in RIPA buffer, and measure fluorescent intensity of cell lysates.
Exosome effects in recipient cells are assessed by determining changes in levels of key target molecules (e.g. CCN2, αSMA, collagen α1(I)) at the RNA or protein level. Alternatively, the effects can be measured in terms of altered activity of relevant gene reporters that were transfected into the recipient prior to exosome treatment.
Fig 3.
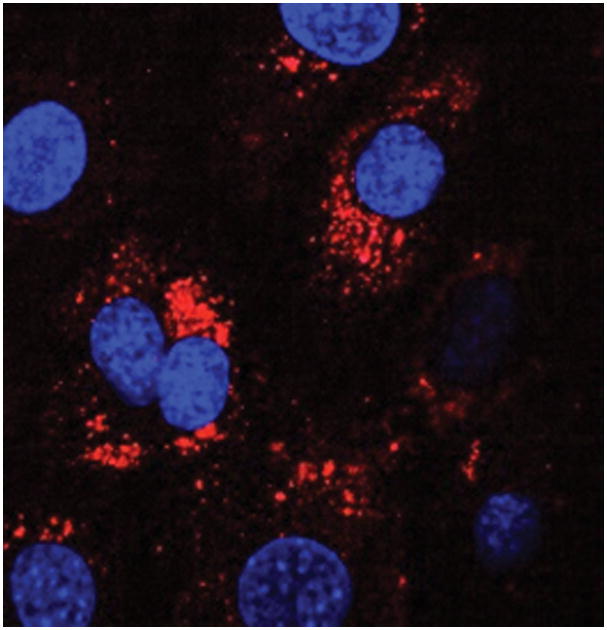
Uptake of HSC-derived exosomes by other HSC. HSC were incubated for 12 h with exosomes purified from HSC conditioned medium that had been stained with PKH26. Receipient HSC were visualized for exosome fluorescence (red) and DAPI immunofluorescence (blue) by confocal microscopy.
3.11 Demonstration of cell-cell exosomal communication using a co-culture system
The Culture-Insert is made from biocompatible silicone material and is divided into two wells by a central silicone wall that can be cut away and removed from the system (Fig 4). (see Note 12).
Fig. 4.

HSC co-culture for assessing exosomal release and uptake of miR-214. The co-culture device comprises two silicone micro-culture wells (0.22 cm2 growth area per well) separated by a shared silicone wall. Approximately 104 donor HSC are placed in one well in 70 μl medium for 12 hrs, with or without GW4869. Meanwhile, ~104 recipient HSC transfected with wild type or mutant CCN2 3′-UTR miR-Selection Fire-Ctx lentivector or the parental vector control are placed in the other well in 70 μl medium for 12 hrs. The central divider is then removed and the cells are co-cultured for a further 24 hrs prior to analysis by luciferase or cytotoxic assays. Luc, luciferase, WT, wild-type; MUT, mutant.
Seed cells in co-culture system: Exosome donor cells: Freshly isolated donors mouse HSC (< 48hr of culture) contain high endogenous levels of miR-214 (see Note 13). Prepare cell suspension and add 70 μl of HSC (approx. 104 cells) into one well. Some wells also receive GW4849 to inhibit exosome production (see Note 14). HSC donor cells can also be fluorescently stained using the methods described in 3.10. Incubate the cells at 37°C and 5% CO2 as usual for 12 hrs. Exosome recipient cells: Recipient HSC contain the parental miR-Selection Fire-Ctx lentivector or the same vector containing either wild type or mutant CCN2 3′-UTR. Prepare cell suspension and add 70 μl of HSC (approx. 104 cells) into the other well. Incubate at 37°C and 5% CO2 for 12 hrs.
Carefully excise the silicone wall between to the two cell cultures and allow direct communication between the cells for the next 24hrs (see Note 15).
If donor cells were stained (e.g. using PKH26, GFP, RFP, SYTO RNA Select Green etc), assess transfer of the stain to recipient cells by direct fluorescence microscopy (see Note 16).
Measure the luciferase activity in triplicate in recipient cells using the Dual Luciferase Reporter Assay System. Firefly luciferase activity in miR-214-transfected cells is compared to that in non-transfected cells, with Renilla luciferase activity used for normalization. Luciferase activity is decreased upon exposure of the recipient cells to the donor cells. Proof that donor exosomes are mediating this effect will be seen by failure of CCN2-UTR activity to be regulated in the presence of GW4869-treated donor cells. Proof that exosomally-delivered miR-214 directly targets CCN2-UTR is shown by failure of luciferase activity to be regulated in recipient cells transfected with the mutant CCN2-UTR.
Supplementary Material
Acknowledgments
Work in the authors’ laboratory is supported by R01AA021276 and 1R211AA023626–01A1 awarded to D.R.B.
Footnotes
Freshly isolated HSCs contain cytoplasmic lipid droplets which are visualized by uptake of oil red O stain. Fix the cells in ice-cold 4% paraformaldehyde in PBS for 20 mins at room temperature prior to incubation for 10 mins in a saturated solution of oil red O (Polysciences, Warrington, PA) in isopropanol (Sigma-Aldrich).
Prepare all solutions using RNase-free water.
The Proteinase-K concentration range must be optimized for individual tissues. It is recommended to test with 2.5 μg/ml in mouse.
For identifying the optimal probes concentration, it is recommended to test the double-DIG labeled LNA™ microRNA probe and the LNA™ scrambled microRNA probe at 1–200nM. Denature the LNA™ probes at 90 for 4mins before using.
For identifying the optimal hybridization temperature, it is recommended to test at 55°C. At low temperature the LNA™ probes give higher signal, but the risk of cross-hybridization to highly similar sequences is increased. However, the LNA™ probes give weaker signal at high temperature.
The Proteinase-K concentration range must be optimized for individual cells. It is recommended to test with 1 μg/ml.
For identifying the optimal probes concentration, it is recommended to test the double-DIG labeled LNA™ microRNA probe and the LNA™ scrambled microRNA probe at 1–200nM. Denature the LNA™ probes at 90 for 4 mins before using.
To gain the highest transfection efficiency or gene expression activity, it is recommended to use electroporation system for transfection.
Cryogenic TEM preserves the structure of exosomes and allows visualization of exosomes as translucent particles with an outer bi-layer membrane (16).
To identify optimal reference gene(s), it is recommended to test stable microRNAs or small RNAs (e.g. 5S rRNA, U6 snRNA) as controls (17–19).
Alternatively, stain the cells with SYTO RNASelect green (Thermofisher). This selectively stains RNA, resulting in a fluorescent signal in exosomes that can be subsequently detected in the target cells, indicative of exosonally-delivered RNA.
Use specified immersion oils (Immersol 518F and Immersol W2010 from Zeiss, or Immersion liquid from Leica) when applying to oil immersion objectives. The use of a non-recommended oil could lead to the damage of the plastic material and the objective.
If endogenous levels of the miR of interest is low in the donor cells, then they can be transfected with the appropriate miR mimic, with or without a fluorescent tag
GW4869 blocks neutral sphingomyelinase2 (nSMase2) which is required for the biosynthesis of ceramide on which exosome production is dependent. Alternatively, use siRNA to block nSMase 2 or components of exosome biogenic pathways (e.g. Rab proteins).
Control experiments include exposure of recipient HSC to cell-free donor micro-wells containing pre-mir-214 in the medium at the same concentration as used for donor HSC transfection.
For ease of identification, the recipient cells can be pre-stained with a differently fluorescing vital dye such as PKH67
References
- 1.Eng FJ, Friedman SL. Fibrogenesis I. New insights into hepatic stellate cell activation: the simple becomes complex. Am J Physiol Gastrointest Liver Physiol. 2000;279:G7–G11. doi: 10.1152/ajpgi.2000.279.1.G7. [DOI] [PubMed] [Google Scholar]
- 2.Friedman SL. Molecular regulation of hepatic fibrosis, an integrated cellular response to tissue injury. J Biol Chem. 2000;275:2247–50. doi: 10.1074/jbc.275.4.2247. [DOI] [PubMed] [Google Scholar]
- 3.Gaca MD, Zhou X, Benyon RC. Regulation of hepatic stellate cell proliferation and collagen synthesis by proteinase-activated receptors. J Hepatol. 2002;36:362–9. doi: 10.1016/s0168-8278(01)00285-9. [DOI] [PubMed] [Google Scholar]
- 4.Friedman SL. Hepatic fibrosis -- overview. Toxicology. 2008;254:120–9. doi: 10.1016/j.tox.2008.06.013. [DOI] [PubMed] [Google Scholar]
- 5.Friedman SL. Mechanisms of hepatic fibrogenesis. Gastroenterology. 2008;134:1655–69. doi: 10.1053/j.gastro.2008.03.003. [DOI] [PMC free article] [PubMed] [Google Scholar]
- 6.Huang G, Brigstock DR. Regulation of hepatic stellate cells by connective tissue growth factor. Front Biosci. 2012;17:2495–507. doi: 10.2741/4067. [DOI] [PubMed] [Google Scholar]
- 7.Wynn TA. Cellular and molecular mechanisms of fibrosis. J Pathol. 2008;214:199–210. doi: 10.1002/path.2277. [DOI] [PMC free article] [PubMed] [Google Scholar]
- 8.Kim KH, Chen CC, Monzon RI, Lau LF. Matricellular protein CCN1 promotes regression of liver fibrosis through induction of cellular senescence in hepatic myofibroblasts. Mol Cell Biol. 2013;33:2078–90. doi: 10.1128/MCB.00049-13. [DOI] [PMC free article] [PubMed] [Google Scholar]
- 9.Bartel DP. MicroRNAs: genomics, biogenesis, mechanism, and function. Cell. 2004;116:281–97. doi: 10.1016/s0092-8674(04)00045-5. [DOI] [PubMed] [Google Scholar]
- 10.Chen L, Charrier A, Zhou Y, Chen R, Yu B, Agarwal K, Tsukamoto H, Lee LJ, Paulaitis ME, Brigstock DR. Epigenetic regulation of connective tissue growth factor by MicroRNA-214 delivery in exosomes from mouse or human hepatic stellate cells. Hepatology. 2014;59:1118–29. doi: 10.1002/hep.26768. [DOI] [PMC free article] [PubMed] [Google Scholar]
- 11.Chen L, Charrier A, Brigstock DR. MicroRNA-214-mediated suppression of connective tissue growth factor (CTGF) in hepatic stellate cells is associated with stimulation of miR-214 promoter activity by cellular or exosomal Twist-1. Hepatology. 2013;584(Suppl):28. [Google Scholar]
- 12.Johnstone RM. Exosomes biological significance: A concise review. Blood Cells Mol Dis. 2006;36:315–21. doi: 10.1016/j.bcmd.2005.12.001. [DOI] [PubMed] [Google Scholar]
- 13.Thery C. Exosomes: secreted vesicles and intercellular communications. F1000 Biol Rep. 2011;3:15. doi: 10.3410/B3-15. [DOI] [PMC free article] [PubMed] [Google Scholar]
- 14.Thery C, Zitvogel L, Amigorena S. Exosomes: composition, biogenesis and function. Nat Rev Immunol. 2002;2:569–79. doi: 10.1038/nri855. [DOI] [PubMed] [Google Scholar]
- 15.Chen L, Chen R, Kemper S, Charrier A, Brigstock DR. Suppression of fibrogenic signaling in hepatic stellate cells by Twist1-dependent microRNA-214 expression: Role of exosomes in horizontal transfer of Twist1. Am J Physiol Gastrointest Liver Physiol. 2015;309:G491–9. doi: 10.1152/ajpgi.00140.2015. [DOI] [PMC free article] [PubMed] [Google Scholar]
- 16.Fang PA, Margolis HC, Conway JF, Simmer JP, Dickinson GH, Beniash E. Cryogenic transmission electron microscopy study of amelogenin self-assembly at different pH. Cells Tissues Organs. 2011;194:166–70. doi: 10.1159/000324250. [DOI] [PMC free article] [PubMed] [Google Scholar]
- 17.Peltier HJ, Latham GJ. Normalization of microRNA expression levels in quantitative RT-PCR assays: identification of suitable reference RNA targets in normal and cancerous human solid tissues. RNA. 2008;14:844–52. doi: 10.1261/rna.939908. [DOI] [PMC free article] [PubMed] [Google Scholar]
- 18.Lardizabal MN, Nocito AL, Daniele SM, Ornella LA, Palatnik JF, Veggi LM. Reference genes for real-time PCR quantification of microRNAs and messenger RNAs in rat models of hepatotoxicity. PLoS One. 2012;7:e36323. doi: 10.1371/journal.pone.0036323. [DOI] [PMC free article] [PubMed] [Google Scholar]
- 19.Zhu HT, Dong QZ, Wang G, Zhou HJ, Ren N, Jia HL, Ye QH, Qin LX. Identification of suitable reference genes for qRT-PCR analysis of circulating microRNAs in hepatitis B virus-infected patients. Mol Biotechnol. 2012;50:49–56. doi: 10.1007/s12033-011-9414-6. [DOI] [PubMed] [Google Scholar]
Associated Data
This section collects any data citations, data availability statements, or supplementary materials included in this article.