

Abstract
Both theory and experimental evolution studies predict migration to influence the outcome of antagonistic coevolution between hosts and their parasites, with higher migration rates leading to increased diversity and evolutionary potential. Migration rates are expected to vary in spatially structured natural pathosystems, yet how spatial structure generates variation in coevolutionary trajectories across populations occupying the same landscape has not been tested. Here, we studied the effect of spatial connectivity on host evolutionary potential in a natural pathosystem characterized by a stable Plantago lanceolata host network and a highly dynamic Podosphaera plantaginis parasite metapopulation. We designed a large inoculation experiment to test resistance of five isolated and five well‐connected host populations against sympatric and allopatric pathogen strains, over 4 years. Contrary to our expectations, we did not find consistently higher resistance against sympatric pathogen strains in the well‐connected populations. Instead, host local adaptation varied considerably among populations and through time with greater fluctuations observed in the well‐connected populations. Jointly, our results suggest that in populations where pathogens have successfully established, they have the upper hand in the coevolutionary arms race, but hosts may be better able to respond to pathogen‐imposed selection in the well‐connected than in the isolated populations. Hence, the ongoing and extensive fragmentation of natural habitats may increase vulnerability to diseases.
Keywords: coevolution, epidemiology, host–pathogen interactions, local adaptation, migration, natural populations
Introduction
Given the threats that pathogens impose on the health of humans and on food security, the need to predict where pathogens will occur, and how risks of infection evolve are at core of successful disease management efforts. This is challenging given the dynamic process of reciprocal adaptation of pathogens and counter‐adaptation of their hosts. These antagonistic coevolutionary dynamics may lead to pathogen local adaptation, that is higher infectivity of pathogens on their sympatric (local) than on their allopatric (foreign) hosts (Lively & Jokela, 1996; Thrall et al., 2002; Kawecki & Ebert, 2004; Laine, 2007; Koskella, 2014). Indeed, the general assumption is that pathogens with short generation times, high mutation rates and large population sizes evolve faster than their hosts and may overcome host resistance (Hamilton et al., 1990; Gandon & Michalakis, 2002). However, in some studies, no evidence of local adaptation was found (e.g. between hen fleas and great tits, Dufva, 1996; trematodes and snails, Morand et al., 1996; or hemiparasitic plant and plant host, Mutikainen et al., 2000). In other systems, pathogens were found to be maladapted (e.g. anther‐smut pathogens infecting plants, Kaltz et al., 1999; protozoan blood parasites infecting lizards Oppliger et al., 1999; or bacteria infecting plants, Kniskern et al., 2011). In addition, evidence for variation among pathogen populations in the level of local adaptation to the same host species has been found (e.g. between trematodes and snails, Morand et al., 1996; protozoan parasite and bumblebee host, Imhoof & Schmid‐Hempel, 1998; and holoparasitic plant and plant host, Koskela et al., 2000). Fungal pathogens infecting plants were locally adapted at very small spatial scales: at the scale of individual plants (Capelle & Neema, 2005) and across some metres within populations (Laine, 2006).
All species are spatially structured across landscapes at some scale or another. This spatial structure may generate variation in the outcome of coevolutionary selection among populations (Thompson, 1994, 1999), as the distances separating local populations are expected to have a direct impact on the rates of both host and parasite migration. Migration is assumed to be a key process that introduces new genetic variation into local populations, and hence, as long as rates of migration are low enough to not homogenize local populations, increasing immigration is expected to increase the diversity and evolutionary potential of local populations (Gandon et al., 1996, 1998; Lively, 1999; Gandon, 2002; Lenormand, 2002; Morgan et al., 2005). Indeed, theory predicts that the relative rates of host and parasite migration may determine which one is ahead in the coevolutionary arms race. Parasite migration between subpopulations might increase parasite local adaptation, whereas higher rates of host migration are expected to give hosts the upper hand (Gandon et al., 1996; Lively, 1999; Gandon, 2002; Gandon & Michalakis, 2002).
To date, the best empirical evidence on the importance of migration on antagonistic coevolution comes from experimental evolution studies that readily allow manipulation of host and parasite migration rates. In replicate populations of bacterium Pseudomonas fluorescens and its parasitic bacteriophage, the parasite was maladapted in the absence of migration while being locally adapted when there was parasite migration (Morgan et al., 2005). The importance of migration in promoting parasite local adaptation has received additional support from other bacteria–phage metapopulation studies (Morgan et al., 2007; Vogwill et al., 2008). However, far less is known about how the evolutionary potential of host and parasite populations varies across landscapes in natural systems where local populations are expected to vary considerably in their immigration rates. A meta‐analysis on parasite local adaptation demonstrated that in reciprocally designed experiments, the relative rates of gene flow in hosts vs. parasites were the strongest predictor of local adaptation at the species level (Hoeksema & Forde, 2008). Only those parasite species, which had greater rates of gene flow than their hosts, were found to be locally adapted. This suggests that migration rates can be a key determinant of coevolutionary dynamics also in natural systems. Snapshot data on intraspecies variation in local adaptation from two wild systems support these predictions. In the interaction between ribwort plantain (Plantago lanceolata) and powdery mildew (Podosphaera plantaginis), well‐connected host populations were more resistant than isolated host populations (Jousimo et al., 2014). Similarly, in the alpine catchfly – anther‐smut (Viscaria – Microbotryum) system, continuous host populations were more resistant than isolated or patchily distributed populations, and pathogens were more infectious in continuous populations (Carlsson‐Granér & Thrall, 2015). However, whereas these snapshot studies can reveal spatial patterns in host–parasite interactions, the mode of reciprocal adaptation (e.g. frequency depended selection or arms race dynamics) maintaining these patterns can only be revealed by studying these interactions through time (Gaba & Ebert, 2009). Moreover, studies conducted in a single time point do not convey whether this higher resistance reflects the outcome of pathogen‐imposed selection, or whether more neutral processes such as habitat quality or migration in itself in well‐connected parts of the landscape could generate spatially variable resistance levels.
Here, our aim was to determine whether spatial structure could generate variation in host evolutionary potential in a highly fragmented landscape as predicted by both theory and experimental evolution studies. For this purpose, we surveyed patterns of infection in both isolated and well‐connected populations of P. lanceolata naturally infected by P. plantaginis in the Åland Islands, SW of Finland in years 2011–2014. All host populations chosen for the study were infected in all 4 years. Our hypothesis was that hosts would be locally adapted, meaning that they have higher resistance against their sympatric than allopatric pathogens in well‐connected populations, whereas the pathogen would be locally adapted in the isolated host populations. To test this, we measured host resistance through time (years 2011–2014) against sympatric and allopatric pathogen strains in both isolated and well‐connected host populations in a large inoculation study. We focus here on host connectivity rather than the ratio of host and pathogen migration, as the Plantago population network is stable in comparison with the highly dynamic pathogen metapopulation. Hence, we expect host population connectivity to reflect long‐term spatial variation in host evolutionary potential. Contrary to our expectations, we did not find consistently higher resistance against sympatric pathogen strains in the well‐connected populations. Instead, host local adaptation varied considerably among populations and through time. Furthermore, we discovered strong fluctuations in the level of host resistance between years in the well‐connected populations, suggesting possible responses to selection. In contrast, in the isolated host populations, resistance against sympatric pathogens remained nearly unchanged through time. Together, these results suggest that hosts may be better able to respond to pathogen‐imposed selection in the well‐connected than in the isolated populations.
Materials and methods
The pathosystem
Plantago lanceolata L. is a perennial monoecious ribwort plantain that reproduces both clonally by producing side rosettes (Sagar & Harper, 1964) and sexually by wind pollination. Seeds drop close to the mother plant and usually form a long‐term seed bank (Bos, 1992). Podosphaera plantaginis (Castagne; U. Braun and S. Takamatsu) is an obligate biotroph, which belongs in the order Erysiphales within the Ascomycota. It is a powdery mildew, specialized to infect only P. lanceolata, and requires living host tissue throughout its life cycle (Bushnell, 2002). Like all powdery mildews, it completes its life cycle as localized lesions on host surface, only the haustorial feeding roots penetrating the leaf tissue to feed on nutrients. Hence, the host is assumed to suffer a loss of nutrients (Jarvis et al., 2002), and infection may lead to host mortality (Laine, 2004). The pathogen survives between epidemic seasons as resting structures (chasmothecia) that are produced by both haploid selfing and outcrossing (Tollenaere & Laine, 2013). The interaction between P. lanceolata and P. plantaginis is strain specific suggesting gene‐for‐gene type of control (Thompson & Burdon, 1992; Laine, 2004). The putative resistance mechanism has two steps. In the first step, the host may recognize the attacking pathogen and block its growth (Laine, 2004). In the second step, if the host has become infected, it may still mitigate pathogen development and reproduction (Laine, 2004).
Since the 1990s, approximately 4000 highly fragmented P. lanceolata populations have been systemically surveyed in the Åland Islands, southwest of Finland, where the host populations form a network covering an area of approximately 50 × 70 km. In this time, host populations have rarely gone extinct, and the number of populations has remained relatively stable (Ojanen et al., 2013). The first visible symptoms of P. plantaginis infection appear in late June as white‐greyish lesions consisting of mycelium supporting spores (conidia). Six to eight clonally produced generations of spores follow one another in rapid succession, often leading to local epidemic with substantial proportion of the hosts infected by late summer. The resting spores, chasmotechia, appear towards the end of growing season in August–September (Laine & Hanski, 2006). The epidemiological dynamics have been followed since year 2001 as each host population is visited in early September and its infection status is checked by visually surveying the host plants. When infection is found, an infected leaf from one to 10 infected plant individuals is collected for subsequent genotyping with sampling effort scaled to local pathogen prevalence (See ‘SNP genotyping of pathogen strains’ for details). These survey data have demonstrated that P. plantaginis infects annually 2–16% of the 4000 host populations (Laine & Hanski, 2006; Jousimo et al., 2014). A large proportion of the pathogen populations go extinct every year during the overwintering stage (20–90%), and therefore, recolonization events play important role in maintaining the disease regionally (Jousimo et al., 2014). Previous studies have revealed considerable diversity in resistance against P. plantaginis both within and among local host populations (Laine, 2004). Spatial structure has a distinct effect on resistance structure and epidemiological dynamics, with well‐connected host populations experiencing less pathogen colonization and higher pathogen extinction rates due to their higher resistance level (Jousimo et al., 2014).
Selection of study populations
To study how host population resistance and local adaptation change through time as a function of population connectivity, we selected 10 P. lanceolata populations infected by P. plantaginis in September 2014 (IDs 271, 294, 309, 321, 490, 609, 1553, 1556, 1676, 1847; Table S1). Based on the survey data, these populations were determined to be infected through 2011–2014. The source populations were classified as isolated or well‐connected, depending on their geographical location in host network. The connectivity of the population reflects the expected numbers of immigrants arriving in the population in unit time (Hanski, 1999). To assess the spatial structure of Åland populations, we calculated host population connectivity (S H) using an equation that takes into account the area of all host populations surveyed (A j) and their spatial location compared to other host populations. We assume that the dispersal distance is described by a negative exponential dispersal kernel, meaning that the connectivity of patch i is:
where d ij is the Euclidian distance between populations i and j and 1/α equals the mean dispersal distance, which was estimated to be one kilometre based on results from a previous study (Jousimo et al., 2014). In addition, we estimated the connectivity of pathogen populations (S M) in studied host populations based on the distribution of the mildew in the current year t (2014):
where 0it was 1, if mildew at patch i was present, and otherwise, 0it was 0 (Jousimo et al., 2014). The ratio for host and pathogen dispersal was estimated dividing the host connectivity S H with pathogen connectivity S M, where 1/α was 1 km for both host and pathogen (Table S1). For both host and pathogen, α was set at 1 km following results of a previous study testing a range of α values (Jousimo et al., 2014). The range for host population connectivity S H in the Åland islands varied between 10 and 370. For selected five highly connected host populations, the S H was higher than 230, and for five isolated populations, the S H was lower than 110. Well‐connected host populations also had on average a higher connectivity ratio (39.00) than isolated host populations (27.38; Table S1). Four more populations (IDs 3301, 4684, 1784 and 3108) served as source locations for allopatric pathogen strains. All study populations and allopatric pathogen populations were separated by at least two kilometres.
Plant and fungal material
In August 2014, we visited every study population and collected seeds from 10 randomly selected individual mother plants around the patch area. Seeds from all study populations had also been collected in years 2011, 2012 and 2013, except from the population 1553, where seeds were previously collected only in 2012 and 2013. Seeds were stored in paper envelopes and kept at room temperature. In addition, we collected sympatric P. plantaginis strains as infected leaves, one leaf from several plant individuals from each study population and allopatric strains from four allopatric populations. Leaves with pathogen infection were stored in moist Petri dishes in room temperature, under natural light conditions until later use.
We sowed Plantago seeds in 2 : 1 mixture of potting soil and sand, and grew seedlings in the greenhouse at 20 ± 2 °C (day) and 16 ± 2 °C (night) with 16 : 8 L : D photoperiod. From each population, seedlings originating from different mother plants were grown in individual pots, 10 plants from each population except when seeds from less individuals were harvested in 2013 (populations 271, 1556, 1847 and 1676) and 2012 (population 490; see Table S1). The fungal strains were purified through three cycles of single colony inoculations and maintained on live leaves collected from broadly susceptible Plantago genotypes grown in the greenhouse, on Petri dishes in a growth chamber 20 ± 2 °C with 16 : 8 L : D photoperiod. Every 2 weeks, the strains were transferred to fresh P. lanceolata leaves. During purification and maintenance, some strains died, and finally, we selected four sympatric strains from each population for the inoculation experiment. One allopatric mildew strain was selected from each allopatric population (3301, 4684, 1784 and 3108), and these strains were labelled as M1–M4. To produce enough sporulating fungal material for the inoculation experiment, repeated cycles of inoculations were performed.
Inoculation experiment quantifying host resistance and local adaptation
To investigate the effects of spatial structure on local adaptation and host resistance through time, we performed a partial time‐shift experiment, where host plants from each study population and year were challenged with sympatric and allopatric parasite isolates collected in 2014. Allopatric resistance was scored by inoculating all host genotypes from all years from the 10 populations with the four allopatric pathogen strains (M1, M2, M3 and M4). To test sympatric resistance, plants were inoculated with four pathogen strains that originated from the same population (in year 2014) as the host genotypes. Subsequent genotyping of pathogen populations from 2011 to 2013 revealed that most of the sympatric strains sampled in 2014 were present also in the earlier years (See Table S2). One detached leaf from each test plant was exposed to a single pathogen strain by brushing spores gently with a fine paintbrush onto the test leaf. As a positive control, spores from each used inoculum plate were placed on susceptible leaf (detected in earlier inoculation trials) to demonstrate pathogen viability. All inoculations were repeated on two individual Petri plates, leading to 5888 inoculations and 2944 host genotype–pathogen genotype combinations. Leaves were placed on moist filter paper in Petri dishes and kept in a growth chamber at 20 ± 2 with a 16/8D photoperiod.
To detect plant resistance and fungal infectivity, we observed pathogen development under a disserting microscope and scored the infection on day 12 post‐inoculation. Qualitative resistance was scored as 0 = no resistance (infection) or 1 = resistance (no infection), when there was no growth, or if the test plant showed rapid cell death around inoculum source. A genotype was defined resistant only if both inoculated replicates showed similar response (1), and susceptible if one or both replicates got infected (0). Due to the low number of germinated seeds, the resistance outcomes from year 2013 of populations 1676 and 1847 were excluded from the further analysis.
Single nucleotide polymorphism genotyping of pathogen strains
We genotyped 40 sympatric, purified pathogen strains to evaluate how well our sympatric strains from 2014 represented these populations in the previous study years. Each sample contained a piece of leaf tissue and a lesion of fungal conidial spores. Samples were placed into a 1.5‐mL tubes which were stored at −20 °C until DNA was extracted using an E.Z.N.A. Plant Mini Kit (Omega Bio‐Tek, Norcross, GA, USA) at the Institute of Biotechnology, University of Helsinki. Samples were genotyped at 19 single nucleotide polymorphism (SNP) loci with the Sequenom iPlex platform at the Institute for Molecular Medicine Finland (Tollenaere et al., 2012; Parratt et al., 2016a). Because P. plantaginis conidial spores are haploid, samples were classified as coinfected if two alleles were present at any locus (Tollenaere et al., 2012). These and any sample that failed to call all tested 19 SNP loci were removed from further genotype analysis. The similarity of sympatric pathogen multilocus genotypes (MLGs) used in the inoculation experiment was compared to strain MLGs identified from these same populations in years 2011–2013.
Statistical analyses
We analysed our data in the R programming language and environment (R Core Team, 2015) using the lme4 software package (Bates et al., 2015). We obtained P‐values for regression coefficients using the car package (Fox & Weisberg, 2011). To test whether host population resistance differed against sympatric and allopatric pathogen strains in time and space as a function of population connectivity, we analysed our data by modelling the inoculation response (0/1) as a likelihood using logit mixed‐effect model. We started with a full model that included the binomial‐dependent variable and three categorical predictors: population type (well‐connected or isolated), study year (2011, 2012, 2013 and 2014) and pathogen origin (sympatric or allopatric) and their interactions. Plant individual and population were defined as random effects, with population nested under connectivity category, and plant genotype (sample) hierarchically nested under population and connectivity category. After checking model singularity and gradient calculations, the number of iterations was set to 2e5 and the model was optimized using ‘BOBYQA’ optimizer (current GLMM default combines ‘BOBYQA’ and ‘Nelder‐Mead’; Bates et al., 2015). Model fit was assessed using χ 2 tests on the log‐likelihood values to compare different models and significant interactions.
To test whether isolated and well‐connected populations differed in the extent to which resistance varied through time, we analysed annual variation in resistance using a Bayesian logit model with patch‐specific intercept and a random term with common standard deviation σ. We analysed separately each combination of connectivity and strain origin (sympatry vs. allopatry). We assumed weakly informative half‐Cauchy prior distribution with scale 5 for σ, which has been recommended as a default choice for a top‐level variance parameter in Bayesian hierarchical models (Gelman, 2006). The half‐Cauchy prior restricts σ away from very large values, but otherwise has only minimal impact on the posterior. For the intercepts, we assumed normal prior distributions centred at 0 with standard deviation 5. The model was fit using a standard Metropolis–Hastings algorithm, which was run for 1e6 iterations with the first 1e5 discarded as burn‐in. We assessed the convergence of the algorithm with Gelman‐Rubin diagnostics from duplicate chains.
Results
Effects of spatial structure on host resistance and local adaptation over years
Overall, 83.2% of replicated inoculations showed the same response (1/1 or 0/0). The remaining 16.8% of replicates were susceptible genotypes, which got successfully infected only in one of the two tested plates (0/1). Results from the inoculation experiment demonstrated that host resistance against sympatric and allopatric mildew strains varied across years depending on population connectivity, as evidenced by the significant three‐way interaction between population connectivity, pathogen origin and year (χ 2 = 16.13, d.f. = 3, P = 0.001; Table 1; Fig. 1). This indicates that spatial structure affects host population resistance against allopatric and sympatric strains differently through time. In isolated populations, host plants varied less in their resistance against sympatric pathogen strains through all studied years (0.21 ± 0.03–0.27 ± 0.03), whereas in connected populations sympatric resistance fluctuated considerably across years (0.20 ± 0.03–0.37 ± 0.04). Host population connectivity category alone was not statistically significant in the analysis (χ 2 = 0.83, d.f. = 1, P = 0.36). We found significant fluctuations among years in the level of resistance (χ 2 = 52.80, d.f. = 3, P < 0.0001), as well as a significant interaction between year and pathogen origin (χ 2 = 16.75, d.f. = 3, P = 0.0007; Table 1; Fig. 1). Overall, resistance against allopatric strains was significantly higher than resistance against sympatric strains, suggesting that the pathogen – not the host – was locally adapted at the metapopulation level (χ 2 = 3.97, d.f. = 1, P = 0.04; Table 1; Fig. 1).
Table 1.
Results of a Generalized Linear Mixed Model (binomial distribution, logit link) analysing resistance of Plantago lanceolata against sympatric and allopatric pathogen Podosphaera plantaginis strains in both connected and isolated host populations
| Analysis of variance | |||
|---|---|---|---|
| Source | χ 2 | d.f. | P‐value |
| Connectivity | 0.83 | 1 | 0.36 |
| Year | 52.80 | 3 | < 0.0001 |
| Pathogen origin | 3.97 | 1 | 0.04 |
| Connectivity × year | 6.98 | 3 | 0.07 |
| Connectivity × pathogen origin | 0.02 | 1 | 0.87 |
| Year × pathogen origin | 16.75 | 3 | 0.0007 |
| Connectivity × year × pathogen origin | 16.13 | 3 | 0.001 |
| Random effects | Variance | ||
| Sample (nested within population and connectivity) | 0.31 | ||
| Population (nested within connectivity) | 0.023 | ||
Significant effects are highlighted in bold.
Figure 1.

Resistance in local host populations over studied years. Variation in resistance in each host population within 2011–2014 against sympatric (black lines) and allopatric (grey lines) pathogen strains, as measured through laboratory inoculations. Well‐connected populations are grouped in the upper panel and isolated populations in the lower panel. Number at the top of each panel indicates the population ID. Standard error of the mean is shown.
The Bayesian logit model revealed that the annual variation in resistance was lowest (posterior median 0.19) with posterior probability of 0.974 in isolated patches with sympatric strains (Fig. 2). In other combinations of connectivity and strain origin, the variation of sigma had significantly higher values (posterior medians 0.64–0.76), without clear differences among combinations.
Figure 2.
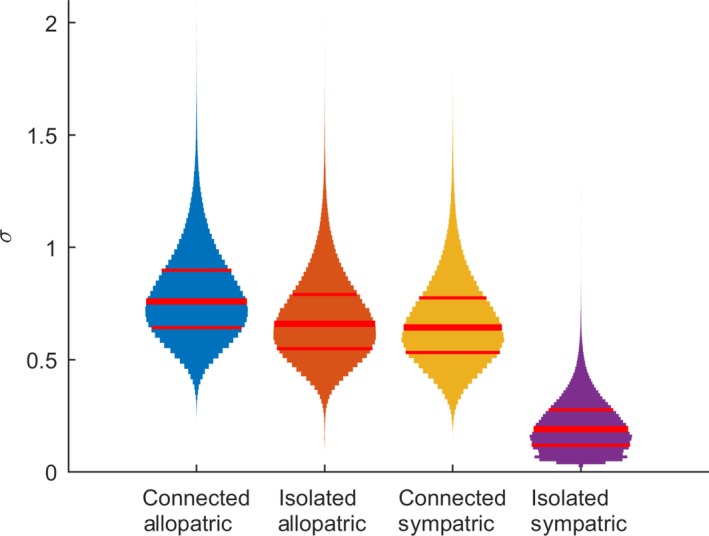
Posterior distributions of annual variation in resistance among different combinations of host population connectivity and strain origin. Each violin plot shows the posterior distribution of sigma for one combination, with the thicker line indicating median and the thinner lines 25% and 75% quantiles.
In the SNP screening of sympatric powdery mildew strains, 34 of tested 40 pathogen lesions were successfully called at all 19 SNP loci. The detected pathogen MLGs revealed that a subset of 47.1–70.6% of sympatric strains from 2014 were present in target populations in other studied years (2011–2013; Table S2). Overall, we found that 73.5% of all sympatric pathogen MLGs used in an inoculation experiment occurred in one to three previous years in target populations.
Discussion
Understanding when and where diseases will occur and how epidemics evolve is essential when aiming to predict and control outbreaks of infectious diseases. In the coevolutionary arms race between hosts and pathogen, the relative rates of gene flow may mediate selection as the interaction partner with higher migration rates may support higher evolutionary potential to respond to selection (Gandon et al., 1996). Here, we aimed to disentangle what is the effect of spatial structure on resistance dynamics in a natural system characterized by a stable host population network and a highly dynamic pathogen metapopulation. Our results reveal a host population network where the level of resistance varies through time depending on the degree of population connectivity and pathogen origin.
Spatial coevolutionary theory (Gandon & Michalakis, 2002) jointly with results from experimental evolution studies (Morgan et al., 2005) and natural populations (Lively & Dybdahl, 2000) suggest that increased ratio of host dispersal should lead to maladaptation of pathogens (Greischar & Koskella, 2007; Hoeksema & Forde, 2008). Hence, we hypothesized pathogens to be maladapted in well‐connected host populations. We focused here on host population connectivity rather than the ratio of host and pathogen connectivity which varies year‐to‐year due to the highly dynamic pathogen metapopulation. On average, well‐connected host populations are also those with a higher ratio.
Contrary to our expectations, we found that sympatric pathogen strains were overall better adapted in both isolated and well‐connected host populations compared to allopatric pathogen strains. A possible explanation for this finding could be that in well‐connected P. lanceolata populations the rate of pathogen gene flow is sufficiently high to prevent host local adaptation (Gandon et al., 1996), or that rates of host gene flow are so high that local adaptation is swamped (Lenormand, 2002). Another possible explanation for our finding relates to the dynamic nature of the pathogen metapopulation as regionally the pathogen persists in a balance between extinction and colonization events (Jousimo et al., 2014). Studies in agricultural and natural environments highlight that the probability of pathogen colonization and persistence is reduced as diversity of resistance increases (Zhu et al., 2000; Laine, 2004, 2006). When the interaction of host and pathogen is strain specific as in this system (Laine, 2004), resistance diversity will reduce the probability of establishment by immigrant pathogen strains due to incompatibility between the pathogen and the local resistance alleles. This filtering of maladapted strains prior to establishment is expected to be an important mechanism generating patterns of local adaptation in host–pathogen interactions (Burdon et al., 1996). Analysis of long‐term epidemiological data in this system has demonstrated that overall resistance is higher in well‐connected host populations and these populations also have a lower probability of being colonized by the pathogen (Jousimo et al., 2014). Hence, filtering by local host populations resistance structure may be an important driver of both ecological and evolutionary disease dynamics (Parratt et al., 2016b; Penczykowski et al., 2016). All populations chosen for our study were infected for 4 years or longer, and hence, they may represent particularly well‐adapted pathogen populations.
Importantly, we found that the temporal fluctuations in resistance against sympatric strains of the pathogen differed significantly between isolated and well‐connected host populations. According to the predictions of the Red Queen hypothesis, antagonistic coevolution between hosts and their pathogens should show fluctuating dynamics in resistance and infectivity (Jayakar, 1970). The few studies available from natural host–pathogen interaction that have quantified coevolutionary selection through time have indeed found support for frequency‐dependent selection (Decaestecker et al., 2007; Thrall et al., 2012; Paczesniak et al., 2014). Greater variation in resistance against sympatric strain in the well‐connected host populations suggests that the ability of host populations to respond to selection is greater in those parts of the landscape that support higher rates of host gene flow. Hence, high levels of resistance in well‐connected host populations reported by previous studies (Jousimo et al., 2014; Carlsson‐Granér & Thrall, 2015) may – to some degree – reflect higher evolutionary potential to respond to pathogen‐imposed selection.
Because our sympatric pathogen strains were sampled in year 2014, we must interpret their ability to measure resistance against sympatric pathogen strains with some caution in the other study years (2011–2013). However, the SNP genotyping of pathogen strains from these populations in 2011–2013 revealed that many of the strains used in the experiment were also found in earlier years. Podosphaera plantaginis is capable of both haploid selfing and outcrossing, and hence, pure strains may persist for multiple seasons (Tollenaere & Laine, 2013). The populations included in this study may be more stable than most pathogen populations in this system as they had persisted for several years, whereas most host populations are typically infected for only 1–2 years at a time (Jousimo et al., 2014).
Overall, our results indicate that the spatial isolation of host populations as a consequence of habitat fragmentation influences the evolutionary potential of hosts to fight their pathogens. Both empirical and theoretical work have shown that variation in resistance to natural enemies across spatially structured populations can fundamentally alter epidemiological and evolutionary patterns of infectious disease (Salvaudon et al., 2008; Laine et al., 2011; Tack et al., 2012), yet to our knowledge this is the first study to document such patterns through time across isolated and well‐connected populations in a natural system. Thus, our work fills a gap in knowledge of how evolutionary potential varies in a natural environment, where local host and pathogen populations are expected to experience considerably different migration rates. This work provides novel insights of how the resistance structure of natural populations may respond to fragmentation of landscapes and long‐term isolation via a direct link between the ecological and evolutionary dynamics (Hendry, 2016). This is nontrivial given that the natural environment is becoming fragmented at an unprecedented pace (Crooks et al., 2011). Our results suggest that whereas isolated population may be more difficult for pathogens to reach (Blowes & Connolly, 2012), once they do, hosts in isolation may be particularly vulnerable to disease and pests.
Supporting information
Table S1 Geographic locations and connectivity values of 10 study populations.
Table S2 Sympatric pathogen samples from 2014 detected in SNP genotyping.
Acknowledgments
We thank Niko Vilenius for help in the field and Krista Raveala for assisting in the greenhouse and organizing the pathogen SNP genotyping with Benoit Barrés. The Institute of Biotechnology and Institute for Molecular Medicine at the University of Helsinki are acknowledged for carrying out the DNA extractions and for genotyping the samples. This work was supported by funding from the Academy of Finland (Centre of Excellence in Metapopulation Biology, 284601), and European Research Council (PATHEVOL 400820) to ALL and LUOVA Doctoral Programme Fellowship to LH.
References
- Bates, D. , Maechler, M. , Bolker, B. & Walker, S. 2015. Fitting linear mixed‐effects models using lme4. J. Stat. Softw. 67: 1–48. [Google Scholar]
- Blowes, S.A. & Connolly, S.R. 2012. Risk spreading, connectivity, and optimal reserve spacing. Ecol. Appl. 22: 311–321. [DOI] [PubMed] [Google Scholar]
- Bos, M. 1992. Gene flow characters and population structure in Plantago lanceolata In: Plantago: A Multidisciplinary Study (Kuiper P.J.C. & Bos M., eds), vol. 89, pp. 222–231. Springer‐Verlag, Berlin. [Google Scholar]
- Burdon, J.J. , Wennström, A. , Elmqvist, T. & Kirby, G.C. 1996. The role of race specific resistance in natural plant populations. Oikos 76: 411–416. [Google Scholar]
- Bushnell, W.R. 2002. The Role of Powdery Mildew Research in Understanding Host‐Parasite Interaction: Past, Present and Future. pp. 1–12. APS Press, St. Paul, MN. [Google Scholar]
- Capelle, J. & Neema, C. 2005. Local adaptation and population structure at a micro‐geographical scale of a fungal parasite on its host plant. J. Evol. Biol. 18: 1445–1454. [DOI] [PubMed] [Google Scholar]
- Carlsson‐Granér, U. & Thrall, P.H. 2015. Host resistance and pathogen infectivity in host populations with varying connectivity. Evolution 69: 926–938. [DOI] [PubMed] [Google Scholar]
- Crooks, K.R. , Burdett, C.L. , Theobald, D.M. , Rondinini, C. & Boitani, L. 2011. Global patterns of fragmentation and connectivity of mammalian carnivore habitat. Philos. Trans. R. Soc. Lond. B. Biol. Sci. 366: 2642–2651. [DOI] [PMC free article] [PubMed] [Google Scholar]
- Decaestecker, E. , Gaba, S. , Raeymaekers, J.A.M. , Stoks, R. , Van Kerckhoven, L. , Ebert, D. et al 2007. Host–parasite ‘Red Queen’ dynamics archived in pond sediment. Nature 450: 870–873. [DOI] [PubMed] [Google Scholar]
- Dufva, R. 1996. Sympatric and allopatric combinations of hen fleas and great tits: a test of the local adaptation hypothesis. J. Evol. Biol. 9: 505–510. [Google Scholar]
- Fox, J. & Weisberg, S. 2011. An {R} Companion to Applied Regression, 2nd edn Sage, Thousand Oaks, CA. [Google Scholar]
- Gaba, S. & Ebert, D. 2009. Time‐shift experiments as a tool to study antagonistic coevolution. Trends Ecol. Evol. 24: 226–232. [DOI] [PubMed] [Google Scholar]
- Gandon, S. 2002. Local adaptation and the geometry of host–parasite coevolution. Ecol. Lett. 5: 246–256. [Google Scholar]
- Gandon, S. & Michalakis, Y. 2002. Local adaptation, evolutionary potential and host–parasite coevolution: interactions between migration, mutation, population size and generation time. J. Evol. Biol. 153: 451–462. [Google Scholar]
- Gandon, S. , Capowiez, Y. , Dubois, Y. , Michalakis, Y. & Olivieri, I. 1996. Local adaptation and gene‐for‐gene coevolution in a metapopulation model. Proc. Biol. Sci. 263: 1003–1009. [Google Scholar]
- Gandon, S. , Ebert, D. , Olivieri, I. & Michalakis, Y. 1998. Differential adaptation in spatially heterogeneous environments and host‐parasite coevolution In: Genetic Structure and Local Adaptation in Natural Insect Populations (Mopper S. & Strauss S.Y., eds), pp. 325–342. Springer, New York, NY. [Google Scholar]
- Gelman, A. 2006. Prior distributions for variance parameters in hierarchical models (Comment on article by Browne and Draper). Bayesian Anal. 1: 515–534. [Google Scholar]
- Greischar, M.A. & Koskella, B. 2007. A synthesis of experimental work on parasite local adaptation. Ecol. Lett. 10: 418–434. [DOI] [PubMed] [Google Scholar]
- Hamilton, W.D. , Axelrod, R. & Tanese, R. 1990. Sexual reproduction as an adaptation to resist parasites (a review). Proc. Natl. Acad. Sci. USA 87: 3566–3573. [DOI] [PMC free article] [PubMed] [Google Scholar]
- Hanski, I. 1999. Metapopulation Ecology. Oxford University Press, Oxford, UK. [Google Scholar]
- Hendry, A.P. 2016. Eco‐Evolutionary Dynamics. Princeton University Press, Princeton, NJ. [Google Scholar]
- Hoeksema, J.D. & Forde, S.E. 2008. A meta‐analysis of factors affecting local adaptation between interacting species. Am. Nat. 171: 275–290. [DOI] [PubMed] [Google Scholar]
- Imhoof, B. & Schmid‐Hempel, P. 1998. Patterns of local adaptation of a protozoan parasite to its bumblebee host. Oikos 82: 59–65. [Google Scholar]
- Jarvis, W.R. , Gubler, W.D. & Grove, G. 2002. Epidemiology of powdery mildews in agricultural pathosystems In: The Powdery Mildews: A Comprehensive Treatise (Belanger R.R., Bushnell W.R., Dik A.J. & Carver T.L.W., eds), pp. 169–199. American Phytopathological Society, St. Paul, MN. [Google Scholar]
- Jayakar, S.D. 1970. A mathematical model for interaction of gene frequencies in a parasite and its host. Theor. Popul. Biol. 1: 140–164. [DOI] [PubMed] [Google Scholar]
- Jousimo, J. , Tack, A.J.M. , Ovaskainen, O. , Mononen, T. , Susi, H. , Tollenaere, C. et al 2014. Ecological and evolutionary effects of fragmentation on infectious disease dynamics. Science 344: 1289–1293. [DOI] [PubMed] [Google Scholar]
- Kaltz, O. , Gandon, S. , Michalakis, Y. & Shykoff, J.A. 1999. Local maladaptation in the anther‐smut fungus Microbotryum violaceum to its host plant Silene latifolia: evidence from a cross‐inoculation experiment. Evolution 53: 395–407. [DOI] [PubMed] [Google Scholar]
- Kawecki, T.J. & Ebert, D. 2004. Conceptual issues in local adaptation. Ecol. Lett. 7: 1225–1241. [Google Scholar]
- Kniskern, J.M. , Barrett, L.G. & Bergelson, J. 2011. Maladaptation in wild populations of the generalist plant pathogen Pseudomonas syringae . Evolution 65: 818–830. [DOI] [PMC free article] [PubMed] [Google Scholar]
- Koskela, T. , Salonen, V. & Mutikainen, P. 2000. Local adaptation of a holoparasitic plant, Cuscuta europaea: variation among populations. J. Evol. Biol. 13: 749–755. [Google Scholar]
- Koskella, B. 2014. Bacteria‐phage interactions across time and space: merging local adaptation and time‐shift experiments to understand phage evolution. Am. Nat. 184: S9–S21. [DOI] [PubMed] [Google Scholar]
- Laine, A.‐L. 2004. Resistance variation within and among host populations in a plant–pathogen metapopulation: implications for regional pathogen dynamics. J. Ecol. 92: 990–1000. [Google Scholar]
- Laine, A.‐L. 2006. Evolution of host resistance: looking for coevolutionary hotspots at small spatial scales. Proc. Biol. Sci. 273: 267. [DOI] [PMC free article] [PubMed] [Google Scholar]
- Laine, A.‐L. 2007. Detecting local adaptation in a natural plant–pathogen metapopulation: a laboratory vs. field transplant approach. J. Evol. Biol. 20: 1665–1673. [DOI] [PubMed] [Google Scholar]
- Laine, A.‐L. & Hanski, I. 2006. Large‐scale spatial dynamics of a specialist plant pathogen in a fragmented landscape. J. Ecol. 94: 217–226. [Google Scholar]
- Laine, A.‐L. , Burdon, J.J. , Dodds, P.N. & Thrall, P.H. 2011. Spatial variation in disease resistance: from molecules to metapopulations. J. Ecol. 99: 96–112. [DOI] [PMC free article] [PubMed] [Google Scholar]
- Lenormand, T. 2002. Gene flow and the limits to natural selection. Trends Ecol. Evol. 17: 183–189. [Google Scholar]
- Lively, C.M. 1999. Migration, virulence, and the geographic mosaic of adaptation by parasites. Am. Nat. 153: 34–47. [DOI] [PubMed] [Google Scholar]
- Lively, C.M. & Dybdahl, M.F. 2000. Parasite adaptation to locally common host genotypes. Nature 405: 679–681. [DOI] [PubMed] [Google Scholar]
- Lively, C.M. & Jokela, J. 1996. Clinal variation for local adaptation in a host‐parasite interaction. Proc. Biol. Sci. 263: 891–897. [Google Scholar]
- Morand, S. , Manning, S.D. & Woolhouse, M.E. 1996. Parasite‐host coevolution and geographic patterns of parasite infectivity and host susceptibility. Proc. Biol. Sci. 263: 119–128. [DOI] [PubMed] [Google Scholar]
- Morgan, A.D. , Gandon, S. & Buckling, A. 2005. The effect of migration on local adaptation in a coevolving host–parasite system. Nature 437: 253–256. [DOI] [PubMed] [Google Scholar]
- Morgan, A.D. , Brockhurst, M.A. , Lopez‐Pascua, L.D. , Pal, C. & Buckling, A. 2007. Differential impact of simultaneous migration on coevolving hosts and parasites. BMC Evol. Biol. 7: 1. [DOI] [PMC free article] [PubMed] [Google Scholar]
- Mutikainen, P. , Salonen, V. , Puustinen, S. & Koskela, T. 2000. Local adaptation, resistance, and virulence in a hemiparasitic plant‐host plant interaction. Evolution 54: 433–440. [DOI] [PubMed] [Google Scholar]
- Ojanen, S.P. , Nieminen, M. , Meyke, E. , Pöyry, J. & Hanski, I. 2013. Long‐term metapopulation study of the Glanville fritillary butterfly (Melitaea cinxia): survey methods, data management, and long‐term population trends. Ecol. Evol. 3: 3713–3737. [DOI] [PMC free article] [PubMed] [Google Scholar]
- Oppliger, A. , Vernet, R. & Baez, M. 1999. Parasite local maladaptation in the Canarian lizard Gallotia galloti (Reptilia: Lacertidae) parasitized by haemogregarian blood parasite. J. Evol. Biol. 12: 951–955. [Google Scholar]
- Paczesniak, D. , Adolfsson, S. , Liljeroos, K. , Klappert, K. , Lively, C.M. & Jokela, J. 2014. Faster clonal turnover in high‐infection habitats provides evidence for parasite‐mediated selection. J. Evol. Biol. 27: 417–428. [DOI] [PubMed] [Google Scholar]
- Parratt, S.R. , Barrès, B. , Penczykowski, R.M. & Laine, A.‐L. 2016a. Local adaptation at higher trophic levels: contrasting hyperparasite–pathogen infection dynamics in the field and laboratory. Mol. Ecol. 26: 1964–1979. [DOI] [PMC free article] [PubMed] [Google Scholar]
- Parratt, S.R. , Numminen, E. & Laine, A.‐L. 2016b. Infectious disease dynamics in heterogeneous landscapes. Annu. Rev. Ecol. Evol. Syst. 47: 283–306. [Google Scholar]
- Penczykowski, R.M. , Laine, A.‐L. & Koskella, B. 2016. Understanding the ecology and evolution of host–parasite interactions across scales. Evol. Appl. 9: 37–52. [DOI] [PMC free article] [PubMed] [Google Scholar]
- R Core Team (2015) R for Windows. The R Project for Statistical Computing, Vienna, Austria. [Google Scholar]
- Sagar, G.R. & Harper, J.L. 1964. Plantago major L., P. media L. and P. lanceolata L. J. Ecol. 52: 189–221. [Google Scholar]
- Salvaudon, L. , Giraud, T. & Shykoff, J.A. 2008. Genetic diversity in natural populations: a fundamental component of plant–microbe interactions. Curr. Opin. Plant Biol. 11: 135–143. [DOI] [PubMed] [Google Scholar]
- Tack, A.J.M. , Thrall, P.H. , Barrett, L.G. , Burdon, J.J. & Laine, A.‐L. 2012. Variation in infectivity and aggressiveness in space and time in wild host–pathogen systems: causes and consequences. J. Evol. Biol. 25: 1918–1936. [DOI] [PMC free article] [PubMed] [Google Scholar]
- Thompson, J.N. 1994. The Coevolutionary Process. University of Chicago Press, Chicago, IL. [Google Scholar]
- Thompson, J.N. 1999. Specific hypotheses on the geographic mosaic of coevolution. Am. Nat. 153: 1–14.29578773 [Google Scholar]
- Thompson, J.N. & Burdon, J.J. 1992. Gene‐for‐gene coevolution between plants and parasites. Nature 360: 121–125. [Google Scholar]
- Thrall, P.H. , Burdon, J.J. & Bever, J.D. 2002. Local adaptation in the Linum marginale‐Melampsora lini host‐pathogen interaction. Evolution 56: 1340–1351. [DOI] [PubMed] [Google Scholar]
- Thrall, P.H. , Laine, A.‐L. , Ravensdale, M. , Nemri, A. , Dodds, P.N. , Barret L.G. et al 2012. Rapid genetic change underpins antagonistic coevolution in a natural host‐pathogen metapopulation. Ecol. Lett. 15: 425–435. [DOI] [PMC free article] [PubMed] [Google Scholar]
- Tollenaere, C. & Laine, A.‐L. 2013. Investigating the production of sexual resting structures in a plant pathogen reveals unexpected self‐fertility and genotype‐by‐environment effects. J. Evol. Biol. 26: 1716–1726. [DOI] [PubMed] [Google Scholar]
- Tollenaere, C. , Susi, H. , Nokso‐Koivisto, J. , Koskinen, P. , Tack, A. , Auvinen, P. et al 2012. SNP Design from 454 sequencing of Podosphaera plantaginis transcriptome reveals a genetically diverse pathogen metapopulation with high levels of mixed‐genotype infection. PLoS One 7: 1–10. [DOI] [PMC free article] [PubMed] [Google Scholar]
- Vogwill, T. , Fenton, A. & Brockhurst, M.A. 2008. The impact of parasite dispersal on antagonistic host–parasite coevolution. J. Evol. Biol. 21: 1252–1258. [DOI] [PubMed] [Google Scholar]
- Zhu, Y. , Chen, H. , Fan, J. , Wang, Y. , Li, Y. , Chen J. et al 2000. Genetic diversity and disease control in rice. Nature 406: 718–722. [DOI] [PubMed] [Google Scholar]
Associated Data
This section collects any data citations, data availability statements, or supplementary materials included in this article.
Supplementary Materials
Table S1 Geographic locations and connectivity values of 10 study populations.
Table S2 Sympatric pathogen samples from 2014 detected in SNP genotyping.