

Abstract
Immunotherapy is revolutionizing cancer treatment and has shown success in particular for tumors with a high mutational load. These effects have been linked to neoantigens derived from patient‐specific mutations. To expand efficacious immunotherapy approaches to the vast majority of tumor types and patient populations carrying only a few mutations and maybe not a single presented neoepitope, it is necessary to expand the target space to non‐mutated cancer‐associated antigens. Mass spectrometry enables the direct and unbiased discovery and selection of tumor‐specific human leukocyte antigen (HLA) peptides that can be used to define targets for immunotherapy. Combining these targets into a warehouse allows for multi‐target therapy and accelerated clinical application. For precise personalization aimed at optimally ensuring treatment efficacy and safety, it is necessary to assess the presence of the target on each individual patient's tumor. Here we show how LC‐MS paired with gene expression data was used to define mRNA biomarkers currently being used as diagnostic test IMADETECT™ for patient inclusion and personalized target selection within two clinical trials (NCT02876510, NCT03247309). Thus, we present a way how to translate HLA peptide presentation into gene expression thresholds for companion diagnostics in immunotherapy considering the peptide‐specific correlation to its encoding mRNA.
Keywords: Human leukocyte antigen, Immunopeptidome, Immunotherapy, Label‐free quantitation, Precision medicine
1. Introduction
Presentation of peptides on human leukocyte antigen (HLA) molecules is a central mechanism allowing the adaptive immune system to differentiate healthy from infected or cancerous cells. The complex nature and flexibility of the antigen processing machinery across cell types and disease states complicates the robust inference of HLA‐restricted peptide presentation by predictive approaches using binding motifs1 or binding affinities.2 The incorporation of mass spectrometry‐based HLA peptidomics data into the training of prediction algorithms has recently regained a lot of attention after its initial debut in the 1990s3 and now has been demonstrated to result in substantial improvements compared to HLA binding prediction trained on in vitro data alone.4, 5, 6 However, the low prevalence of presented HLA ligands in the available space of theoretical peptides would require specificity above 0.999 to achieve a positive predictive value of at least 50%.7 Thus, a large proportion of predicted targets might not be presented on human cells and therefore, albeit potentially showing in vitro as well as in vivo immunogenicity, may fail anti‐tumor activity.8
For these reasons, robust and precise identification and selection of new HLA peptides as targets for cancer immunotherapy is ideally directly informed by the integrated analysis of a comprehensive and deep map of the HLA ligandome in health and disease across tissue types. While the significant cost and the labor‐intensive nature of direct immunopeptidome analysis by mass spectrometry represent a substantial barrier, the information gained by this approach may ultimately prove invaluable and may enable‐besides direct target identification‐the further improvement of predictive approaches. Analysis depth also plays an important role since antigen‐specific immunotherapies are restricted to certain HLA allotypes (e.g., A*02:01), thus reducing the available ligand space. For example, analyzing ten independent patients will result in a combined dataset of peptides derived from approximately 30 distinct class I allotypes9 and thus only a marginal fraction of the detected ligands will bind to the same HLA.
Once the ligand space is defined, the selection of appropriate targets requires confirmation of tumor specificity in vivo. For neoantigens, this is an inherent feature as they are encoded by non‐synonymous somatic mutations defined by differential analysis of tumor and germline DNA. To circumvent limitations of neoantigen targets10 and expand therapy options to the vast majority of tumor types characterized by low mutational burden11 and to patients presenting no neoepitope by HLA, it is necessary to consider the target space of non‐mutated cancer‐associated peptides. However, target discovery and validation of these antigens is more challenging and requires vast panels of tumor and normal tissue samples to allow for the generation of a comprehensive map of the human immunopeptidome in health and disease.
Significance Statement
The growing number of HLA ligandomes resolved by mass spectrometry paves the way for development of new immunotherapies. In this work, we show how the knowledge about the human immunopeptidome across healthy and cancerous tissues can be used beyond target discovery and validation. We demonstrate the necessity of quantitation of HLA bound peptides by label‐free LC‐MS to verify the peptide‐specific correlation with the corresponding mRNA measured by RNA‐Seq. On that basis, we show that mass spectrometry guided mRNA expression thresholds can be defined that allow definition of predictive biomarkers for clinical use in personalized therapies. This enables precision immunotherapies against cancer by selecting patients as well as the most relevant targets per patient.
Once targets are selected and validated, there is a strong need for predictive biomarkers defining target positive patients to allow personalization12 thus only treating individuals for which a clinical benefit can be expected. The method of choice to use in clinical settings is the quantitation of mRNA expression by quantitative polymerase chain reaction (qPCR). The use of mRNA assumes that HLA peptide presentation and mRNA expression are correlated. While it has been shown that highly abundant transcripts usually result in higher numbers of class I bound peptides,13 this does not necessarily hold true for every pair of peptide and corresponding mRNA.14 Here we show how mass spectrometry can be used to establish the association between peptide presentation and mRNA expression for individual peptides and how this association can be translated from LC‐MS to RNA‐Seq to qPCR data to define predictive biomarkers allowing precision medicine by personalized mRNA expression analysis guided by immunopeptidomics.
2. Experimental Section
2.1. HLA Peptide Isolation and Mass Spectrometry
Integrated HLA ligandome–transcriptome analysis was performed for a set of 170 HLA‐A*02 positive tumor samples from 21 cancer types (see Table 1, Supporting Information) for which paired LC‐MS and RNA‐Seq data was available. Samples were surgically excised after written informed consent, snap‐frozen in liquid nitrogen upon extraction, and stored at −80 °C until HLA precipitation. HLA peptide complexes were isolated by immunoprecipitation using the HLA‐A*02‐specific antibody BB7.2. After ultrafiltration peptide extracts were separated by reversed‐phase chromatography (nanoACQUITY UPLC system, Waters, Milford, MA) at 300nL min−1 using ACQUITY UPLC BEH C18 columns (75 μm × 250 mm, Waters, Milford, MA) and a gradient ranging from 1 to 34.5% ACN over the course of 190 min. Mass spectrometry was performed on Orbitrap LTQ, Velos, and Fusion mass spectrometers (Thermo Fisher Scientific, Waltham, MA) resulting in 135, 403, and 305 runs, respectively. Mass spectral data was acquired by data‐dependent acquisition (DDA) in profile mode for at least four replicate injections by different mass analyzers in low‐ (ion trap) and high‐resolution MS acquisition mode (Orbitrap) using collision‐induced dissociation (CID) as well as higher‐energy collisional dissociation (HCD) resulting in 843 LC‐MS runs total.
2.2. RNA Isolation and Sequencing
In parallel to every peptide preparation, total RNA was isolated using TRIzol (Invitrogen, Karlsruhe, Germany) followed by purification with the RNeasy mini kit (Qiagen, Hilden, Germany) according to the manufacturer's protocol. RNA sequencing and expression quantification were performed by CeGaT (Tübingen, Germany). In brief, 1–2 μg total RNA were used as starting material for the library preparation performed according to the Illumina protocol (TruSeq Stranded mRNA Library Prep Kit). The sequencing process was performed on an Illumina HiSeq2500 machine. For all experiments, a strand‐specific protocol was used to generate single‐end reads of a length of 50 nucleotides. The minimum number of reads was 43 700 000 per sample. The quality of the sequencing process was monitored using PhiX spike‐ins.
2.3. RNA‐Seq Data Analysis
Reads were aligned against the human reference genome GRCh38.p1 and annotated with Ensembl 77 (http://www.ensembl.org). Gene expression levels were determined by extraction of read counts per exon using bedtools 2.19.115 and conversion to FPKM values by normalization according to exon length and the number of mapped reads. Assessment of target prevalence was based on RNA‐Seq data from the cancer genome atlas (TCGA, June 2015, http://cancergenome.nih.gov/). DESeq16 normalization was performed to allow inter‐sample comparisons of expression values.
2.4. HLA Typing
DNA of every donor was isolated from tissue or whole blood using the QIAamp DNA Mini Kit (Qiagen) or the QIAamp DNA Blood Mini Kit (Qiagen), respectively. The QIAamp Investigator Kit (Qiagen) was used to isolate DNA in case of limited amounts of tissue. HLA genotyping for HLA‐A*02 was performed by PCR and subsequent agarose gel electrophoresis using the Ambisolv Primer Mix PM002 (Life Technologies) and recombinant Taq polymerase (Life Technologies).
2.5. Mass Spectrometry Data Analysis
Tandem mass spectra (MS/MS) were extracted and centroided using Proteome Discoverer 1.4 (Thermo Fisher Scientific, Waltham, MA). Peptide sequences were identified by a proprietary in‐house pipeline17 combining protein database search, spectral clustering, and retention time alignment. In brief, fragment spectra are searched with SEQUEST (Thermo Fisher Scientific, Waltham, MA) and MSGF+18 against the international protein index (IPI v3.78). The database search was configured without cleavage specificity (no enzyme), variable modifications for methionine (oxidation) and serine/threonine/tyrosine (phosphorylation), 3 ppm precursor mass tolerance, 0.01 Da fragment mass tolerance for Orbitrap and 1 Da for Ion trap MS/MS. Peptide spectrum matches were filtered using fixed thresholds and 5% false discovery rate (FDR) based on concatenated reversed decoy database. In parallel, spectra were clustered using MSClustering19 into a spectral archive to allow ID propagation. Spectral clusters were based on 10 ppm precursor mass tolerance and a mixture probability of 0.1. LC‐MS peptide signal features were extracted by SuperHirn v1.020 to determine peak areas of extracted ion chromatograms (XIC) for MS1‐based relative quantitation. After charge state deconvolution with OpenMS Decharger 1.6,21 LC‐MS features were assigned to identified MS/MS spectra. Retention time alignment of technical replicates20 was performed to allow matching of LC‐MS signals between runs. Peptide abundance levels per sample were determined by median total area of the replicates. The total‐area was defined as the sum of the normalized XIC areas of all observed charge states. Systematic bias was rectified by central tendency normalization20 to account for differences in HLA expression and technical variations.
2.6. Statistical Analysis
Threshold optimization was computed with Python 2.7.11 using scikit‐learn 0.17.122 and numPy 1.10.423 by maximizing the score:
| (1) |
where α is the RNA‐Seq threshold, δ is the threshold for the number of identified HLA‐A*02 peptides used to assess the A*02 peptidome measurement depth (A*02 PMD), and β the weighting factor between recall and precision set to 2. TP is the number of true positives (peptide is detected and sample passes the thresholds), FN the number of false negatives (peptide is detected and sample does not pass at least one of the thresholds), and FP the number of false positives (peptide is not detected but sample passes the thresholds). Confidence intervals for the RNA‐Seq threshold were estimated using parametric bootstrapping. A logistic regression model was fitted for each target on the RNA‐Seq expression values (log transformed) and the A*02 PMD (square root transformed). The probability of the peptide being present was computed as
| (2) |
where X are the covariates and w the fitted coefficients. Bootstrap replicates were generated by drawing the peptide detection state from the Bernoulli distribution (Equation 2). Confidence intervals were obtained by summarizing the bootstrap replicates to the corresponding quantiles.
To assess the contribution of the gene expression to the model, an A*02 PMD threshold is obtained by maximizing the F score without RNA‐Seq expression values. The F score F NULL of the resulting null model is compared to the F score of the combined threshold to give ∆F = F − F NULL. A large ∆F score indicates that peptide detection can be predicted by gene expression whereas a small ∆F score indicates a dependence on PMD rather than on gene expression.
The distribution of F and ∆F was visualized as scatterplot and smoothed histogram using kernel density estimates (ggplot2 2.2.1). A set of 1000 peptides was randomly selected for different bins of detection frequency. The binning is necessary since the precision and therefore also the F‐score distribution depends on the prevalence of the predicted event.
All other statistics and data visualizations where generated with R 3.1.0.24
3. Results and Discussion
3.1. Target Discovery
The human immunopeptidome was analyzed using the antigen discovery platform XPRESIDENT®25 that combines mass spectrometry for identification and quantitation of HLA ligands with expression analysis of corresponding mRNA (Figure 1A). Tissue samples from cancer patients and healthy donors were used to isolate mRNA, DNA, and HLA bound peptides. HLA peptides were identified by LC‐MS/MS independent of HLA binding prediction. The relative abundance of HLA peptides was quantified by label‐free LC‐MS to establish quantitative peptide profiles across samples. Differential analysis was then applied to identify peptides exclusively presented or over‐presented on tumor tissues (tumor‐associated peptides [TUMAPs]). Thus, reducing the risk for potential on‐target toxicities in the patient.
Figure 1.
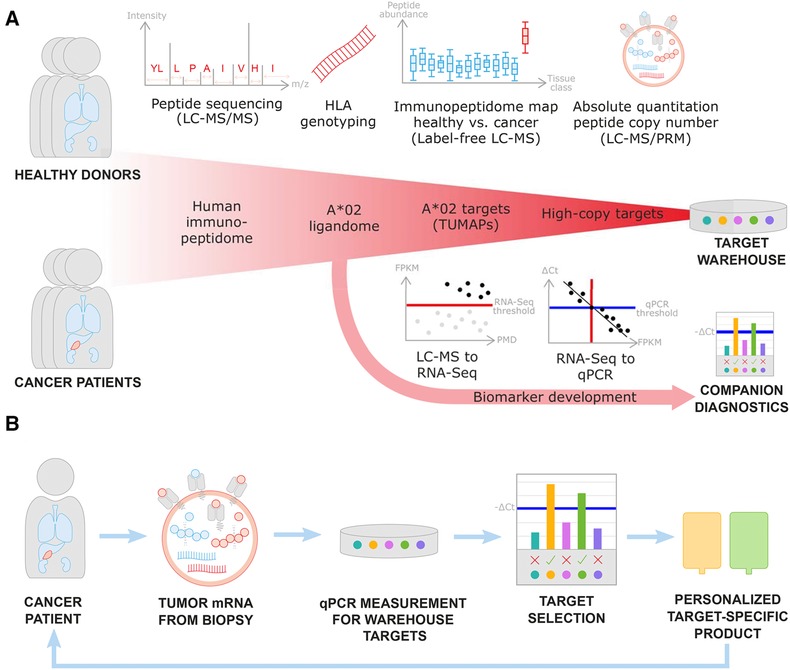
Mass spectrometry guided target discovery with concomitant biomarker development and its translation into clinical application. A) For target discovery, HLA ligands are identified by LC‐MS/MS followed by restriction to HLA‐A*02 positive donors. Label‐free quantitation of HLA‐peptide abundance by mass spectrometry as well as gene expression by RNA‐Seq is inspected across tumor (red) and normal (blue) tissues to define tumor‐associated peptides (TUMAPs). As part of target validation, parallel reaction monitoring (PRM) mass spectrometry allows to determine absolute peptide copy numbers per cell. Multiple targets can be combined to a target warehouse to maximize treatment efficacy and safety. Based on the acquired data, for every peptide the correlation between peptide and mRNA levels needs to be investigated to ensure that development of mRNA companion diagnostics is feasible. For this, LC‐MS peptide presentation is mapped to predictive RNA‐Seq thresholds in FPKM (red) and calibrated to qPCR thresholds expressed in ∆Ct (blue). Target genes expression above the determined threshold will be used as selection criterium within the diagnostic test. B) Personalization workflow based on mass spectrometry guided qPCR thresholds. Biopsies from cancer patients are used to measure mRNA expression of warehouse targets using qPCR. Target peptides are considered to be presented by the tumor if expression of corresponding mRNA is above the threshold. The screened cancer patient receives a personalized target‐specific product (e.g., engineered T cells for adoptive cellular transfer).
Quantitative HLA peptidomics data was complemented and integrated with RNA‐Seq gene expression measurements to provide an additional level of evidence for tumor selectivity of the target. Figure 2 shows the agreement between the two levels for the exemplary glioblastoma target PTPRZ1p195 (AIIDGVESV, P23471195‐203) derived from protein tyrosine phosphatase Z polypeptide 1 (PTPRZ1). The HLA peptidome is assumed to be more closely correlated to the transcriptome than the proteome considering that many HLA bound peptides are derived from defective ribosomal products, also called DRiPs,26 that are not identified by standard proteomics. Thus, we focused on developing RNA‐based companion diagnostics as an amenable surrogate for peptide target copy numbers. Recently, this has been supported by reports showing that inclusion of protein expression data into prediction of HLA peptide presentation only provides marginal benefit beyond inclusion of RNA‐Seq data, indicating a large redundancy of the two factors.4
Figure 2.
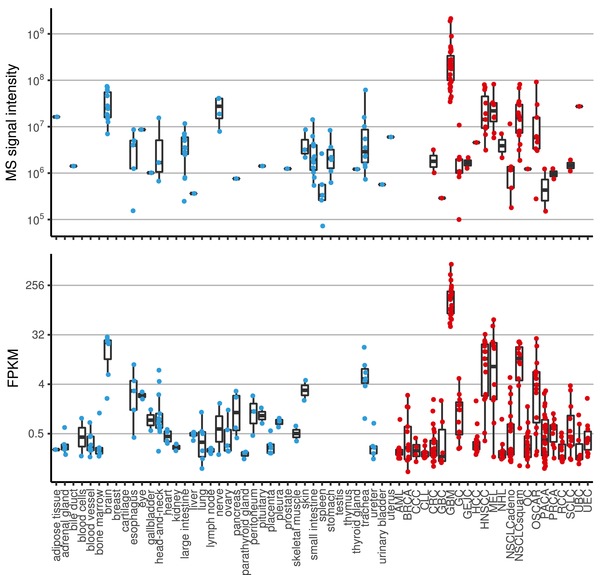
Peptide presentation and gene expression profiling of glioblastoma target PTPRZ1p195 derived from protein tyrosine phosphatase Z polypeptide 1 (PTPRZ1) isolated from tumor (red) and normal (blue) tissues. A) Each dot represents a sample for which the peptide was identified and quantified by mass spectrometry. B) Shows the mRNA expression for exon 6 of PTPRZ1 (ENSE00001288392) measured by RNA‐Seq in FPKM. The peptide shows tenfold higher peptide presentation levels and fourfold higher gene expression in glioblastoma samples (GBM) compared to healthy brain and on average 100‐fold and 50‐fold higher levels compared to other healthy tissues for presentation and expression, respectively.
3.2. Peptide‐Specific Correlation With Gene Expression
From the XPRESIDENT® target discovery data, a subset of 170 HLA‐A*02 positive tumor samples with paired RNA‐Seq and LC‐MS measurements were used to establish predictive biomarkers for patient and target selection within immunotherapies using multiple targets combined to target warehouses (see Figure 1A). The most straightforward way to associate the two datasets is by correlating peptide and mRNA levels using Pearson's correlation coefficient and visualizing the data using a scatterplot. Peptide PDCD4p294 (ALDKATVLL, Q53EL6294‐302) from programmed cell death protein 4 (PDCD4) in Figure 3A represents a case where both measures correlate well (R = 0.49, p < 0.001) while Peptide TSC2p526 (SLLDIIEKV, P49815526‐534) from tuberin (TSC2) does not show (Figure 3B) any observable correlation (R = 0.07, p = 0.303). Individual correlations that vary widely between genes have also been shown for the relationship between proteins and their corresponding transcripts[27] underlining the fact that every target must be carefully validated to ensure that extrapolations from one “ome” to the other are valid. In addition, the estimation of correlation itself will be only applicable for a small fraction of peptides. As soon as the peptide is not detected in a sample, the correlation neglects the gene expression information for this data pair. Figure 3C gives an example for a peptide with high correlation (R = 0.68, p < 0.001) yet this peptide is not detected in 74% of the samples (Figure 3D). This scenario is common for targets for immunotherapy which are not expected to be constitutively presented but rather show selective presentation on certain tumor types or subsets thereof. This means that instead of investigating the log‐linear relation between gene expression and peptide presentation based on data filtered for paired detection in both measurements, we modeled a binary classifier for the prediction of peptide presentation as a dichotomous event (detected vs. not detected) based on gene expression.
Figure 3.
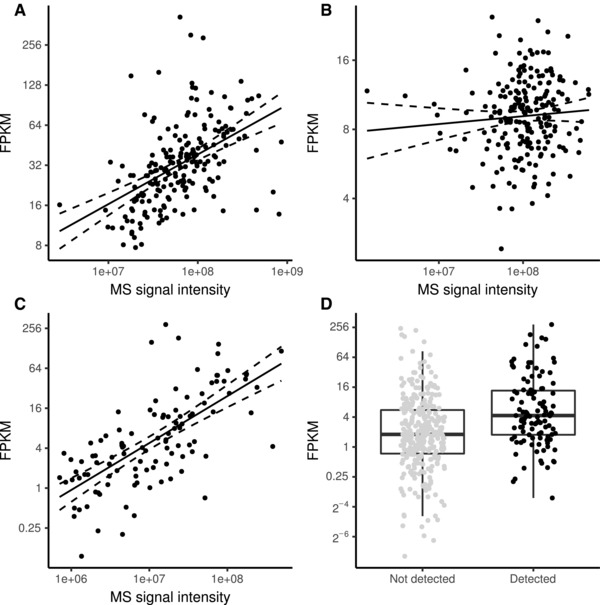
Correlation between gene expression and peptide presentation. A) Peptide PDCD4p294 from programmed cell death protein 4 shows good correlation between gene expression and peptide presentation (R = 0.49, p < 0.001). B) Peptide TSC2p526 from tuberin shows no correlation between gene expression as measured by RNA‐Seq compared to peptide presentation measured by label‐free LC‐MS (R = 0.07, p = 0.303). C) Peptide SYNMp426 from synemin shows a correlation between gene expression and peptide presentation when filtered for samples with pairwise complete measurements (R = 0.68, p < 0.001). D) Dot‐box‐plot of gene expression for SYNMp426 for samples with and without peptide detection.
3.3. Mass Spectrometry Guided Gene Expression Threshold
The difficulty in the prediction of peptide detection stems from the complexity of missingness involved with peptide measurements (Table 1). From a therapeutic point of view, the most interesting case of missing data is missingness due to absent presentation on the cell surface. Yet, missing data is also caused by left censoring due to the limit of detection in measuring a peptide. This limit is sample‐dependent and influenced by sample quality, degree of necrosis, HLA expression, efficiency of peptide extraction, as well as performance of the LC‐MS system. To better assess the likelihood that a peptide could be detected in a sample, we included the A*02 peptidome measurement depth (A*02 PMD) as a confounding factor in our classifier. We assessed the A*02 PMD by the total number of unique A*02 peptides identified by LC‐MS at 5% FDR. How the PMD translates into likelihood of detection of a given peptide depends on the binding affinity of the peptide but also on analytical properties like ionization efficiency or hydrophobicity.
Another reason for missing data is randomly missing identifications, for instance, due to the stochastic nature of DDA in sampling peptides for fragmentation by mass spectrometry. Also, interference with other abundant co‐eluting ions in the samples might contribute to this effect. Due to the random nature, this effect cannot be directly expressed as a factor in the classification model but was handled using resampling techniques.
Based on the assessment of potential reasons for missing data, we trained a peptide‐specific two‐factor binary classifier that differentiates detection of a peptide from missing detection based on gene expression corrected for PMD. A possible approach would be to train a logistic regression model with the two factors (Figure 4A). Yet, since the goal of this study is to define an RNA‐Seq threshold independent of peptide measurement effects, we used a decision tree for binary classification. This method ignores additivity of the two factors but allows for optimizing the PMD and RNA‐Seq threshold simultaneously. Thus, the decision tree segments the data space into four quadrants (Figure 4B). The horizontal threshold (red line) describes the lower limit of gene expression and the vertical threshold the lower A*02 PMD (black line) necessary for the peptide to be detected if present. This means that quadrant Q1 contains the predicted positives while Q2–Q4 are predicted negative. The samples missing due to left censoring represent quadrants Q2 and Q3 while peptides absent due to low gene expression represent Q3 and Q4 (Table 1). Confounding effects due to randomly missing identifications will affect all quadrants.
Figure 4.
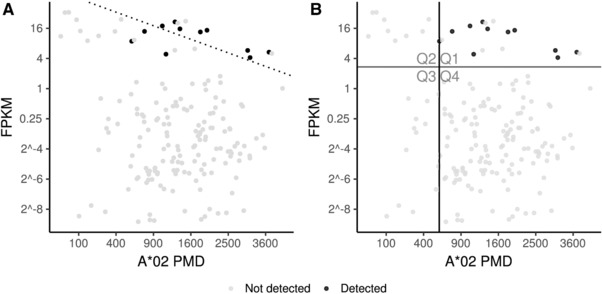
Two‐factor binary classification of KCNJ10p371 (ALSVRISNV, P78508371‐379) derived from potassium inwardly rectifying channel protein, subfamily J, member 10 (KCNJ10). Peptide detection is predicted using (A) logistic regression and (B) decision tree based on gene expression by RNA‐Seq and A*02 PMD (HLA‐A*02 peptidome measurement depth). The decision line (dotted line) in (A) separates all samples that are more likely to have the peptide detected from all samples that are more likely to not have the peptide detected. The quadrants defined in (B) are defined by optimizing the A*02 PMD (black line) and RNA‐Seq threshold (red line) using the F score.
Table 1.
Missingness categories with respect to missing data giving an overview of main reasons explaining why a peptide is not detected or even not present. The different effects influence the different quadrants in the classification plot (Figure 4)
| Missingness category | Peptide presented | Peptide detected | Affected quadrants |
|---|---|---|---|
| No or low gene expression | No | No | Q3, Q4 |
| Differential antigen processing | No | No | All quadrants |
| Left censoring | Yes | No | Q2, Q3 |
| Missing identification | Yes | No | All quadrants |
| Successful detection | Yes | Yes | Q1 |
To estimate the two thresholds, we used the F score to optimize sensitivity (recall) as well as precision (positive predictive value) at the same time. Since censoring is likely the dominating factor in the model, both metrics were weighted accordingly. To account for random missingness, the optimization involves resampling using parametric bootstrapping which also allows for assessing confidence in the threshold estimation (Figure 5). The size of the interval reflects how much the threshold might be influenced by single mislabeled data points inherent to the measurement procedure.
Figure 5.
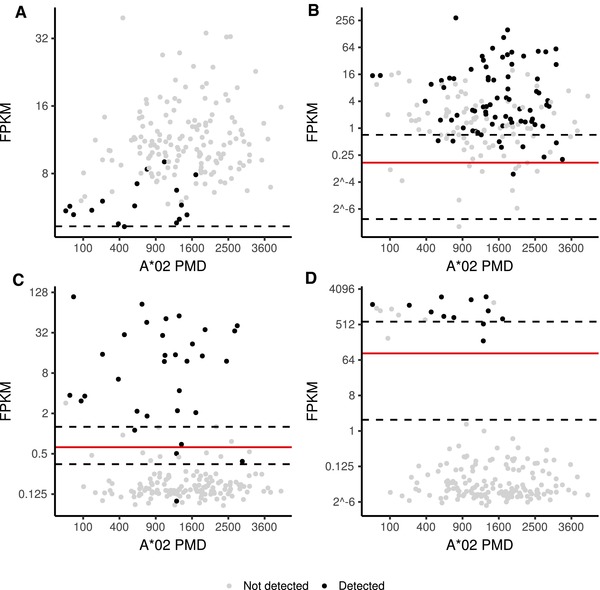
Threshold optimization and confidence estimates for binary classification of peptide detection by gene expression corrected for A*02 PMD (HLA‐A*02 peptidome measurement depth). The FPKM score predicting peptide detection with optimal F‐score is shown as red line while the 95% confidence interval is depicted as dashed line. A) Detection of PIGCp89 cannot be predicted by gene expression and PMD (F = 0.338). B) Detection of SYNMp426 can be predicted by gene expression (F = 0.810) but equally well by PMD alone (∆F = 0.009). C) Detection of ETNPPLp355 is well predictable by gene expression (F = 0.909) compared to PMD alone (∆F = 0.370). D) For detection of GFAPp96 the improvement of prediction performance is even more pronounced with ∆F = 0.640.
3.4. Biomarker Assessment
To finally assess if the estimated biomarker threshold is suited for predicting peptide presentation, the F score and ∆F score were inspected. The F score reflects the general quality of the model in predicting peptide presentation while the ∆F score reflects the contribution of expression of the peptide's coding gene which is relevant for the later clinical application relying on mRNA measurements. In addition, the reliability in the threshold estimate can be assessed by inspection of the threshold confidence interval.
Inability to predict peptide detections is caused by additional factors that influence peptide presentation that are not reflected in the model. This includes regulation and rate of translation,28 protein turnover, processing by the proteasome, cytosolic peptidases, transporter for antigen processing (TAP), and binding affinity to HLA.29 Every organ, every transcript, and every peptide therefore might be differently affected by these components.
The peptides ETNPPLp355 (TLIGDIRGIGL, Q8TBG4355‐365) derived from ethanolamine‐phosphate phospho‐lyase (ETNPPL) and GFAPp96 (ALAAELNQL, P1413696‐104) derived from glial fibrillary acidic protein (GFAP) shown in Figure 5C,D are well predictable by gene expression with F = 0.909 (∆F = 0.370) and F = 0.902 (∆F = 0.640), respectively. On the other hand, the peptide PIGCp89 (GLASSLIGYV, Q9253589‐98) derived from phosphatidyl‐inositol N‐acetyl‐glucosaminyl‐transferase subunit C (PICG) represents an example where the relationship between gene expression and peptide detection is disconnected (Figure 5A) reflected by the low F‐score, F = 0.357. The peptide is exclusively presented on glioblastoma multiforme (GBM) and healthy brain tissue while the gene is constitutively expressed with particularly low levels on brain (Figure 1A,B, Supporting Information).
Detection of the peptide SYNMp426 (RTFSphosPTYGL, O15061426‐434)[30] shown in Figure 3C,D is also not well predictable by gene expression (Figure 5B). Despite a high F score (F = 0.819), PMD alone is sufficient to result in similar high F scores (∆F = 0.009). The peptide is derived from synemin (SYNM) which is phosphorylated at Serine p429. The most straightforward explanation for the missing values not explained by synemin expression would be dephosphorylation of synemin. However, we also observed a strong negative association with the immunoproteasomal subunit LMP7 (Figure 1C, Supporting Information), which might indicate selective generation of the peptide in cells with decreased immunoproteasome activity. The proteasome is a key part of the class I antigen processing pathway. On Interferon γ stimulation, the proteasome exchanges subunits that form the immunoproteasome. For instance, β5 (PSMB5) is replaced by LMP7 (PSMB8), which alters the cleavage specificity and therefore ultimately the HLA ligandome composition. However, whether dephosphorylation or immunoproteasome upregulation is the cause for absence of the peptide, or if both are caused by an unknown third factor, cannot be inferred from the data. While the classifier could in general be extended to incorporate additional factors like immunoproteasome expression, one has to take care to avoid overfitting when the number of covariates in the model is increasing. In addition, further experimental validation is needed to understand the underlying mechanisms since they cannot be inferred from observational data only.
To perform a global assessment of classifier performance across many different peptide‐MHC targets, we investigated the distribution of F scores versus ∆F scores for a representative set of 1000 randomly selected peptides within a given bin of detection frequency. Figure 2, Supporting Information shows the distribution for peptides within the 10% bin which is representative for the application focus. We observed that one out of six peptides can be reliably predicted in their detection (F > 0.7) and shows relevant contribution of source gene expression (∆F > 0.1) at the same time. This set of peptides is suited for the development of single‐factor mRNA biomarkers relying only on the expression of the coding gene. For the other peptides, additional factors (e.g., immunoproteasome expression) or stratifications (source tissue) might need to be included to allow prediction of peptide presentation.
3.5. Translation to Clinical Use
Based on the established RNA‐Seq threshold, we estimated the prevalence for peptide positive tumor patients using RNA‐Seq data from the cancer genome atlas (TCGA, http://cancergenome.nih.gov/). These prevalence estimates help to approximate recruitment times as well as patient subgroups potentially benefiting from therapeutic interventions for a given target. The prevalence estimates might be based on the threshold itself or on the estimated confidence intervals. For example, the peptide ETNPPLp355 is expected to be present in more than 80% of all brain and liver cancer patients (Figure 3, Supporting Information) based on the RNA‐Seq threshold shown in Figure 5C (Gene expression ENSE00001081308 > 0.63 FPKM). Since ETNPPLp355 is also presented by healthy brain and liver, in line with high gene expression on these tissues,31 the peptide lacks tumor association, which makes it unsuitable as a target for cancer therapy.
For the development of companion diagnostics, the RNA‐Seq threshold was mapped to qPCR by establishing a standard curve. For 31 tumors with available RNA‐Seq data, qPCR measurements were acquired. Figure 1B shows a schematic correlation of RNA‐Seq data with qPCR data which allows to map the RNA‐Seq threshold in FPKM (red line) to a qPCR threshold in ∆Ct values (blue line). For every target of a target warehouse, a qPCR threshold needs to be established followed by validation of the corresponding assay. The first diagnostic test developed according to the described methods is IMADETECT™ incorporated as inclusion criterion within two phase I clinical trials (NCT02876510, NCT03247309) conducting adoptive cellular transfer. Within IMADETECT™, mRNA expression in patient biopsies was measured with qPCR. ∆Ct values meeting the predefined threshold criteria were used as predictive for target peptide presentation. Thus, the mass spectrometry defined gene expression thresholds allowed selection of targets from the warehouse to actively personalize cancer immunotherapy. This method can easily be applied to other datasets, yet since RNA‐Seq and qPCR values will not be comparable on an absolute scale, it will be necessary to reestablish thresholds and standard curves specific for that dataset.
4. Concluding Remarks
Mass spectrometry has enabled the in‐depth analysis of the human immunopeptidome which extends the space of available targets for immunotherapy. Here we show that mass spectrometry also allows for defining mRNA‐based predictive biomarkers that can be used as qPCR companion diagnostics in clinical studies to define peptide target positive populations thus establishing personalized peptidomics. Availability of these biomarkers allows improved treatment efficacy by implementing precision medicine for cancer immunotherapies. Assuming that T cells are still more sensitive in recognition of peptide‐HLA complexes than cutting‐edge mass spectrometry approaches, we consider the described thresholds as conservative. Most likely also patients with lower expression levels could be treated. The suggested threshold is a starting point for early clinical studies and needs to be validated and adjusted during clinical development. Beyond that, multiple targets can be combined to target warehouses allowing active personalization and minimize tumor evasion.
Abbreviations
- AML
acute myeloid leukemia
- BRCA
breast cancer
- CCC
cholangiocarcinoma
- CLL
chronic lymphocytic leukemia
- CRC
colorectal cancer
- FPKM
fragments per kilobase of exon per million reads
- GBC
gall bladder cancer
- GBM
glioblastoma multiforme
- GC
gastric cancer
- GEJC
gastro‐esophageal junction carcinoma
- HCC
hepatocellular carcinoma
- HLA
human leukocyte antigen
- HNSCC
head and neck squamous‐cell carcinoma
- MEL
melanoma
- NHL
non‐Hodgkin lymphoma
- NSCLC
non‐small‐cell lung carcinoma
- OC
ovarian cancer
- OSCAR
esophageal carcinoma
- PACA
pancreatic cancer
- PMD
peptidome measurement depth
- PRCA
prostate cancer
- qPCR
quantitative polymerase chain reaction
- RCC
renal cell carcinoma
- SCLC
small‐cell lung cancer
- TCGA
the Cancer Genome Atlas
- TUMAP
tumor‐associated peptide
- UBC
urinary bladder cancer
- UEC
uterine endometrial cancer
- XIC
extracted ion chromatogram
Conflict of Interest
All authors are employees of Immatics. T.W. is shareholder of Immatics Biotechnologies.
Supporting information
Supporting Information
Supporting Information
Supporting Information
Supporting Information
Acknowledgements
This work was supported by the Cancer Prevention Research Institute of Texas (DP150029). Thanks to the biobanking team at Immatics Germany for sample acquisition, the mass spec team for peptide analysis, and the CMC team for peptide synthesis. Thanks also to the Discovery lab team at Immatics US and Germany for preparation of tissues, DNA, RNA, and peptides.
Fritsche J., Rakitsch B., Hoffgaard F., Römer M., Schuster H., Kowalewski D. J., Priemer M., Stos‐Zweifel V., Hörzer H., Satelli A., Sonntag A., Goldfinger V., Song C., Mahr A., Ott M., Schoor O., Weinschenk T., Proteomics 2018, 18, 1700284 https://doi.org/10.1002/pmic.201700284
References
- 1. Falk K., Rotzschke O., Stevanovic S., Jung G., Rammensee H. G., Nature 1991, 351, 290. [DOI] [PubMed] [Google Scholar]
- 2. Lundegaard C., Lund O., Nielsen M., Bioinformatics 2008, 24, 1397. [DOI] [PubMed] [Google Scholar]
- 3. Rammensee H. G., Bachmann J., Emmerich N. P., Bachor O. A., Stevanovic S., Immunogenetics 1999, 50, 213. [DOI] [PubMed] [Google Scholar]
- 4. Abelin J. G., Keskin D. B., Sarkizova S., Hartigan C. R., Zhang W., Sidney J., Stevens J., Lane W., Zhang G. L., Eisenhaure T. M., Clauser K. R., Hacohen N., Rooney M. S., Carr S. A., Wu C. J., Immunity 2017, 46, 315. [DOI] [PMC free article] [PubMed] [Google Scholar]
- 5. Jurtz V., Paul S., Andreatta M., Marcatili P., Peters B., Nielsen M., J. Immunol. 2017, 199, 3360. [DOI] [PMC free article] [PubMed] [Google Scholar]
- 6. Bassani‐Sternberg M., Gfeller D., J. Immunol. 2016, 197, 2492. [DOI] [PubMed] [Google Scholar]
- 7. Altman D. G., Bland J. M., Br. Med. J. 1994, 309, 102.8038641 [Google Scholar]
- 8. Nat. Biotechnol. 2017, 35, 97. [DOI] [PubMed] [Google Scholar]
- 9. Gonzalez‐Galarza F. F., Takeshita L. Y., Santos E. J., Kempson F., Maia M. H., da Silva A. L., Teles e Silva A. L., Ghattaoraya G. S., Alfirevic A., Jones A. R., Middleton D., Nucleic Acids Res. 2015, 43, D784. [DOI] [PMC free article] [PubMed] [Google Scholar]
- 10. Verdegaal E. M. E., van der Burg S. H., Front. Immunol. 2017, 8, 1113. [DOI] [PMC free article] [PubMed] [Google Scholar]
- 11. Lawrence M. S., Stojanov P., Polak P., Kryukov G. V., Cibulskis K., Sivachenko A., Carter S. L., Stewart C., Mermel C. H., Roberts S. A., Kiezun A., Hammerman P. S., McKenna A., Drier Y., Zou L., Ramos A. H., Pugh T. J., Stransky N., Helman E., Kim J., Sougnez C., Ambrogio L., Nickerson E., Shefler E., Cortes M. L., Auclair D., Saksena G., Voet D., Noble M., DiCara D., Lin P., Lichtenstein L., Heiman D. I., Fennell T., Imielinski M., Hernandez B., Hodis E., Baca S., Dulak A. M., Lohr J., Landau D. A., Wu C. J., Melendez‐Zajgla J., Hidalgo‐Miranda A., Koren A., McCarroll S. A., Mora J., Lee R. S., Crompton B., Onofrio R., Parkin M., Winckler W., Ardlie K., Gabriel S. B., Roberts C. W., Biegel J. A., Stegmaier K., Bass A. J., Garraway L. A., Meyerson M., Golub T. R., Gordenin D. A., Sunyaev S., Lander E. S., Getz G., Nature 2013, 499, 214. [DOI] [PMC free article] [PubMed] [Google Scholar]
- 12. Britten C. M., Singh‐Jasuja H., Flamion B., Hoos A., Huber C., Kallen K. J., Khleif S. N., Kreiter S., Nielsen M., Rammensee H. G., Sahin U., Hinz T., Kalinke U., Nat. Biotechnol. 2013, 31, 880. [DOI] [PubMed] [Google Scholar]
- 13. Fortier M. H., Caron E., Hardy M. P., Voisin G., Lemieux S., Perreault C., Thibault P., J. Exp. Med. 2008, 205, 595. [DOI] [PMC free article] [PubMed] [Google Scholar]
- 14. Weinzierl A. O., Lemmel C., Schoor O., Muller M., Kruger T., Wernet D., Hennenlotter J., Stenzl A., Klingel K., Rammensee H. G., Stevanovic S., Mol. Cell Proteomics 2007, 6, 102. [DOI] [PubMed] [Google Scholar]
- 15. Quinlan A. R., Hall I. M., Bioinformatics 2010, 26, 841. [DOI] [PMC free article] [PubMed] [Google Scholar]
- 16. Anders S., Huber W., Genome Biol. 2010, 11, R106. [DOI] [PMC free article] [PubMed] [Google Scholar]
- 17. Weinschenk T., Fritsche J., Patent Application US9791443 B2.
- 18. Kim S., Pevzner P. A., Nat. Commun. 2014, 5, 5277. [DOI] [PMC free article] [PubMed] [Google Scholar]
- 19. Frank A. M., Bandeira N., Shen Z., Tanner S., Briggs S. P., Smith R. D., Pevzner P. A., J. Proteome Res. 2008, 7, 113. [DOI] [PMC free article] [PubMed] [Google Scholar]
- 20. Mueller L. N., Rinner O., Schmidt A., Letarte S., Bodenmiller B., Brusniak M. Y., Vitek O., Aebersold R., Muller M., Proteomics 2007, 7, 3470. [DOI] [PubMed] [Google Scholar]
- 21. Bielow C., Ruzek S., Huber C. G., Reinert K., J. Proteome Res. 2010, 9, 2688. [DOI] [PubMed] [Google Scholar]
- 22. Pedregosa F., Varoquaux G., Gramfort A., Michel V., Thirion B., Grisel O., Blondel M., Prettenhofer P., Weiss R., Dubourg V., Vanderplas J., Passos A., Cournapeau D., Brucher M., Perrot M., and Duchesnay E., J. Mach. Learn. Res. 2011, 12, 2825. [Google Scholar]
- 23. van der Walt C., Comput. Sci. Eng. 2011, 13, 22. [Google Scholar]
- 24. Team R Core, R Foundation for Statistical Computing, Vienna, Austria, 2014.
- 25. Weinschenk T., Gouttefangeas C., Schirle M., Obermayr F., Walter S., Schoor O., Kurek R., Loeser W., Bichler K. H., Wernet D., Stevanovic S., Rammensee H. G., Cancer Res. 2002, 62, 5818. [PubMed] [Google Scholar]
- 26. Anton L. C., Yewdell J. W., J. Leukoc. Biol. 2014, 95, 551. [DOI] [PMC free article] [PubMed] [Google Scholar]
- 27. Koussounadis A., Langdon S. P., Um I. H., Harrison D. J., Smith V. A., Sci. Rep. 2015, 5, 10775. [DOI] [PMC free article] [PubMed] [Google Scholar]
- 28. Sharma D. K., Bressler K., Patel H., Balasingam N., Thakor N., J. Nucleic Acids 2016, 2016, 8235121. [DOI] [PMC free article] [PubMed] [Google Scholar]
- 29. Leone P., Shin E. C., Perosa F., Vacca A., Dammacco F., Racanelli V., J. Natl. Cancer Inst. 2013, 105, 1172. [DOI] [PubMed] [Google Scholar]
- 30. Mohammed F., Cobbold M., Zarling A. L., Salim M., Barrett‐Wilt G. A., Shabanowitz J., Hunt D. F., Engelhard V. H., Willcox B. E., Nat. Immunol. 2008, 9, 1236. [DOI] [PMC free article] [PubMed] [Google Scholar]
- 31. Consortium G., Nat. Genet. 2013, 45, 580.23715323 [Google Scholar]
Associated Data
This section collects any data citations, data availability statements, or supplementary materials included in this article.
Supplementary Materials
Supporting Information
Supporting Information
Supporting Information
Supporting Information