

Abstract
Aims
To compare the efficacy and safety of adding the glucagon‐like peptide‐1 receptor agonist exenatide once weekly (QW) 2 mg or placebo among patients with type 2 diabetes who were inadequately controlled despite titrated insulin glargine (IG) ± metformin.
Methods
This multicentre, double‐blind study (http://clinicaltrials.gov identifier: NCT02229383) randomized (1:1) patients with persistent hyperglycaemia after an 8‐week titration phase (glycated haemoglobin [HbA1c] 7.0%‐10.5% [53‐91 mmol/mol]) to exenatide QW or placebo. The primary endpoint was HbA1c change from baseline to week 28. Secondary endpoints included body weight, 2‐hour postprandial glucose, and mean daily IG dose.
Results
Of 464 randomized patients (mean: age, 58 years; HbA1c, 8.5% [69 mmol/mol]; diabetes duration, 11.3 years), 91% completed 28 weeks. Exenatide QW + IG vs placebo + IG significantly reduced HbA1c (least‐squares mean difference, −0.73% [−8.0 mmol/mol]; 95% confidence interval, −0.93%, −0.53% [−10.2, −5.8 mmol/mol]; P < .001; final HbA1c, 7.55% [59 mmol/mol] and 8.24% [67 mmol/mol], respectively); body weight (−1.50 kg; −2.17, −0.84; P < .001); and 2‐hour postprandial glucose (−1.52 mmol/L [−27.5 mg/dL]; −2.15, −0.90 [−38.7, −16.2]; P < .001). Significantly more exenatide QW + IG‐treated patients vs placebo + IG‐treated patients reached HbA1c <7.0% (<53 mmol/mol) (32.5% vs 7.4%; P < .001); daily IG dose increased by 2 and 4 units, respectively. Gastrointestinal and injection‐site adverse events were more frequent with exenatide QW + IG (15.1% and 7.8%, respectively) than with placebo + IG (10.8% and 3.0%, respectively); hypoglycaemia incidence was similar between the exenatide QW + IG (29.7%) and placebo + IG (29.0%) groups, with no major hypoglycaemic events.
Conclusions
Among patients with inadequate glycaemic control, exenatide QW significantly improved glucose control and decreased body weight, without increased hypoglycaemia or unexpected safety findings.
Keywords: exenatide once weekly, glucagon‐like peptide‐1 receptor agonist, insulin glargine, type 2 diabetes
1. INTRODUCTION
Type 2 diabetes mellitus (T2DM) is characterized by progressive loss of pancreatic β‐cell insulin secretory function, with associated increases in hyperglycaemia and glucotoxicity.1, 2 Therefore, most patients with T2DM require multiple glucose‐lowering agents over time, preferably those with complementary mechanisms of action.3, 4 Recent guidelines recommend early use of basal insulin as an option for patients with poor glycaemic control with oral therapies.3, 4, 5
When glycaemic targets are not achieved with basal insulin, guidelines recommend uptitration of the basal insulin dose3, 4, 5 or, if unsuccessful, intensification with additional therapies, including a glucagon‐like peptide‐1 receptor agonist (GLP‐1RA),3, 4, 5 prandial insulin,3, 4, 5 sodium–glucose cotransporter‐2 inhibitor (SGLT2i),4, 5 or dipeptidyl peptidase‐4 inhibitor (DPP‐4i).4 Among injectable options, adding a GLP‐1RA to basal insulin therapy offers several advantages6, 7, 8, 9, 10, 11, 12 over progressive intensification with prandial insulin up to 3 times daily.13, 14, 15, 16, 17 GLP‐1RAs reduce hyperglycaemia through differing and complementary mechanisms to exogenous insulin; they stimulate endogenous insulin synthesis/secretion in a glucose‐dependent manner, inhibit glucagon secretion, increase satiety, reduce food intake, and some slow gastric emptying.2 GLP‐1RAs achieve glycated haemoglobin (HbA1c) reductions similar to or greater than those achieved with prandial insulin,18, 19 with the additional benefits of weight loss and low hypoglycaemia risk.
Among patients with inadequate glycaemic control despite basal insulin, real‐world data indicate that treatment is often not intensified, either by continued uptitration of basal insulin or by addition of prandial insulin.20, 21 The reasons are multifactorial, including concerns about hypoglycaemia and weight gain, requirement for frequent blood glucose self‐monitoring and clinic visits, and patient dislike of multiple daily injections. Adding exenatide, the first in class GLP‐1RA, twice daily (BID) improves glycaemic control without increased hypoglycaemia or weight gain among patients with uncontrolled T2DM receiving basal insulin.6 However, patients may wish to further reduce injection burden by adding a once‐weekly (QW) GLP‐1RA22, 23 or a fixed‐ratio basal insulin and GLP‐1RA combination.24, 25 Exenatide QW, which has good gastrointestinal tolerability,26 probably resulting from the gradual release of exenatide from biodegradable microspheres,27 has not been previously studied in combination with basal insulin.
This 28‐week study investigated the efficacy and safety of adding exenatide QW or placebo for patients with T2DM who were inadequately controlled despite titrated basal insulin (insulin glargine [IG]), with or without metformin.
2. MATERIALS AND METHODS
2.1. Study design and patients
DURATION‐7 was a phase 3, randomized, double‐blind, placebo‐controlled, parallel‐group study (http://clinicaltrials.gov identifier: NCT02229383) conducted at 126 centres in 6 countries (Hungary, Poland, Romania, Slovakia, South Africa and the USA) between September 2014 and August 2016. Eligible patients had T2DM and were ≥18 years of age and on a stable regimen comprising IG ≥20 units/d for ≥6 weeks, in combination with diet and exercise alone or with stable doses of metformin ≥1500 mg/d for >8 weeks ± a sulphonylurea. Additional inclusion criteria were HbA1c of 7.5% to 12.0% (59‐108 mmol/mol) and fasting plasma glucose (FPG) <15.6 mmol/L (<280 mg/dL) at screening, and HbA1c of 7.0% to 10.5% (53‐91 mmol/mol) at randomization. Complete inclusion and exclusion criteria are provided online in Table S1 in File S1.
The study included a screening visit, an 8‐week IG titration phase, a 28‐week double‐blind treatment phase, and a 10‐week safety follow‐up period (Figure S1 in File S1). Patients continued prior metformin use throughout the study, while sulphonylureas were discontinued at the start of IG titration, if applicable.
During both the IG titration and treatment periods, IG was titrated according to the Initiate Insulin by Aggressive Titration and Education (INITIATE) algorithm (FPG <4.0 mmol/L [<72 mg/dL], insulin dose change −2 units; FPG 4.0 to 5.5 mmol/L [72–99 mg/dL], dose unchanged; FPG 5.6 to 8.5 mmol/L [100‐153 mg/dL], +2 units; FPG >8.5 mmol/L [>153 mg/dL], +4 units [Table S2 in File S1]) to achieve an FPG of 4.0 to 5.5 mmol/L (72‐99 mg/dL) without hypoglycaemia.28 IG was administered at the same time each day, preferably at bedtime. Adjustments of the IG dose according to the INITIATE algorithm could occur during scheduled visits at weeks −8, −4 and −1 or between visits, either by the patient or the investigator, based on the average of 3 consecutive FPG measurements. Investigators could deviate from the algorithm based on their clinical judgment. Patients with an inclusive HbA1c of 7.0% to 10.5% (53‐91 mmol/mol) after the IG titration phase were eligible for randomization.
All patients provided written informed consent. The study protocol was approved by institutional review boards at each site. The study was conducted in accordance with the Declaration of Helsinki and Good Clinical Practice guidelines.
2.2. Randomization
Patients were randomized 1:1 to receive QW exenatide 2 mg or placebo injection in addition to their existing IG ± metformin regimen. Randomization was performed centrally via an interactive web system and stratified by screening HbA1c of <9.0% or ≥9.0% (<75 or ≥75 mmol/mol) and prior sulphonylurea use. To ensure blinding, patients, investigators, study‐site personnel and sponsor personnel did not have access to treatment codes or central laboratory FPG or HbA1c results for post‐randomization visits.
2.3. Procedures
Before administration of study drugs, patients (or caregivers) were instructed on product reconstitution and administration. Exenatide QW or matching placebo with microspheres (provided by the study sponsor) was self‐administered QW by subcutaneous injection in the abdomen, thigh or upper arm at any time of day, immediately after dose preparation, using a single‐dose syringe system. Stable metformin use was continued throughout the study for patients taking metformin at screening. During the study period, concomitant non–glucose‐lowering medications were allowed at the investigator's discretion. The IG dose was titrated using the INITIATE algorithm (Table S2 in File S1) during both the IG titration and treatment periods, with planned adjustments as necessary.
From week 12, patients with inadequate glycaemic control received open‐label rescue treatment with prandial insulin if FPG was >15, >13.3 or >11.1 mmol/L (>270, >240 or >200 mg/dL) during weeks 12 to 18, 18 to 24 or 24 to 28, respectively. Rescued patients remained in the study and continued receiving study medication.
A liquid meal tolerance test (MTT) was performed after >8‐hour fasting before visits at randomization and week 28 or at the early termination visit, using Ensure Plus (Abbott Nutrition, Abbott Park, Illinois) or regional equivalent. Study medication was administered after (randomization) or before the MTT (week 28 or early termination visit).
Participants kept a study diary and recorded daily blood glucose measurements, insulin use and hypoglycaemic episodes. Each visit included counselling on diet/exercise, review of study diaries and review of compliance by examining returned unused study medication.
2.4. Study endpoints
The primary endpoint was change in HbA1c from baseline to week 28. Secondary endpoints included change in body weight from baseline to week 28; change in 2‐hour postprandial glucose (PPG) after the MTT at week 28; proportion of patients with HbA1c <7.0% (<53 mmol/mol) at week 28; change in total mean daily IG dose from baseline to week 28; proportion of patients with HbA1c <7.0% (<53 mmol/mol) at week 28, with no body weight gain at week 28 and no major hypoglycaemia over the 28‐week treatment period; and change in systolic blood pressure (SBP) from baseline at week 28.
Exploratory endpoints included changes in HbA1c and FPG at each visit between baseline and week 28; change from baseline to week 28 in FPG, waist circumference, diastolic blood pressure (DBP) and fasting lipids (total, low‐density lipoprotein, high‐density lipoprotein [HDL] and non‐HDL cholesterol, and triglycerides); and patient‐reported outcome measures including the Diabetes Treatment Satisfaction Questionnaire, status version (DTSQ‐s)29 and the Study to Help Improve Early Evaluation and Management of Risk Factors Leading to Diabetes Weight Questionnaire‐9 (SHIELD‐WQ‐9)30 (Table S3 in File S1). All reported outcome measures were prespecified, unless otherwise noted in Table 2.
Table 2.
Primary, secondary and exploratory efficacy endpoints of interest in the intention‐to‐treat population
| Endpoint | Exenatide QW + IG (n = 231) | Placebo + IG (n = 230) | (Exenatide QW + IG) − (placebo + IG) |
|---|---|---|---|
| Glycaemic control | |||
| HbA1c, % [mmol/mol]a | |||
| Baseline, mean ± SD | 8.51 ± 0.92 [70 ± 10.1] | 8.50 ± 0.90 [69 ± 9.8] | |
| Week 28, mean ± SD | 7.55 ± 1.20 [59 ± 13.1] | 8.24 ± 1.10 [67 ± 12.0] | |
| Change, LSM ± SE (95% CI) | −0.96 ± 0.08 (−1.11, −0.80) | −0.23 ± 0.08 (−0.38, −0.07) | −0.73 (−0.93, −0.53); P < .001 |
| [−10.5 ± 0.9 (−12.1, −8.7)] | [−2.5 ± 0.9 (−4.2, −0.8)] | [−8.0 (−10.2, −5.8)] | |
| Proportion of patients achieving HbA1c <7.0% (<53 mmol/mol)b | |||
| Number achieving goal (%) [95% CI] | 75 (32.5) [26.4, 38.5] | 17 (7.4) [4.0, 10.8] | 25.1; P < .001 |
| FPG, mmol/L [mg/dL]a | |||
| Baseline, mean ± SD | 8.22 ± 3.12 [148.1 ± 56.2] | 7.99 ± 2.52 [143.8 ± 45.4] | |
| Week 28, mean ± SD | 7.43 ± 2.58 [133.8 ± 46.4] | 7.87 ± 2.67 [141.6 ± 48.1] | |
| Change, LSM ± SE (95% CI) | −0.66 ± 0.19 (−1.04, −0.28) | −0.13 ± 0.19 (−0.51, +0.25) | −0.53 (−0.99, −0.06); P = .028c |
| [−11.9 ± 3.5 (−18.7, −5.0)] | [−2.4 ± 3.5 (−9.2, +4.4)] | [−9.5 (−17.9, −1.0)] | |
| 2‐hour PPG, mmol/L [mg/dL]d | |||
| Baseline, mean ± SD | 13.06 ± 3.49 [235.1 ± 62.8] | 12.97 ± 3.55 [233.5 ± 64.0] | |
| Week 28, mean ± SD | 11.27 ± 3.69 [202.8 ± 66.3] | 12.72 ± 3.52 [228.9 ± 63.3] | |
| Change, LSM ± SE (95% CI) | −1.58 ± 0.32 (−2.21, −0.96) | −0.06 ± 0.32 (−0.69, +0.58) | −1.52 (−2.15, −0.90); P < .001 |
| [−28.5 ± 5.7 (−39.8, −17.3)] | [−1.1 ± 5.8 (−12.5, +10.4)] | [−27.5 (−38.7, −16.2)] | |
| IG dose, units/da | |||
| Baseline, mean ± SD | 50.4 ± 21.5 | 51.0 ± 24.4 | |
| Week 28, mean ± SD | 51.9 ± 24.3 | 54.2 ± 26.9 | |
| Change, LSM ± SE (95% CI) | +1.6 ± 0.8 (+0.1, +3.1) | +3.6 ± 0.8 (+2.0, +5.1) | −2.0 (−4.1, +0.1); P = .068 |
| Weight and composite measures | |||
| Body weight, kga | |||
| Baseline, mean ± SD | 94.15 ± 20.23 | 94.13 ± 19.53 | |
| Week 28, mean ± SD | 93.06 ± 19.97 | 94.53 ± 19.95 | |
| Change, LSM ± SE (95% CI) | −1.04 ± 0.26 (−1.54, −0.54) | +0.46 ± 0.25 (−0.03, +0.96) | −1.50 (−2.17, −0.84); P < .001 |
| Proportion of patients with ≥5% body weight lossb | |||
| Number achieving goal (%) [95% CI] | 24 (10.4) [6.5, 14.3] | 8 (3.5) [1.1, 5.9] | 6.9; P = .004‡ |
| Waist circumference, cm | |||
| Baseline, mean ± SD | 113.5 ± 18.9 | 114.6 ± 19.5 | |
| Week 28, mean ± SD | 113.0 ± 18.6 | 112.1 ± 17.3 | |
| Change, LSM ± SE (95% CI)d | −0.04 ± 1.6 (−3.02, +2.95) | −1.42 ± 1.5 (−4.43, +1.59) | 1.38 (−1.57, +4.33); P = .359c |
| Proportion of patients achieving HbA1c <7.0% (<53 mmol/mol) with no body weight gain at week 28 or major hypoglycaemia over 28 weeksb , e | |||
| Number achieving goal (%) [95% CI] | 51 (22.1) [16.7, 27.4] | 6 (2.6) [0.6, 4.7] | 19.5; P < .001c |
| Cardiovascular risk factors | |||
| SBP, mm Hgf | |||
| Baseline, mean ± SD | 132.8 ± 13.5 | 132.6 ± 13.2 | |
| Week 28, mean ± SD | 130.9 ± 14.4 | 132.6 ± 12.9 | |
| Change, LSM ± SE (95% CI) | −2.6 ± 0.9 (−4.4, −0.7) | −0.7 ± 0.9 (−2.6, +1.1) | −1.8 (−4.0, +0.4); P = .105c |
| DBP, mm Hga | |||
| Baseline, mean ± SD | 76.6 ± 8.7 | 78.1 ± 8.4 | |
| Week 28, mean ± SD | 77.4 ± 8.6 | 78.0 ± 8.4 | |
| Change, LSM ± SE (95% CI) | +0.5 ± 0.6 (−0.6, +1.7) | +0.4 ± 0.6 (−0.8, +1.5) | +0.2 (−1.2, +1.6); P = .781c |
| Total cholesterol, mmol/Ld | |||
| Baseline, mean ± SD | 4.57 ± 0.96 | 4.38 ± 1.10 | |
| Week 28, mean ± SD | 4.58 ± 1.08 | 4.48 ± 1.16 | |
| Change, LSM ± SE (95% CI) | 0.00 ± 0.08 (−0.16, +0.16) | +0.05 ± 0.08 (−0.11, +0.22) | −0.05 (−0.21, +0.11); P = .521c |
| LDL cholesterol, mmol/Ld | |||
| Baseline, mean ± SD | 2.52 ± 0.86 | 2.34 ± 0.94 | |
| Week 28, mean ± SD | 2.50 ± 0.92 | 2.40 ± 0.97 | |
| Change, LSM ± SE (95% CI) | −0.04 ± 0.07 (−0.17, +0.09) | 0.00 ± 0.07 (−0.13, +0.14) | −0.05 (−0.18, +0.10); P = .497c |
| HDL cholesterol, mmol/Ld | |||
| Baseline, mean ± SD | 1.24 ± 0.33 | 1.25 ± 0.33 | |
| Week 28, mean ± SD | 1.17 ± 0.30 | 1.21 ± 0.32 | |
| Change, LSM ± SE (95% CI) | −0.06 ± 0.02 (−0.09, −0.02) | −0.02 ± 0.02 (−0.06, +0.02) | −0.04 (−0.07, 0.00); P = .031c |
| Non‐HDL cholesterol, mmol/Ld | |||
| Baseline, mean ± SD | 3.33 ± 0.92 | 3.13 ± 1.05 | |
| Week 28, mean ± SD | 3.40 ± 1.08 | 3.27 ± 1.12 | |
| Change, LSM ± SE (95% CI) | +0.06 ± 0.08 (−0.10, +0.22) | +0.08 ± 0.08 (−0.09, +0.24) | −0.02 (−0.17, +0.14); P = .845c |
| Triglycerides, mmol/Ld , g | |||
| Baseline, mean ± SD | 1.59 ± 0.06 | 1.55 ± 0.05 | |
| Week 28, mean ± SD | 1.74 ± 0.07 | 1.68 ± 0.06 | |
| Ratio, geometric LSM ± SE (95% CI) | +1.10 ± 0.04 (+1.03, +1.18) | +1.09 ± 0.04 (+1.01, +1.17) | +1.01 (−0.94, +1.09); P = .699c |
Abbreviations: CI, confidence interval; DBP, diastolic blood pressure; FPG, fasting plasma glucose; HbA1c, glycated haemoglobin; HDL, high‐density lipoprotein; IG, insulin glargine; LDL, low‐density lipoprotein; LSM, least‐squares mean; MMRM, mixed‐effects model for repeated measures; PPG, postprandial glucose; QW, once weekly; SBP, systolic blood pressure; SD, standard deviation; SE, standard error.
To convert cholesterol values from mmol/L to mg/dL, multiply by 38.67; to convert triglycerides from mmol/L to mg/dL, multiply by 88.57.
Geometric mean or geometric LSM was calculated by exponentiating the mean or LSM value.
MMRM analysis excluding measurements after initiation of rescue therapy or after premature discontinuation of study treatment.
Cochran–Mantel–Haenszel analysis; missing data treated as non‐responder.
Nominal P value.
Analysis of covariance excluding measurements after initiation of rescue therapy or after premature discontinuation of study treatment.
A secondary endpoint. Not significant because of the testing hierarchy.
MMRM analysis including measurements after initiation of rescue therapy and excluding measurements after premature discontinuation of study treatment.
The analysis of covariance model used log‐transformed triglyceride values. The reported effect estimates were converted back to the original scale.
Safety endpoints included the incidence, duration and time course of all spontaneously reported adverse events (AEs), including hypoglycaemic episodes (protocol‐defined classifications of major [event resulting in loss of consciousness, seizure or coma, which resolved after administration of glucagon or glucose, or that required third‐party assistance and was associated with glucose <3.0 mmol/L (<54 mg/dL)], minor [non‐major event with glucose <3.0 mmol/L (<54 mg/dL)], or other [event not meeting criteria for a major or minor event] [Table S4 in File S1]) and vital signs including heart rate (measured as seated pulse). Clinical laboratory assessments included routine chemistry and haematology measures, urinalysis, serum calcitonin, serum creatinine, calculated creatinine clearance (Cockcroft‐Gault formula) and anti‐exenatide antibodies. Predefined cardiovascular AEs were adjudicated by an adjudication committee of independent cardiologists blinded to study treatment (Table S5 in File S1). For all study endpoints, change from baseline was calculated from the last non‐missing assessment before the first dose of study drug at randomization.
2.5. Statistical analyses
Primary and secondary efficacy variables were analysed in the intention‐to‐treat (ITT) population, defined as all randomized patients who received ≥1 dose of study drug with ≥1 post‐baseline HbA1c assessment. The primary endpoint was assessed using a mixed‐effects model for repeated measures (MMRM), with change in HbA1c as the dependent variable; treatment, region, baseline HbA1c stratum (<9.0% or ≥9.0% [<75 or ≥75 mmol/mol]), baseline sulphonylurea‐use stratum, week, and treatment‐by‐week interaction as fixed factors; and baseline HbA1c as a continuous covariate. An unstructured covariance structure was used to model within‐patient errors. Secondary and exploratory endpoints were analysed using MMRM analyses or analysis of covariance (continuous variables) or a Cochran–Mantel–Haenszel test stratified by baseline HbA1c stratum and sulphonylurea‐use stratum (categorical variables). All efficacy analyses, with the exception of SBP, excluded measurements after rescue therapy initiation or after premature discontinuation of study treatment; SBP analyses included measurements after rescue therapy initiation and excluded measurements after premature discontinuation of study treatment.
Safety data were assessed in the safety analysis set, defined as all randomized patients who received ≥1 dose of study drug, and were summarized descriptively with all AEs coded using the Medical Dictionary for Regulatory Activities version 19.0.
Sample size was calculated from previous studies of exenatide QW, estimating an HbA1c reduction of −0.35% (−3.8 mmol/mol) for exenatide QW vs placebo. To detect this difference with a standard deviation (SD) of 1.1% (12.0 mmol/mol), 209 participants per group were required for 90% power at a 2‐sided significance level of 0.05 (see Supplementary Methods online for full description, File S1).
Hypothesis testing of primary and secondary efficacy endpoints followed a serial gatekeeping procedure to control for family‐wise type I error rate (see Supplementary Methods online for a full description of testing sequence, File S1). Superiority of exenatide QW vs placebo was required at a 2‐sided significance level of P < .05 for sequential testing to proceed. Once a hypothesis test failed, no statistical significance could be claimed and P values were nominal for the remaining endpoints in the sequence. Nominal P values were reported for exploratory endpoints and were not adjusted for multiplicity. Statistical analyses were performed using SAS version 9.2 (SAS Institute, Inc., Cary, North Carolina).
3. RESULTS
3.1. Study population
Of 808 patients screened, 511 entered the 8‐week IG titration phase (Figure 1). After the IG titration phase, 464 patients were randomized to treatment. Overall, 231 and 230 patients randomized to receive exenatide QW and placebo, respectively, met ITT criteria and were analysed for efficacy. The safety analysis set comprised 232 and 231 patients receiving exenatide QW and placebo, respectively. Study completion rates were similar between groups (exenatide QW, 91.4%; placebo, 90.0%) (Figure 1).
Figure 1.
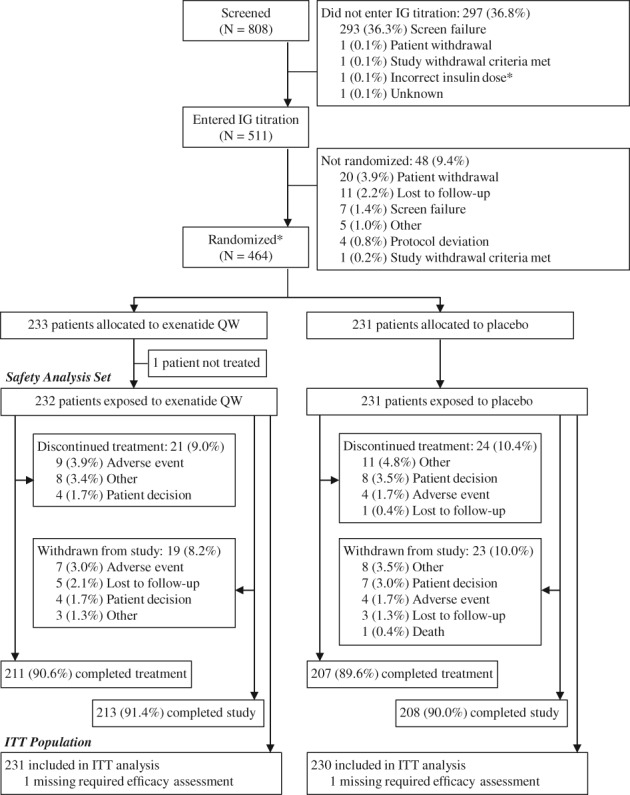
Patient disposition and study flow. *One patient did not enter the IG titration phase as the patient was not using the IG dose necessary to be eligible for randomization; however, the patient was randomized and approved to continue in the study. Abbreviations: IG, insulin glargine; ITT, intention‐to‐treat; QW, once weekly
Demographics and baseline characteristics were similar between treatment groups (Table 1). Before study entry, in addition to insulin, most patients were treated with either metformin alone (51.6%) or metformin and a sulphonylurea (31.0%), with the remainder receiving a sulphonylurea alone (3.9%) or no additional glucose‐lowering therapy (13.4%) (Table 1).
Table 1.
Demographic and baseline characteristics in the intention‐to‐treat population
| Characteristic | Exenatide QW + IG (n = 231) | Placebo + IG (n = 230) | Total (N = 461) |
|---|---|---|---|
| Age, years | 57.8 ± 9.0 | 57.6 ± 10.3 | 57.7 ± 9.7 |
| Age ≥65 years | 50 (21.6) | 58 (25.2) | 108 (23.4) |
| Male | 114 (49.4) | 107 (46.5) | 221 (47.9) |
| Race | |||
| White | 205 (88.7) | 196 (85.2) | 401 (87.0) |
| Black | 19 (8.2) | 28 (12.2) | 47 (10.2) |
| Asian | 4 (1.7) | 2 (0.9) | 6 (1.3) |
| Other | 3 (1.3) | 4 (1.7) | 7 (1.5) |
| Hispanic ethnicity | 65 (28.1) | 65 (28.3) | 130 (28.2) |
| Body weight, kg | 93.3 ± 20.0 | 94.7 ± 19.8 | 94.0 ± 19.9 |
| BMI, kg/m2 | 33.3 ± 6.1 | 34.1 ± 6.6 | 33.7 ± 6.4 |
| BMI group | |||
| <25 kg/m2 | 12 (5.2) | 10 (4.3) | 22 (4.8) |
| ≥25 to <30 kg/m2 | 61 (26.4) | 54 (23.5) | 115 (24.9) |
| ≥30 kg/m2 | 157 (68.0) | 166 (72.2) | 323 (70.1) |
| HbA1c at screening, % [mmol/mol] | 9.09 ± 1.08 | 9.08 ± 1.11 | 9.09 ± 1.09 |
| [76 ± 11.8] | [76 ± 12.1] | [76 ± 11.9] | |
| HbA1c at baseline, % [mmol/mol] | 8.53 ± 0.91 | 8.53 ± 0.92 | 8.53 ± 0.91 |
| [70 ± 9.9] | [70 ± 10.1] | [70 ± 9.9] | |
| HbA1c group | |||
| <8.0% [<64 mmol/mol] | 71 (30.7) | 76 (33.0) | 147 (31.9) |
| ≥8.0% to <9.0% [≥64 to <75 mmol/mol] | 86 (37.2) | 73 (31.7) | 159 (34.5) |
| ≥9.0% [≥75 mmol/mol] | 74 (32.0) | 81 (35.2) | 155 (33.6) |
| Duration of diabetes, years | 11.5 ± 6.6 | 11.1 ± 6.1 | 11.3 ± 6.3 |
| FPG, mmol/L [mg/dL] | 8.2 ± 3.1 | 8.1 ± 2.6 | 8.2 ± 2.9 |
| [147.6 ± 56.4] | [146.6 ± 47.3] | [147.1 ± 52.0] | |
| Noninsulin glucose‐lowering medications, pre‐randomization | |||
| Metformin alone | 121 (52.4) | 117 (50.9) | 238 (51.6) |
| Prior SU alone | 8 (3.5) | 10 (4.3) | 18 (3.9) |
| Metformin + prior SU | 73 (31.6) | 70 (30.4) | 143 (31.0) |
| None | 29 (12.6) | 33 (14.3) | 62 (13.4) |
| IG dose, units/d | 50.1 ± 21.4 | 52.0 ± 25.0 | 51.1 ± 23.3 |
| eGFR, mL/min/1.73 m2 a | 90.7 ± 17.8 | 91.1 ± 19.2 | 90.9 ± 18.5 |
Abbreviations: BMI, body mass index; eGFR, estimated glomerular filtration rate; FPG, fasting plasma glucose; HbA1c, glycated haemoglobin; IG, insulin glargine; QW, once weekly; SU, sulphonylurea.
Data are mean ± standard deviation or n (%).
eGFR was calculated using the Chronic Kidney Disease Epidemiology Collaboration equation.
Treatment compliance was high across groups, with 92.7% and 93.9% of exenatide QW‐treated patients and placebo‐treated patients, respectively, using 80% to <120% of the dispensed study medication.
3.2. Efficacy
3.2.1. Glycaemic control
At screening, mean HbA1c, FPG and daily IG dose were similar between treatment groups (Table S6 in File S1). During the IG titration phase, the mean daily IG dose increased from 39 to 50 units/d in the group subsequently randomized to exenatide QW and from 39 to 52 units/d in the group subsequently randomized to placebo; FPG decreased from 10.0 to 8.2 mmol/L (179.8‐147.5 mg/dL) and from 9.8 to 8.1 mmol/L (176.8‐146.5 mg/dL), respectively; and HbA1c decreased from 9.1% to 8.5% (76‐70 mmol/mol) in both groups (Table S6 in File S1).
After randomization, exenatide QW was associated with a significantly greater HbA1c reduction from baseline to week 28 vs placebo (least‐squares mean [LSM] difference, −0.73% [−8.0 mmol/mol]; 95% confidence interval [CI], −0.93% to −0.53% [−10.2 to −5.8 mmol/mol]; P < .001; final HbA1c, 7.55% [59 mmol/mol] and 8.24% [67 mmol/mol], respectively) (Table 2). A significant between‐group difference was observed at week 4 and was maintained over the treatment period (Table 2, Figure 2A). Significantly more exenatide QW‐treated patients vs placebo‐treated patients achieved HbA1c <7.0% (<53 mmol/mol) (32.5% vs 7.4%, respectively; P < .001) (Table 2, Figure 2B).
Figure 2.
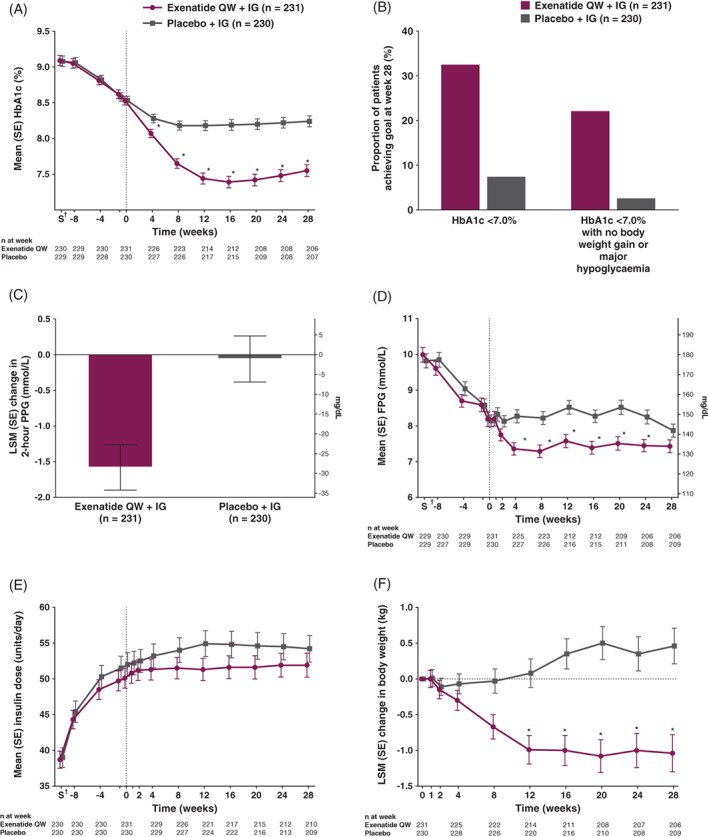
A, Mean HbA1c from screening to week 28. B, Proportion of patients achieving HbA1c <7.0% (<53 mmol/mol) and HbA1c <7.0% (<53 mmol/mol) without body weight gain at week 28 and without hypoglycaemia over 28 weeks. C, LSM change in 2‐hour PPG from baseline to week 28. D, Mean FPG from screening to week 28. E, Mean insulin dose from screening to week 28. F, LSM change in body weight from screening to week 28. *Nominal P < .001 based on mixed‐effects model for repeated measures analysis of change from baseline, including treatment, region, baseline HbA1c stratum (<9.0% or ≥9.0% [<75 or ≥75 mmol/mol]), baseline sulphonylurea use stratum, week and treatment‐by‐week interaction as fixed factors and baseline value as a covariate. †Screening visit (S) was a minimum of 7 days and a maximum of 14 days before the week −8 visit. Values for HbA1c, FPG and IG dose are observed values at each time point. Error bars show mean ± SE. These analyses exclude measurements after initiation of rescue therapy or after premature discontinuation of study treatment. To convert 2‐hour PPG or FPG from mmol/L to mg/dL, multiply by 18. Abbreviations: FPG, fasting plasma glucose; HbA1c, glycated haemoglobin; IG, insulin glargine; LSM, least‐squares mean; PPG, postprandial glucose; QW, once weekly; SE, standard error
Reductions in 2‐hour PPG after an MTT were significantly greater with exenatide QW vs placebo (LSM difference, −1.52 mmol/L [−27.5 mg/dL]; 95% CI, −2.15 to −0.90 mmol/L [−38.7 to −16.2 mg/dL]; P < .001; final 2‐hour PPG, 11.27 mmol/L [202.8 mg/dL] and 12.72 mmol/L [228.9 mg/dL], respectively) (Table 2, Figure 2C).
Exenatide QW also reduced FPG vs placebo (LSM difference, −0.53 mmol/L [−9.5 mg/dL]; 95% CI, −0.99 to −0.06 mmol/L [−17.9 to −1.0 mg/dL]; nominal P = .028; final FPG, 7.43 mmol/L [133.8 mg/dL] and 7.87 mmol/L [141.6 mg/dL], respectively) (Table 2, Figure 2D). FPG reductions were apparent from week 2 (Figure 2D) and were maintained over the 28‐week treatment period. At week 28, exenatide QW was associated with a numerically larger decrease in mean 6‐point self‐monitored blood glucose vs placebo at all points, with the exception of before breakfast (Figure S2 in File S1).
No significant difference was observed between groups for change in daily IG dose from baseline to week 28 (LSM difference, −2.0 units; 95% CI, −4.1 to +0.1; nominal P = .068) (Table 2). In both groups, there was a small increase from baseline in the daily IG dose up to week 2, followed by stabilization through week 28 (Figure 2E).
Use of rescue therapy did not differ between the exenatide QW and placebo groups (5 [2.2%] vs 4 [1.7%] patients, respectively; nominal P = .739) during the treatment period.
3.2.2. Weight and other efficacy endpoints
Patients receiving exenatide QW had significantly greater reductions in body weight from baseline to week 28 compared with those receiving placebo (LSM difference, −1.50 kg; 95% CI, −2.17 to −0.84; P < .001) (Table 2, Figure 2F). Reductions in body weight were apparent from week 8 (Figure 2F) and were maintained over the 28‐week treatment period. A greater proportion of patients achieved ≥5% body weight loss with exenatide QW than with placebo (6.9 percentage point difference; nominal P = .004) (Table 2). More patients receiving exenatide QW vs placebo achieved HbA1c <7.0% (<53 mmol/mol) with no body weight gain and no major hypoglycaemia over the 28‐week treatment period (22.1% vs 2.6%, respectively; no hypothesis testing was performed because of the prespecified hierarchical testing sequence; nominal P < .001) (Table 2, Figure 2B). No significant differences were observed between exenatide QW and placebo for change from baseline to week 28 in waist circumference, DBP or fasting lipids (Table 2). There was a small numeric decrease with exenatide QW (−2.6 mm Hg) vs placebo (−0.7 mm Hg) in SBP (difference, −1.8 mm Hg; nominal P = .105).
3.2.3. Patient‐reported outcomes
Patients in both treatment groups reported improved treatment satisfaction as assessed by DTSQ‐s total score; the improvement was greater with exenatide QW (Table S7 in File S1). At week 28, a numerically greater proportion of patients receiving exenatide QW vs placebo reported weight loss and improvement in all 9 areas assessed by the SHIELD‐WQ‐9 (Table S7 in File S1).
3.3. Safety and tolerability
Exenatide QW, in combination with titrated IG, was associated with no unexpected safety findings (Table 3).
Table 3.
AEs in the safety analysis set
| AEs, n (%) | Exenatide QW + IG (n = 232) | Placebo + IG (n = 231) |
|---|---|---|
| Any AE | 125 (53.9) | 133 (57.6) |
| Any SAE | 11 (4.7) | 11 (4.8) |
| AEs leading to study withdrawal | 7 (3.0) | 5 (2.2) |
| SAEs leading to study withdrawal | 1 (0.4) | 1 (0.4) |
| Deaths | 0 (0.0) | 1 (0.4) |
| AEs occurring in ≥5% of patients in either treatment group | ||
| Urinary tract infection | 18 (7.8) | 15 (6.5) |
| Nausea | 12 (5.2) | 9 (3.9) |
| Increased blood creatine phosphokinase | 5 (2.2) | 13 (5.6) |
| Injection‐site nodule | 12 (5.2) | 1 (0.4) |
| AEs of special interest | ||
| Hypoglycaemiaa | ||
| Major | 0 (0.0) | 0 (0.0) |
| Minor | 13 (5.6) | 13 (5.6) |
| Other | 68 (29.3) | 64 (27.7) |
| Confirmed, adjudicated cardiovascular events | 0 (0.0) | 3 (1.3) |
| Pancreatitis | 1 (0.4) | 0 (0.0) |
| Acute renal failure‐related | 1 (0.4) | 0 (0.0) |
| Neoplasm‐related | 4 (1.7) | 2 (0.9) |
| Seborrheic keratosis | 2 (0.9) | 0 (0.0) |
| Adrenal adenoma | 0 (0.0) | 1 (0.4) |
| Angiomyolipoma | 1 (0.4) | 0 (0.0) |
| Benign oesophageal neoplasm | 0 (0.0) | 1 (0.4) |
| Squamous cell carcinoma | 1 (0.4) | 0 (0.0) |
| Injection‐site–related | 18 (7.8) | 7 (3.0) |
| Nodule | 12 (5.2) | 1 (0.4) |
| Pruritus | 4 (1.7) | 3 (1.3) |
| Erythema | 3 (1.3) | 0 (0.0) |
| Bruising | 2 (0.9) | 0 (0.0) |
| Induration | 1 (0.4) | 1 (0.4) |
| Swelling | 2 (0.9) | 0 (0.0) |
| Cellulitis | 1 (0.4) | 0 (0.0) |
| Hematoma | 0 (0.0) | 1 (0.4) |
| Haemorrhage | 0 (0.0) | 1 (0.4) |
| Inflammation | 1 (0.4) | 0 (0.0) |
| Gastrointestinal disorders | 35 (15.1) | 25 (10.8) |
| Nausea | 12 (5.2) | 9 (3.9) |
| Diarrhoea | 11 (4.7) | 8 (3.5) |
| Constipation | 2 (0.9) | 4 (1.7) |
| Dyspepsia | 5 (2.2) | 0 (0.0) |
| Abdominal discomfort | 2 (0.9) | 2 (0.9) |
| Flatulence | 1 (0.4) | 3 (1.3) |
| Vomiting | 1 (0.4) | 3 (1.3) |
| Abdominal distension | 1 (0.4) | 1 (0.4) |
| Abdominal mass | 2 (0.9) | 0 (0.0) |
| Abdominal pain upper | 2 (0.9) | 1 (0.4) |
| Eructation | 2 (0.9) | 0 (0.0) |
| Gastritis | 1 (0.4) | 1 (0.4) |
| Gastroesophageal reflux disease | 2 (0.9) | 0 (0.0) |
| Abdominal pain | 1 (0.4) | 0 (0.0) |
| Dental caries | 0 (0.0) | 1 (0.4) |
| Duodenal ulcer | 1 (0.4) | 0 (0.0) |
| Epigastric discomfort | 0 (0.0) | 1 (0.4) |
| Gastric polyps | 0 (0.0) | 1 (0.4) |
| Gastric ulcer | 1 (0.4) | 0 (0.0) |
| Gastrointestinal angiodysplasia | 1 (0.4) | 0 (0.0) |
| Haemorrhoids | 1 (0.4) | 0 (0.0) |
| Inguinal hernia | 1 (0.4) | 0 (0.0) |
| Large intestine polyp | 1 (0.4) | 0 (0.0) |
| Esophagitis | 1 (0.4) | 0 (0.0) |
| Pancreatitis chronic | 1 (0.4) | 0 (0.0) |
| Tooth disorder | 0 (0.0) | 1 (0.4) |
| Clinical laboratory parameters | ||
| Creatine phosphokinase, increased | 5 (2.2) | 13 (5.6) |
| γ‐glutamyltransferase, increased | 2 (0.9) | 4 (1.7) |
| Alanine aminotransferase, increased | 2 (0.9) | 1 (0.4) |
| Lipase, increased | 1 (0.4) | 2 (0.9) |
| Hepatic enzyme, increased | 2 (0.9) | 0 (0.0) |
| Aspartate aminotransferase, increased | 0 (0.0) | 2 (0.9) |
| Glucose urine present | 0 (0.0) | 2 (0.9) |
| Uric acid, increased | 0 (0.0) | 2 (0.9) |
| Magnesium, decreased | 1 (0.4) | 0 (0.0) |
| Potassium, increased | 1 (0.4) | 0 (0.0) |
| Alkaline phosphatase, increased | 0 (0.0) | 1 (0.4) |
| Amylase, increased | 0 (0.0) | 1 (0.4) |
| Urea, increased | 0 (0.0) | 1 (0.4) |
Abbreviations: AE, adverse event; IG, insulin glargine; QW, once weekly; SAE, serious adverse event.
Definitions of hypoglycaemia: major, loss of consciousness, seizure or coma resolving after glucagon or glucose administration or any event that required third‐party assistance to resolve because of severe impairment in consciousness or behaviour, with glucose <3.0 mmol/L (<54 mg/dL); minor, any non‐major event with symptoms consistent with hypoglycaemia and glucose <3.0 mmol/L (<54 mg/dL); other, any event not meeting the criteria for a major or minor event.
No major hypoglycaemic events were reported in either treatment group (Table 3). Minor and “other” hypoglycaemic events, respectively, were observed in 5.6% and 29.3% of patients receiving exenatide QW and 5.6% and 27.7% of patients receiving placebo.
The most commonly reported AEs, other than hypoglycaemia, with exenatide QW vs placebo were urinary tract infection, nausea, diarrhoea and injection‐site nodules (Table 3). Serious AEs were reported in 4.7% and 4.8% of patients receiving exenatide QW and placebo, respectively. One patient receiving placebo died in the context of a severe pulmonary infection (specific cause of death unknown), and no deaths were reported in the exenatide QW group.
More exenatide QW‐treated patients reported gastrointestinal AEs than patients receiving placebo (Table 3). Injection‐site–related AEs, none of which were severe, were reported by more patients receiving exenatide QW than placebo. One exenatide QW‐treated patient with a history of chronic pancreatitis experienced an AE of chronic pancreatitis. One acute kidney injury and 4 neoplasms (1 squamous cell carcinoma and 3 benign) were reported with exenatide QW. Two benign neoplasms occurred with placebo.
More patients receiving exenatide QW discontinued treatment because of an AE (n = 9 [3.9%], of which 4 [1.7%] were gastrointestinal and 1 [0.4%] was an injection‐site nodule) than patients receiving placebo (n = 4 [1.7%], of which 1 [0.4%] was gastrointestinal).
Heart rate increased from baseline to week 28 with exenatide QW (mean change, 2.5 bpm) but remained unchanged in the placebo group (0.2 bpm).
From baseline to week 28, mean estimated glomerular filtration rate (calculated using the Chronic Kidney Disease Epidemiology Collaboration equation) decreased slightly in both groups (mean [SD] change, −2.3 [10.9] and −0.6 [9.6] mL/min/1.73 m2 with exenatide QW and placebo, respectively). No meaningful changes were observed for other laboratory parameters (Table S8 in File S1).
Most exenatide QW‐treated patients (76.0%) developed anti‐exenatide antibodies at some point over the study period (Table S9 in File S1). Clinically relevant HbA1c reductions occurred regardless of antibody positivity/titre. Injection‐site–related AEs were more common among patients with anti‐exenatide antibodies (7.3% vs 0.4% with negative antibody status), with most occurrences in the low‐positive titre group.
4. DISCUSSION
For patients with T2DM who were inadequately controlled despite basal insulin ± metformin, treatment options include uptitration of the basal insulin dose or, if unsuccessful, the addition of another injectable or oral (SGLT2i4, 5 or DPP‐4i4) drug.3, 4, 5 Injectable additions include a BID, once‐daily (QD), or QW GLP‐1RA or prandial insulin (starting QD and increasing progressively to 3 times a day).3, 4, 5 The clinical benefits of adding a QW GLP‐1RA (similar or better glycaemic control, weight loss and fewer hypoglycaemic episodes vs prandial insulin) to basal insulin make this combination an attractive option.18, 19
In the current study, exenatide QW + IG was well tolerated, significantly improved a range of glycaemic measures, and reduced body weight vs placebo + IG. These improvements were observed without unexpected safety findings or increased hypoglycaemia vs placebo.
In the DURATION‐7 study, injection‐site–related AEs occurred in both the exenatide QW + IG and placebo + IG groups. Other sustained‐release injectable drug formulations requiring in vivo degradation are also associated with injection‐site reactions,31 which might explain the occurrence of these reactions in both treatment groups, as both exenatide QW and placebo injections contained microspheres. However, the greater frequency of injection‐site–related AEs with exenatide‐containing microspheres compared with placebo‐containing microspheres observed in both the DURATION‐7 and DURATION‐8 studies,32 especially among those with positive anti‐exenatide antibody status, suggests that, for exenatide QW, both in vivo degradation of microspheres and immune responses to exenatide contribute.
This study adds to evidence supporting the addition of a GLP‐1RA for patients with inadequate glycaemic control despite basal insulin.3 Previous studies with the short‐acting GLP‐1RA exenatide BID added to basal insulin6, 8 demonstrated glycaemic improvements, body weight loss and a low hypoglycaemia risk, as have studies with the QD GLP‐1RAs lixisenatide7, 9, 10 and liraglutide added to basal insulin.11 Furthermore, fixed‐ratio combinations of IG plus lixisenatide (iGlarLixi) and insulin degludec plus liraglutide (IDegLira) significantly decrease HbA1c and body weight, compared with their respective basal insulin monocomponents, without increasing hypoglycaemia risk.24, 25 Fixed‐ratio combinations may not be suitable for patients requiring greater doses of basal insulin.
To date, 2 other studies (HARMONY‐6 and AWARD‐9) have investigated the efficacy and safety of combining a QW GLP‐1RA with titrated basal IG22, 23; however, caution is needed when making between‐study comparisons because of the differences in study designs and populations. Consistent with the DURATION‐7 study, adding a QW GLP‐1RA to basal insulin resulted in significant improvements in glycaemic control and weight loss in both studies.
The HARMONY‐6 study comprised a 4‐ to 8‐week IG dose standardization/titration period, followed by a 52‐week treatment period.22 Despite recommendations of IG titration algorithms from both the HARMONY‐6 and DURATION‐7 studies, these were not consistently implemented in practice, as the mean IG dose increased only modestly after randomization in both groups (by 6‐7 units at 26 weeks in HARMONY‐622 and 2‐4 units in DURATION‐7).
The AWARD‐923 study compared the addition of QW dulaglutide 1.5 mg or placebo to IG in patients with HbA1c of 7.0 to 10.5% (53‐91 mmol/mol).23 In the DURATION‐7 study, patients were randomized after IG titration had failed to lower HbA1c below 7.0% (53 mmol/mol) following an increase in mean insulin doses from screening to baseline of 39 to ~51 units, whereas IG dose titration began after randomization in the AWARD‐9 study, thus maximizing the combined glucose‐lowering actions of IG and dulaglutide.
While the DURATION‐7, HARMONY‐6 and AWARD‐9 studies reported reduced glycaemia and body weight among GLP‐1RA‐treated patients, gastrointestinal AEs were higher with GLP‐1RA treatment in all 3 studies.22, 23 In DURATION‐7, nausea, diarrhoea and vomiting occurred in 5.2%, 4.7% and 0.4% of exenatide QW‐treated patients and 3.9%, 3.5% and 1.3% of placebo‐treated patients, respectively. In HARMONY‐6, nausea, diarrhoea and vomiting occurred in 11.2%, 13.0% and 6.7% of albiglutide‐treated patients and 1.4%, 4.3% and 1.4% of lispro‐treated patients, respectively.22 In AWARD‐9, these AEs occurred in 12.0%, 11.3% and 6.0% of dulaglutide‐treated patients and 1.3%, 4.0% and 0.0% of placebo‐treated patients, respectively.23
The DURATION‐7 study has some limitations. Notably, IG titration was not strictly adhered to after randomization in all patients, despite FPG values being above those specified in the INITIATE titration algorithm (4.0‐5.5 mmol/L [72‐99 mg/dL]).28 Suboptimal titration was shown by smaller‐than‐expected increases in the IG dose, especially with placebo, despite elevated FPG levels. Had IG titration been more aggressive, the relative difference in the IG dose with exenatide QW vs placebo would be expected to have been larger. Although results across studies are not directly comparable, HbA1c reduction in the DURATION‐7 study was similar to that in a separate study evaluating exenatide BID added to titrated IG,6 whereas, in the DURATION‐5 study, HbA1c reduction was significantly greater with exenatide QW vs exenatide BID.33 This seemingly inconsistent finding regarding the glycaemic efficacy of exenatide QW vs BID is probably explained by suboptimal IG titration in the DURATION‐7 study vs the exenatide BID + IG study (mean IG difference, 2 vs 7 units,6 respectively) and by differences in study design (lack of an IG titration phase before randomization in the exenatide BID + IG study).6
A similar suboptimal IG titration was observed in the HARMONY‐6 study,22 but also in other studies using various basal insulins.34, 35 This probably reflects real‐world clinical practice, where clinical inertia and concern about body weight gain and increased hypoglycaemia with insulin uptitration may result in physician/patient reluctance to adhere to strict algorithms.20, 21
In summary, in patients with T2DM who were inadequately controlled despite titrated IG ± metformin, adding exenatide QW improved glycaemic measures and reduced body weight without major hypoglycaemia or unexpected safety findings. This suggests that exenatide QW represents a well‐tolerated treatment‐intensification option for patients with uncontrolled basal insulin‐treated T2DM.
Supporting information
File S1. Supporting information.
ACKNOWLEDGMENTS
The authors would like to acknowledge the patients, study investigators and study coordinators for their essential contributions to the study. A complete list of investigators is given online in File S1.
Elizabeth Strickland and Simone Boniface of inScience Communications, Springer Healthcare (Philadelphia, Pennsylvania) provided medical writing support, which was funded by AstraZeneca. Mary Beth DeYoung, PhD, of AstraZeneca provided critical review.
Parts of this study were presented at the 77th Scientific Sessions of the American Diabetes Association (ADA), June 9–13, 2017, San Diego, California and at the 53rd European Association for the Study of Diabetes (EASD) Annual Meeting, September 11–15, 2017, Lisbon, Portugal.
Conflict of interest
C. G. served as the international coordinating investigator in the trial discussed in this paper, and has participated in scientific advisory boards of and has received consulting fees from Alfa Wasserman, AstraZeneca, Bayer AG, Berlin‐Chemie Mennarini, Eli Lilly, Merck Sharp & Dohme, Novo Nordisk and Sanofi. J. P. F. has received research support from AbbVie, AstraZeneca, Boehringer Ingelheim, Bristol‐Myers Squibb, Eli Lilly, IONIS, Janssen, Johnson and Johnson, Ligand, Merck, Mylan, Novartis, Novo Nordisk, Pfizer, Sanofi, Theracos and vTv Therapeutics, and has participated in scientific advisory boards of and has received consulting fees from AstraZeneca, Bristol‐Myers Squibb, Novo Nordisk, Sanofi and Theracos. A. S. has no conflicts of interest to report. S. J. has received consulting fees from AstraZeneca, Eli Lilly and Janssen. H. W. is a consultant for AstraZeneca. E. H. is an employee of and stockholder in AstraZeneca. J. R. has received research support from AstraZeneca, Boehringer Ingelheim, Bristol‐Myers Squibb, Daiichi Sankyo, Eli Lilly, GlaxoSmithKline, Hanmi, Intarcia, Janssen, Lexicon, Merck, Novo Nordisk, Pfizer and Sanofi, and has served on advisory boards of or received consulting honoraria from AstraZeneca, Boehringer Ingelheim, Daiichi Sankyo, Eli Lilly, Intarcia, Janssen, Novo Nordisk and Sanofi.
Author contributions
C. G. contributed to study design and conduct, approved the report, participated in the acquisition and interpretation of data, and provided critical revisions to the manuscript. J. P. F., A. S., S. J. and J. R. participated in the acquisition and interpretation of data and provided critical revisions to the manuscript. H. W. participated in the analysis and interpretation of data and provided critical revisions to the manuscript. E. H. participated in monitoring data collection, analysis and interpretation and provided critical revisions to the manuscript. E. H. is the guarantor of this work and, as such, had full access to all data in the study and takes responsibility for the integrity of the data and the accuracy of the data analysis.
Guja C, Frías JP, Somogyi A, et al. Effect of exenatide QW or placebo, both added to titrated insulin glargine, in uncontrolled type 2 diabetes: The DURATION‐7 randomized study. Diabetes Obes Metab. 2018;20:1602–1614. https://doi.org/10.1111/dom.13266
Funding information The study was supported by AstraZeneca. Exenatide QW is a proprietary compound of AstraZeneca.
REFERENCES
- 1. American Diabetes Association . Standards of medical care in diabetes—2017: Classification and diagnosis of diabetes. Diabetes Care. 2017;40(suppl 1):S11‐S24. [DOI] [PubMed] [Google Scholar]
- 2. Grandy S, Shaunik A, Hardy E. Effects of glucagon‐like peptide‐1 receptor agonists on beta‐cell function in patients with type 2 diabetes. J Diabetes Metab. 2016;7:643. [Google Scholar]
- 3. American Diabetes Association . Standards of medical care in diabetes—2017: Pharmacologic approaches to glycemic treatment. Diabetes Care. 2017;40(suppl 1):S64‐S74. [DOI] [PubMed] [Google Scholar]
- 4. Garber AJ, Abrahamson MJ, Barzilay JI, et al. Consensus statement by the American Association of Clinical Endocrinologists and American College of Endocrinology on the comprehensive type 2 diabetes management algorithm—2017 executive summary. Endocr Pract. 2017;23:207‐238. [DOI] [PubMed] [Google Scholar]
- 5. Inzucchi SE, Bergenstal RM, Buse JB, et al. Management of hyperglycemia in type 2 diabetes, 2015: a patient‐centered approach: update to a position statement of the American Diabetes Association and the European Association for the Study of Diabetes. Diabetes Care. 2015;38:140‐149. [DOI] [PubMed] [Google Scholar]
- 6. Buse JB, Bergenstal RM, Glass LC, et al. Use of twice‐daily exenatide in basal insulin‐treated patients with type 2 diabetes: a randomized, controlled trial. Ann Intern Med. 2011;154:103‐112. [DOI] [PubMed] [Google Scholar]
- 7. Rosenstock J, Guerci B, Hanefeld M, et al. Prandial options to advance basal insulin glargine therapy: testing lixisenatide plus basal insulin versus insulin glulisine either as basal‐plus or basal‐bolus in type 2 diabetes: the GetGoal Duo‐2 trial. Diabetes Care. 2016;39:1318‐1328. [DOI] [PubMed] [Google Scholar]
- 8. Diamant M, Nauck MA, Shaginian R, et al. Glucagon‐like peptide 1 receptor agonist or bolus insulin with optimized basal insulin in type 2 diabetes. Diabetes Care. 2014;37:2763‐2773. [DOI] [PubMed] [Google Scholar]
- 9. Riddle MC, Aronson R, Home P, et al. Adding once‐daily lixisenatide for type 2 diabetes inadequately controlled by established basal insulin: a 24‐week, randomized, placebo‐controlled comparison (GetGoal‐L). Diabetes Care. 2013;36:2489‐2496. [DOI] [PMC free article] [PubMed] [Google Scholar]
- 10. Riddle MC, Forst T, Aronson R, et al. Adding once‐daily lixisenatide for type 2 diabetes inadequately controlled with newly initiated and continuously titrated basal insulin glargine: a 24‐week, randomized, placebo‐controlled study (GetGoal‐Duo 1). Diabetes Care. 2013;36:2497‐2503. [DOI] [PMC free article] [PubMed] [Google Scholar]
- 11. Li CJ, Li J, Zhang QM, et al. Efficacy and safety comparison between liraglutide as add‐on therapy to insulin and insulin dose‐increase in Chinese subjects with poorly controlled type 2 diabetes and abdominal obesity. Cardiovasc Diabetol. 2012;11:142. [DOI] [PMC free article] [PubMed] [Google Scholar]
- 12. de Wit HM, Vervoort GM, Jansen HJ, de Grauw WJ, de Galan BE, Tack CJ. Liraglutide reverses pronounced insulin‐associated weight gain, improves glycaemic control and decreases insulin dose in patients with type 2 diabetes: a 26 week, randomised clinical trial (ELEGANT). Diabetologia. 2014;57:1812‐1819. [DOI] [PubMed] [Google Scholar]
- 13. Wang C, Mamza J, Idris I. Biphasic vs basal bolus insulin regimen in type 2 diabetes: a systematic review and meta‐analysis of randomized controlled trials. Diabet Med. 2015;32:585‐594. [DOI] [PubMed] [Google Scholar]
- 14. Lankisch MR, Ferlinz KC, Leahy JL, Scherbaum WA. Introducing a simplified approach to insulin therapy in type 2 diabetes: a comparison of two single‐dose regimens of insulin glulisine plus insulin glargine and oral antidiabetic drugs. Diabetes Obes Metab. 2008;10:1178‐1185. [DOI] [PubMed] [Google Scholar]
- 15. Bergenstal RM, Johnson M, Powers MA, et al. Adjust to target in type 2 diabetes: comparison of a simple algorithm with carbohydrate counting for adjustment of mealtime insulin glulisine. Diabetes Care. 2008;31:1305‐1310. [DOI] [PMC free article] [PubMed] [Google Scholar]
- 16. Owens DR, Luzio SD, Sert‐Langeron C, Riddle MC. Effects of initiation and titration of a single pre‐prandial dose of insulin glulisine while continuing titrated insulin glargine in type 2 diabetes: a 6‐month ‘proof‐of‐concept’ study. Diabetes Obes Metab. 2011;13:1020‐1027. [DOI] [PMC free article] [PubMed] [Google Scholar]
- 17. Edelman SV, Liu R, Johnson J, Glass LC. AUTONOMY: the first randomized trial comparing two patient‐driven approaches to initiate and titrate prandial insulin lispro in type 2 diabetes. Diabetes Care. 2014;37:2132‐2140. [DOI] [PubMed] [Google Scholar]
- 18. Eng C, Kramer CK, Zinman B, Retnakaran R. Glucagon‐like peptide‐1 receptor agonist and basal insulin combination treatment for the management of type 2 diabetes: a systematic review and meta‐analysis. Lancet. 2014;384:2228‐2234. [DOI] [PubMed] [Google Scholar]
- 19. Maiorino MI, Chiodini P, Bellastella G, Capuano A, Esposito K, Giugliano D. Insulin and glucagon‐like peptide 1 receptor agonist combination therapy in type 2 diabetes: a systematic review and meta‐analysis of randomized controlled trials. Diabetes Care. 2017;40:614‐624. [DOI] [PubMed] [Google Scholar]
- 20. Khunti K, Nikolajsen A, Thorsted BL, Andersen M, Davies MJ, Paul SK. Clinical inertia with regard to intensifying therapy in people with type 2 diabetes treated with basal insulin. Diabetes Obes Metab. 2016;18:401‐409. [DOI] [PMC free article] [PubMed] [Google Scholar]
- 21. Dalal MR, Grabner M, Bonine N, Stephenson JJ, DiGenio A, Bieszk N. Are patients on basal insulin attaining glycemic targets? Characteristics and goal achievement of patients with type 2 diabetes mellitus treated with basal insulin and physician‐perceived barriers to achieving glycemic targets. Diabetes Res Clin Pract. 2016;121:17‐26. [DOI] [PubMed] [Google Scholar]
- 22. Rosenstock J, Fonseca VA, Gross JL, et al. Advancing basal insulin replacement in type 2 diabetes inadequately controlled with insulin glargine plus oral agents: a comparison of adding albiglutide, a weekly GLP‐1 receptor agonist, versus thrice‐daily prandial insulin lispro. Diabetes Care. 2014;37:2317‐2325. [DOI] [PubMed] [Google Scholar]
- 23. Pozzilli P, Norwood P, Jodar E, et al. Placebo‐controlled, randomized trial of the addition of once‐weekly glucagon‐like peptide‐1 receptor agonist dulaglutide to titrated daily insulin glargine in patients with type 2 diabetes (AWARD‐9). Diabetes Obes Metab. 2017;19:1024‐1031. [DOI] [PubMed] [Google Scholar]
- 24. Aroda VR, Rosenstock J, Wysham C, et al. Efficacy and safety of LixiLan, a titratable fixed‐ratio combination of insulin glargine plus lixisenatide in type 2 diabetes inadequately controlled on basal insulin and metformin: the LixiLan‐L randomized trial. Diabetes Care. 2016;39:1972‐1980. [DOI] [PubMed] [Google Scholar]
- 25. Buse JB, Vilsbøll T, Thurman J, et al. Contribution of liraglutide in the fixed‐ratio combination of insulin degludec and liraglutide (IDegLira). Diabetes Care. 2014;37:2926‐2933. [DOI] [PubMed] [Google Scholar]
- 26. Horowitz M, Aroda VR, Han J, Hardy E, Rayner CK. Upper and/or lower gastrointestinal adverse events with GLP‐1 receptor agonists: incidence and consequences. Diabetes Obes Metab. 2017;19:672‐681. [DOI] [PMC free article] [PubMed] [Google Scholar]
- 27. DeYoung MB, MacConell L, Sarin V, Trautmann M, Herbert P. Encapsulation of exenatide in poly‐(D,L‐lactide‐co‐glycolide) microspheres produced an investigational long‐acting once‐weekly formulation for type 2 diabetes. Diabetes Technol Ther. 2011;13:1145‐1154. [DOI] [PMC free article] [PubMed] [Google Scholar]
- 28. Yki‐Järvinen H, Juurinen L, Alvarsson M, et al. Initiate Insulin by Aggressive Titration and Education (INITIATE): a randomized study to compare initiation of insulin combination therapy in type 2 diabetic patients individually and in groups. Diabetes Care. 2007;30:1364‐1369. [DOI] [PubMed] [Google Scholar]
- 29. Bradley C. Diabetes Treatment Satisfaction Questionnaire (DTSQ) In: Bradley C, ed. Handbook of Psychology and Diabetes: A Guide to Psychological Measurement in Diabetes Research and Practice. Chur, Switzerland: Harwood Academic Publishers; 1994:111‐132. [Google Scholar]
- 30. Grandy S, Fox KM, Bazata DD. Association of self‐reported weight change and quality of life, and exercise and weight management behaviors among adults with type 2 diabetes mellitus: the SHIELD study. Cardiol Res Pract. 2012;2012:892564. [DOI] [PMC free article] [PubMed] [Google Scholar]
- 31. Johnson BA. Naltrexone long‐acting formulation in the treatment of alcohol dependence. Ther Clin Risk Manag. 2007;3:741‐749. [PMC free article] [PubMed] [Google Scholar]
- 32. Frías JP, Guja C, Hardy E, et al. Exenatide once weekly plus dapagliflozin once daily versus exenatide or dapagliflozin alone in patients with type 2 diabetes inadequately controlled with metformin monotherapy (DURATION‐8): a 28 week, multicentre, double‐blind, phase 3, randomised controlled trial. Lancet Diabetes Endocrinol. 2016;4:1004‐1016. [DOI] [PubMed] [Google Scholar]
- 33. Blevins T, Pullman J, Malloy J, et al. DURATION‐5: exenatide once weekly resulted in greater improvements in glycemic control compared with exenatide twice daily in patients with type 2 diabetes. J Clin Endocrinol Metab. 2011;96:1301‐1310. [DOI] [PubMed] [Google Scholar]
- 34. Kennedy L, Herman WH, Strange P, Harris A. Impact of active versus usual algorithmic titration of basal insulin and point‐of‐care versus laboratory measurement of HbA1c on glycemic control in patients with type 2 diabetes: the Glycemic Optimization with Algorithms and Labs at Point of Care (GOAL A1C) trial. Diabetes Care. 2006;29:1‐8. [DOI] [PubMed] [Google Scholar]
- 35. Meneghini L, Koenen C, Weng W, Selam JL. The usage of a simplified self‐titration dosing guideline (303 Algorithm) for insulin detemir in patients with type 2 diabetes—results of the randomized, controlled PREDICTIVE 303 study. Diabetes Obes Metab. 2007;9:902‐913. [DOI] [PubMed] [Google Scholar]
Associated Data
This section collects any data citations, data availability statements, or supplementary materials included in this article.
Supplementary Materials
File S1. Supporting information.