

Abstract
Research on decision‐making styles has shown that stylistic differences matter for real‐life outcomes, but less research has explored how styles relate to other differences between individuals. Heeding a call for a more systematic and theoretically sound understanding of decision‐making styles, we investigated the relation between decision‐making styles and specific aspects of social orientation and approach to time in two samples (students, n = 118, and police investigators, n = 90). The results of regression analyses showed that decision‐making styles are related to specific differences in social orientation and time approach. Furthermore, results of structural equation model analyses suggested possible adjustments to the proposed two‐factor model for decision‐making styles (Dewberry, Juanchich, & Narendran, 2013a). © 2017 The Authors Journal of Behavioral Decision Making Published by John Wiley & Sons Ltd.
Keywords: decision‐making styles, social orientation, time approach, procrastination
Decision making is fundamental for people and affects most aspects of life. Research has begun to explore differences between individuals relating to both efficient and successful decision making, including obtaining better decision outcomes such as reaching positive social objectives. This research has used two conceptualizations, decision‐making competence (i.e., skills and abilities needed or useful for good decision‐making processes as defined and measured in terms of accuracy and consistency, henceforth decision competence) and decision‐making styles (i.e., preferred and habitual approaches to, and handling of, decision making, henceforth decision styles). Measures of both decision competence and decision styles have been found to be related to various indicators of real‐life decision‐making success (Bruine de Bruin, Parker, & Fischhoff, 2007; Dewberry, Juanchich, & Narendran, 2013b; Wood & Highhouse, 2014). Although measures of decision competence relate to measures of decision styles (Bavol'ár & Orosová, 2015; Parker, Bruine de Bruin, & Fischhoff, 2007), each conceptualization explains separate parts of the variance in decision‐making success (Bruine de Bruin et al., 2007).
In line with the view proposed by Strough, Parker, and Bruine de Bruin (2015), we see decision making as a contextually embedded process. Thus, decision making relates to the immediate context (e.g., the decision topic, intentions of other people, and time constraints) and the sociocultural context. Additionally, people's decision making is, in general, influenced by individual differences in for example age and personality. Whereas previous research has noticed this issue by exploring how decision competence relates to variations in individuals' orientations to the social context and time (Geisler & Allwood, 2015; Strough, Schlosnagle, Karns, Lemaster, & Pichayayothin, 2014), similar research for decision styles is limited and needs to be improved (Appelt, Milch, Handgraaf, & Weber, 2011). The present study contributes by investigating if and how variability in specific aspects of social orientation and time approach relate to decision styles.
In general, differences in social orientation – that is, how one relates to and is tuned in to other people – are likely to influence a person's preferred way of approaching decision making (i.e., decision style) because everyday decisions occur in social life (Tetlock, 1985). Supportive of this, successful decision making has been reported to depend on the ability to interpret other people's emotional reactions and intentions (Rilling & Sanfey, 2011; Telle, Senior, & Butler, 2011).
Likewise, differences in time approach – that is, how time is perceived and managed – influence a person's decision making (Loewenstein, Read, & Baumeister, 2003; Wittmann & Paulus, 2008). Time approach may affect the preparation for, or start of, decision processes, how much time one spends on decision making, and how well decisions are integrated with one's own and other people's agendas. For instance, it has been reported that a controlled and/or future‐oriented approach to time relates to successful decision making, whereas impulsive and/or postponing tendencies often are less constructive (Loewenstein et al., 2003).
Decision Styles
Decision styles refer to ‘stable trait‐like patterns of approach to situations that call for a decision’ (Leykin & DeRubeis, 2010, p. 506). Different measures of decision styles exist, and the styles tend to overlap, but a few unique styles have been identified (e.g., Leykin & DeRubeis, 2010; Mann, Burnett, Radford, & Ford, 1997; Scott & Bruce, 1995). The present research uses the General Decision‐Making Style Scale (GDMS: Scott & Bruce, 1995), which aspires to catch most of the variation in people's approach to decision making. The GDMS largely assesses styles that reoccur in other measures and is widely used as well as both reliable and valid (Curşeu & Schruijer, 2012; Loo, 2000).
Scott and Bruce defined decision style as ‘the learned, habitual response pattern exhibited by an individual when confronted with a decision situation’ (1995, p. 820) and assumed that individuals are not characterized by a single style but by a profile of styles. The GDMS includes five styles, rational (extensive information collection and systematic evaluation of alternatives), intuitive (attention to details and to rely on hunches and emotions), spontaneous (make decisions on impulse), avoidant (avoid making decisions), and dependent (seek advice and support of others or let others decide).
The styles in the GDMS have been related to various aspects associated to decision making. Overall, the rational and the intuitive styles have been reported as most constructive, associated with better outcomes and more efficient decision making, whereas the avoidant, dependent, and the spontaneous styles have been related to more maladaptive behavior and negative outcomes (Allwood & Salo, 2012; Bruine de Bruin et al., 2007).
Decision Styles and Differences in Aspects of Social Orientation and Time Approach
Previous work has studied the relationship between decision styles and aspects of social orientation (Di Fabio & Kenny, 2012) and time perspective (Carelli, Wiberg, & Wiberg, 2011). However, this research only studied a few aspects of these relationships or did not have them as the primary concern. Consequently, the nature of these relationships is still unclear. Moreover, social orientation and time approach have been reported to be connected in various ways. For example, social orientation is affected by a person's temporal horizon (see e.g., Strough et al., 2014). Furthermore, time approach and social orientation may have a bidirectional relation (Holman & Zimbardo, 2009).
Social orientation and decision‐making styles
Variability in aspects of social orientation can be expected to relate to decision styles. One example is people's variation in self‐monitoring, that is, their sensitivity to social cues and ability to modify self‐presentation accordingly. We expected differences in self‐monitoring to be associated with decision styles as self‐monitoring has been related to decision‐related achievements in personal (Vohs, Baumeister, & Ciarocco, 2005) and working‐life settings (Day, Schleicher, Unckless, & Hiller, 2002), as well as the ability to accurately recognize when it is appropriate to consult others (Flynn, Reagans, Amantullah, & Ames, 2006).
In contrast, Machiavellian personality captures aspects of a maladaptive social orientation observed to be related to egoistic biases in decision making, for example, being distrustful of others and willingness to stray from moral standards (Dahling, Whitaker, & Levy, 2009). We expected that people high in Machiavellianism would report higher use of the two less socially constructive decision styles—the avoidant and the spontaneous styles. Relations between self‐monitoring and decision styles were investigated in Studies 1 and 2 and relations between Machiavellianism and decision styles in Study 1.
Furthermore, differences in emotional intelligence, that is, disposition and ability to process emotion‐laden information in both self and others, have been suggested to be relevant for understanding the emotion—decision‐making relationship (Sevdalis, Petrides, & Harvey, 2007; Telle et al., 2011). Di Fabio and Kenny (2012) found that emotionally intelligent individuals reported more use of the rational style and less use of the avoidant, dependent, and spontaneous styles. However, as Di Fabio and Kenny investigated the relation between emotional intelligence and decision styles in a high‐school student sample (age 16–19 years), the generality of their findings is unclear. We investigated the relation between emotional intelligence and decision styles in an older (age 24–65 years) and more experienced sample (Study 2).
Time‐approach and decision‐making styles
Decision making is influenced by how individuals approach time (Wittmann & Paulus, 2008). Carelli et al. (2011) briefly explored how decision styles relate to time approach (as conceptualized by the Zimbardo Time‐Perspective Inventory; Zimbardo & Boyd, 1999). They reported that people who have a positive view of the future gave higher reports of the rational style, whereas people with a negative view of the future or of the past reported higher use of the avoidant and dependent styles. A present‐orientation was found to be positively related to the intuitive and spontaneous styles. These results are intriguing, but other definitions of time approach are also relevant for decision making. Contrary to the existential conceptualization of the Zimbardo Time‐Perspective Inventory (i.e., a past negative time perspective—due to unfortunate experiences), the Time‐Style Scale (Usunier & Vallette‐Florence, 2007) assesses time orientation related to decision making more comprehensively. For instance, the Time‐Style Scale targets the extent that time is perceived as a resource that needs to be structured (preference for economic time), or not (preference for nonorganized time), and the extent that one is persistent in the usage of time (tenacity vs. preference for quick return).
A further aspect of time approach relevant for decision making is variability in procrastination, that is, in the tendency to use time resources by postponing the start or completion of tasks (e.g., decisions) that need to be done (Lay, 1986). Although the reasons for why people procrastinate can differ, procrastination reflects an approach to time that generally relates to poor performance and negative outcomes (Steel, 2007).
Explaining Differences in Decision‐Making Styles
The theoretical understanding of differences in decision styles is still unclear (Appelt et al., 2011; Mohammed & Schwall, 2009). However, Dewberry et al. (2013a) proposed a two‐component model for understanding latent differences in styles, and reported support for the hypothesis that differences depend on a combination of the cognitive processes used to make decisions (core processes, i.e., how information is processed, referring to the rational, intuitive, and spontaneous styles) and processes concerned with the regulation of choice (regulating processes, i.e., when and if decisions are made, referring to the avoidant and dependent styles). Dewberry et al. (2013a) further argued that the avoidant style reflects decision‐related anxiety, and that the dependent style relates to the avoidant style by being a strategy used when individuals realize that a decision must be made. The structural model proposed by Dewberry et al. contributes to the understanding of variability in decision styles but needs to be tested in other samples. In the present research, we further explored the proposed two‐component model.
The Present Research
The aim and main focus of the present study were to investigate how specific aspects of variability in social orientation and time‐approach relate to decision styles. To probe for generalizability, relationships were examined in two different samples and decision contexts: university students (Study 1) and professionals (Study 2).
Our hypotheses concerned expectations regarding how certain aspects of social orientation and time approach would relate to specific decision styles. Due to the strategic, thorough, and careful nature of the rational decision style, we expected that people who reported higher preference for the economic and tenacious time styles would also report higher on the rational style (Hypothesis 1). Given the rather carefree and impulsive nature of the spontaneous style, we expected that people with higher reports on the Machiavellian personality dimension – amorally manipulative, and on the two time styles preference for nonorganized time and preference for quick return, would also report higher on the spontaneous style (Hypothesis 2). Because the avoidant style is characterized by decision‐withdrawal, a relationship between tendencies indicative of withdrawal from social life and the avoidant style was hypothesized. Thus, we expected that people who reported higher on the Machiavellian personality dimension (distrust of others) but lower on emotional intelligence would also give higher reports on the avoidant style. Additionally, we expected that people who gave higher reports on procrastination and the time style preference for nonorganized time, orientation toward the past, and time anxiety would also give higher reports on the avoidant style (Hypothesis 3). Furthermore, as the dependent style is indicative of both social dependence and individual unease, we expected that people who gave lower reports on self‐monitoring and emotional intelligence but higher reports on the two time‐style time submissiveness, time anxiety, and on procrastination would also report higher on the dependent style (Hypothesis 4). These hypotheses were tested by means of regression analyses. To counteract a continued differentiation in the research field (e.g., Appelt et al., 2011), we also, finally, by means of structural equation modeling, tested and further explored the two‐component model proposed by Dewberry et al. (2013a).
Study 1
Method
Participants
In total, 118 university students from three Swedish universities participated (85% women, age range 20–45 years, mean age = 26 years, SD age = 4.8). The participants were informed about the study at lectures or by email and invited to participate. Efforts were made to include students from different specializations. Thus, the final sample included students from educational specializations such as clinical psychology (29%), single subject courses in psychology (24%), ‘other’ (e.g., medicine, chemistry, and environmental science; 18%), social work (8%), economy (7%), teacher education (8%), and public administration (6%). The participants were compensated with a movie ticket and a lottery ticket.
Procedure
The participants completed the following scales in the order mentioned below. The order of the items on each scale was randomized in terms of subscale affiliation but not randomized between participants. Scales were presented in a Web‐based questionnaire. Due to an error, one item on the time‐style preference for nonorganized time was not included in the Web questionnaire. The participants gave their informed consent and then completed the scales individually during monitored test sessions in a large computer room.
Measures
General Decision‐Making Style Inventory (Scott & Bruce, 1995)
The 25 items on the GDMS are rated on 5‐point Likert‐type scales and measure the rational (e.g., ‘I make decisions in a logical and systematic way’), intuitive (e.g., ‘I generally make decisions that feels right to me’), spontaneous (e.g., ‘I make quick decisions’), avoidant (e.g., ‘I avoid making important decisions until the pressure is on’) and dependent (e.g., ‘I rarely make important decisions without consulting other people’) decision styles.
Self‐Monitoring Scale (Lennox & Wolfe, 1984)
Self‐monitoring Scale measures social orientation and captures two subdimensions: self‐reported sensitivity to expressive behavior of others in social interactions (e.g., ‘I can usually tell when I have said something inappropriate by reading it in the listener's eyes’) and self‐perceived ability to modify self‐presentation (e.g., ‘Once I know what the situation calls for, it is easy for me to regulate my actions accordingly’), and has 13 items rated on six‐point scales.
Machiavellian Personality Scale (Dahling et al., 2009)
Machiavellian Personality Scale measures social orientation in terms of self‐reported distrust of others (e.g., ‘I dislike committing to groups because I do not trust others’), amoral manipulation (e.g., ‘I would cheat if there were a low chance of getting caught’), desire for control (e.g., ‘I enjoy having control over other people’), and desire for status (e.g., ‘I want to be rich and powerful one day’), and includes 16 items rated on 5‐point Likert‐type scales.
Procrastination Scale–Student version (Lay, 1986)
The Procrastination Scale measures time approach and specifically tendencies to postpone the start or completion of tasks and includes 20 items rated on 5‐point Likert‐type scales. An item example is ‘I generally delay before starting on work I have to do’.
Time‐Style Scale (Usunier & Vallette‐Florence, 2007)
The 29 items on the Time‐Style Scale are rated on 7‐point Likert‐type scales and measure time approach by eight distinguished time styles: preference for economic time (i.e., strategic use of time, e.g., ‘I like to have a definite schedule and stick to it’), preference for nonorganized time (e.g., ‘I hate following a schedule’), orientation toward the past (e.g., ‘Sometimes I find myself dwelling on the past’), orientation toward the future (e.g., ‘I think a lot about what my life will be some day’), time submissiveness (i.e., preference to be on time, e.g., ‘I would rather come early and wait than be late to an appointment’), time anxiety (i.e., perceived usefulness of time, e.g., ‘I sometimes feel that the way I fill my time has little use or value’), tenacity (i.e., perseverance, e.g., ‘Once I have started an activity, I persist at it until I've completed it’), and preference for quick return (e.g., ‘I would prefer doing several very small projects than one very large one’).
Results and Discussion
Descriptive statistics and correlations
Descriptive statistics and reliability scores were similar to previous research and are reported in Table 1. Correlations among all measures are presented in Table 2. Correlations among the five decision styles were in line with previous research. The significant correlations between social orientation measures and decision styles were few and somewhat weak. The strongest correlations were observed between the self‐monitoring dimension sensitivity to expressive reactions of others and the spontaneous as well as the dependent style (negative direction), respectively.
Table 1.
Descriptive statistics for Study 1 (N = 118) and Study 2 (N = 90)
| Study 1 | Study 2 | Study 1 | Study 2 | Study 1 | Study 2 | ||
|---|---|---|---|---|---|---|---|
| Possible range | Measure | αa | αa | M (SD) | M (SD) | Observed range | Observed range |
| General Decision Making Style Inventory | |||||||
| 1–5 | Rational | .75 | .48 | 3.69 (0.66) | 3.70 (0.44) | 1.60–4.80 | 2.60–5.00 |
| 1–5 | Intuitive | .76 | .70 | 3.74 (0.60) | 3.40 (0.59) | 2.20–5.00 | 1.20–5.00 |
| 1–5 | Spontaneous | .83 | .74 | 2.84 (0.83) | 2.77 (0.67) | 1.20–5.00 | 1.20–4.40 |
| 1–5 | Dependent | .89 | .68 | 3.70 (0.89) | 3.32 (0.59) | 1.00–5.00 | 1.80–4.80 |
| 1–5 | Avoidant | .91 | .84 | 3.02 (1.03) | 2.16 (0.73) | 1.00–5.00 | 1.00–4.00 |
| Social orientation | |||||||
| 13–78 | Self‐Monitoring Scale (total) | .82 | .83 | 55.86 (8.05) | 52.87 (6.90) | 38–78 | 37–68 |
| 7–42 | Ability to modify self‐presentation | .84 | .74 | 30.25 (5.57) | 27.66 (4.43) | 17–42 | 17–35 |
| 6–36 | Sensitivity to expressive behavior of others | .73 | .80 | 25.61 (4.19) | 25.20 (4.07) | 15–36 | 14–35 |
| 16–80 | Machiavellian Personality Scale (total) | .90 | – | 38.43 (11.01) | – | 21–71 | – |
| 5–25 | Amoral manipulation | .79 | – | 9.45 (3.78) | – | 5–25 | – |
| 3–15 | Desire for control | .70 | – | 9.83 (2.59) | – | 4–15 | – |
| 3–15 | Desire for status | .85 | – | 8.23 (3.32) | – | 3–15 | – |
| 5–25 | Distrust of others | .82 | – | 10.92 (3.95) | – | 5–22 | – |
| 30–210 | Trait Emotional Intelligence (global) | – | .84 | – | 156.58 (18.76) | – | 115–204 |
| Time approach | |||||||
| 20–100 | Procrastination | .87 | .82 | 60.45 (12.77) | 43.36 (10.68) | 29–88 | 25–74 |
| 4–28 | Preference for economic time | .83 | .82 | 17.64 (4.67) | 16.92 (5.18) | 8–28 | 4–28 |
| 2–14/3–21 | Preference for nonorganized timeb | .50 | .73 | 5.38 (2.28) | 9.72 (3.75) | 2–12 | 3–21 |
| 4–28 | Orientation toward the past | .83 | .84 | 15.20 (5.57) | 12.43 (5.05) | 4–28 | 4–25 |
| 4–28 | Orientation toward the future | .87 | .81 | 23.00 (4.66) | 19.70 (5.45) | 6–28 | 4–28 |
| 4–28 | Time submissiveness | .82 | .48 | 21.31 (5.93) | 23.66 (4.51) | 8–28 | 9–28 |
| 4–28 | Time anxiety | .83 | .73 | 12.39 (4.90) | 11.92 (4.72) | 4–24 | 4–24 |
| 3–21 | Tenacity | .73 | .71 | 13.36 (3.51) | 15.49 (3.54) | 5–21 | 3–21 |
| 3–21 | Preference for quick return | .84 | .84 | 12.64 (3.63) | 13.18 (3.86) | 5–20 | 3–20 |
Cronbach's alpha.
One item was missing for this scale in Study 1.
Table 2.
Pearson correlations among decision styles, social orientation, and time approach—Study 1 (N = 118)
| 1 | 2 | 3 | 4 | 5 | 6 | 7 | 8 | 9 | 10 | 11 | 12 | 13 | 14 | 15 | 16 | 17 | 18 | 19 | 20 | |
|---|---|---|---|---|---|---|---|---|---|---|---|---|---|---|---|---|---|---|---|---|
| 1. Rational style | – | |||||||||||||||||||
| 2. Intuitive style | −.372** | – | ||||||||||||||||||
| 3. Spontaneous style | −.671** | .446** | – | |||||||||||||||||
| 4. Avoidant style | −.074 | −.119 | −.076 | – | ||||||||||||||||
| 5. Dependent style | .178 | −.173 | −.294** | .554** | – | |||||||||||||||
| 6. SMS ability | −.055 | .115 | .211* | −.149 | −.104 | – | ||||||||||||||
| 7. SMS sensitivity | −.086 | .200* | .235* | −.056 | −.240** | .349** | – | |||||||||||||
| 8. MPS amoral | −.072 | −.028 | .213* | .033 | −.117 | .165 | .119 | – | ||||||||||||
| 9. MPS control | .146 | −.019 | .063 | −.070 | −.127 | .277** | .203* | .433** | – | |||||||||||
| 10. MPS status | .193* | −.166 | −.083 | .014 | .043 | .156 | .070 | .547** | .516** | – | ||||||||||
| 11. MPS distrust | −.092 | .034 | .136 | .200* | −.031 | .027 | .206* | .705** | .417** | .496** | – | |||||||||
| 12. Procrastination | −.066 | −.144 | −.060 | .661** | .277** | −.163 | −.039 | .057 | −.049 | −.002 | .208* | – | ||||||||
| 13. TSS economic | .418** | −.063 | −.217* | −.044 | .201* | .033 | −.108 | −.024 | .299** | .199* | −.027 | −.210 | – | |||||||
| 14. TSS nonorganized | −.121 | −.041 | .105 | .192* | −.065 | −.102 | .103 | .145 | −.071 | .024 | .218* | .213* | −.576** | – | ||||||
| 15. TSS past | −.012 | .037 | .095 | .245** | .184* | .016 | .044 | .161 | .206* | .109 | .211* | .221* | .174 | .036 | – | |||||
| 16. TSS future | .182* | −.028 | −.092 | .134 | .109 | .007 | −.026 | .183* | .127 | .186* | .162 | .031 | .253** | .067 | .221* | – | ||||
| 17. TSS submissive | .010 | .027 | .095 | −.279** | −.064 | .143 | −.027 | −.164 | .055 | −.004 | −.181 | −.418** | .138 | −.227* | −.145 | .008 | – | |||
| 18. TSS anxiety | −.055 | −.056 | .013 | .408** | .192* | −.361** | .022 | .103 | .095 | .002 | .323** | .448** | −.009 | .181 | .322** | −.009 | −.089 | – | ||
| 19. TSS tenacity | .416** | −.007 | −.070 | −.265** | −.032 | .146 | −.002 | .040 | .136 | .184* | −.047 | −.365 | .433** | −.304** | .101 | .314** | .206* | −.197* | – | |
| 20. TSS quick return | −.130 | .137 | .210* | .067 | .089 | −.102 | −.103 | −.062 | −.051 | −.043 | .008 | .142 | −.123 | .244** | .127 | −.192** | −.011 | .074 | −.257** | – |
Note: SMS, Self‐Monitoring Scale; MPS, Machiavellian Personality Scale; TSS, Time‐Style Scale.
p < .05.
p < .01.
Compared with the measures of social orientation, a higher number of significant correlations were found between the measures of time approach and the decision styles. The measures of time approach were most clearly found to be related to the avoidant and the dependent styles. The avoidant style was positively related to the past‐oriented and the anxious time styles and to reports of procrastination but negatively related to the submissive and the tenacious time styles. Finally, the dependent style correlated positively with procrastination, whereas the rational style was positively related to the economic and the tenacious time styles.
Regression analyses
To improve the understanding of stylistic differences, and to test our hypotheses, the relationships between measures of social orientation and time approach to decision styles were tested by regression analyses. Each regression analysis used one of the five decision styles as dependent variable. Furthermore, only the measures of social orientation and time approach observed to be significantly correlated with the respective style were included as independent variables in each analysis. As only one significant correlation was observed for the intuitive style, no regression analysis was performed for that style. Table 3 reports the regression analyses.
Table 3.
Linear regression analyses of decision styles by measures of social orientation and time approach—Study 1 (N = 118)
| Rational | Spontaneous | Avoidant | Dependent | |
|---|---|---|---|---|
| SMS ability to modify self‐presentation | .153 | |||
| SMS sensitivity for expressive behavior of others | .166 | −.210* | ||
| MPS amoral manipulation | .179* | |||
| MPS desire for control | ||||
| MPS desire for status | .084 | |||
| MPS distrust of others | .021 | |||
| Procrastination | .572*** | .276** | ||
| TS preference for economic time | .279** | −.172* | .223* | |
| TS preference for non‐organized time | .032 | |||
| TS orientation toward the future | .008 | |||
| TS orientation toward the past | .082 | .077 | ||
| TS time submissiveness | .000 | |||
| TS time anxiety | .104 | .050 | ||
| TS tenacity | .277** | .033 | ||
| TS preference for quick return | .233** | |||
| R 2 | .25 | .20 | .46 | .20 |
| R 2 adjusted | .22 | .16 | .43 | .16 |
| Model statistic | F(4, 113) = 9.41*** | F(2, 112) = 5.45*** | F(7, 110) = 13.45*** | F(5, 112) = 5.43*** |
Note: Estimates are standardized coefficients (β), reported for all predictors included in the regression analyses of each decision style.
SMS, Self‐Monitoring Scale; MPS, Machiavellian Personality Scale; TS, Time‐Style Scale.
p ˂ .001.
p ˂ .01.
p ˂ .05.
The regression analysis for the rational style accounted for 24% of the variance. Hypothesis 1, stating that reports of preference for an economic and a tenacious approach to time would be positively related to the rational style, was supported. Of the four included independent variables in the regression analysis for the rational style, the two significant predictors were found to be the economic and the tenacious time styles.
The regression analysis for the spontaneous style accounted for 20% of the variance. Hypothesis 2, stating that reports on the Machiavellian personality dimension amorally manipulative and the two time style preference for nonorganized time and preference for quick return would be positively related to the spontaneous style, was only partially supported. Three of the five independent variables were significant predictors for the spontaneous style: the Machiavellian personality dimension amoral manipulation and the time style preference for economic time (negative direction) and the preference for quick return.
For the avoidant style, the regression analysis accounted for 46% of the variance. Hypothesis 3 stated that the Machiavellian personality dimension distrust of others, procrastination, and the three time style preference for nonorganized time, orientation toward the past, and time anxiety would be positively related to the avoidant style. However, the result only provided support for the hypothesized relation between procrastination and the avoidant style, as procrastination was the only significant predictor.
Finally, the regression analysis for the dependent style accounted for 20% of the variance. Hypothesis 4, stating that reports of self‐monitoring would be negatively related to the dependent style whereas reports of procrastination and the two time‐style time submissiveness and time anxiety would be positively related to the dependent style, was partially supported. The three predictors for the dependent style found to be significant were the self‐monitoring dimension sensitivity to expressive behavior of others (negative direction), the time‐style preference for economic time, and procrastination. In sum, the result of the regression analyses showed that the variance accounted for by the measures of social orientation and time approach in the rational, spontaneous, avoidant, and dependent styles varied between 20% and 46%.
Study 2
Method
Participants
In total, 360 police investigators were invited to participate. Initially, 165 police investigators were contacted by email invitations with a link to a Web‐based questionnaire answered by 66 participants (participation rate = 40%). However, 21 Web questionnaires were incomplete and therefore excluded. Due to technical limitations (e.g., restricted computer availability), all potential participants could not be contacted with email. Hence, 195 additional invitations accompanied by paper‐and‐pen questionnaires were sent out to investigators not previously invited. These questionnaires were answered by 50 participants (participation rate = 26%, total participation rate 32%). For the paper‐and‐pen questionnaire, five questionnaires were incomplete and excluded. Moreover, for the paper‐and‐pen questionnaires, there was a limited concern of missing data for a few items. Missing value analysis showed no pattern; thus, missing data were replaced by computations using the expectation–maximization method (Kline, 2005).
The final sample consisted of 90 participants (37% women, aged 24–65 years, mean age = 46 years, SD age = 11.2). Forty‐five participants answered a Web‐based questionnaire and 45 participants a paper‐and‐pen questionnaire. The sample of investigators was differentiated geographically (i.e., metropolitan/rural) and in terms of alignment (e.g., violent crimes/traffic offense). Moreover, the sample varied in terms of leading position (18%), experience (i.e., time in current position: 0–1 year, 24%; 1–5 years, 27%; 5–10 years, 30%; ˃10 years, 16%), and police education (85%).
Measures
The questionnaires included the same scales as in Study 1, except that the Machiavellian Personality Scale was replaced by the Trait Emotional Intelligence Questionnaire–Short Form (TEIQue‐SF; Petrides & Furnham, 2001, 2006). This replacement was done because the present police sample could have reacted negatively if Machiavellianism had been investigated and further motivated by the consideration that Machiavellianism and emotional intelligence measure largely mutually exclusive dispositions (Petrides, Vernon, Schermer, & Veselka, 2011). The TEIQue‐SF measures aspects of differences in social orientation in terms of behavioral disposition and ability to be responsive, accurately process, and regulate emotional reactions in social interactions (i.e., in both self and others). The 30 items of the TEIQue‐SF are rated on 7‐point Likert‐type scales. An example item is ‘I usually find it difficult to regulate my emotions’ (reversed scored). Additionally, Study 2 used the adult version of the Procrastination Scale (Lay, 1986).
The questionnaires presented the scales and questions in the following order: the GDMS, Self‐Monitoring Scale, the Time‐Style Scale, the Procrastination Scale, and the TEIQue. As in Study 1, the order of the items on each scale was randomized in terms of subscale affiliation but not randomized between participants.
Results and Discussion
Descriptive statistics and correlations
Table 1 shows the descriptive statistics and reliability scores for Study 2. Compared with Study 1, lower reliability scores were observed for the dependent style and, especially, the rational style. Table 4 presents the correlations among all measures in Study 2. Correlations among decision styles were similar to Study 1, and the positive relation between the rational and the dependent styles was now significant. For the social measures, emotional intelligence (TEIQue‐SF) was negatively correlated with the avoidant and the dependent styles. For time styles, observed relationships in Study 1 were mostly replicated for the rational style, although a negative relation to the preference for nonorganized time style was found. Neither the intuitive nor the spontaneous styles were significantly related to the measures of social orientation or time approach. Correlations for the avoidant style confirmed those found in Study 1 but were overall somewhat weaker in the present sample. The relationships between the dependent style to the past‐oriented time style and procrastination found in Study 1 were replicated. The dependent style showed a positive relationship to the future‐oriented and preference for quick return time styles, but, in contrast to Study 1, lower and nonsignificant correlations were observed between the dependent style to the time style preference for economic time and time anxiety.
Table 4.
Pearson correlations among decision styles, social orientation, and time approach—Study 2 (N = 90)
| 1 | 2 | 3 | 4 | 5 | 6 | 7 | 8 | 9 | 10 | 11 | 12 | 13 | 14 | 15 | 16 | 17 | |
|---|---|---|---|---|---|---|---|---|---|---|---|---|---|---|---|---|---|
| 1. Rational style | – | ||||||||||||||||
| 2. Intuitive style | −.298** | – | |||||||||||||||
| 3. Spontaneous style | −.497** | .481** | – | ||||||||||||||
| 4. Avoidant style | .058 | .088 | −.091 | – | |||||||||||||
| 5. Dependent style | .353** | −.181 | .278** | .467** | – | ||||||||||||
| 6. SMS ability | .099 | .097 | −.057 | −.083 | −.064 | – | |||||||||||
| 7. SMS sensitivity | .146 | .154 | −.156 | .120 | .108 | .326** | – | ||||||||||
| 8. TEIQue‐SF | .095 | −.054 | −.080 | −.555** | −.247* | .274** | .114 | – | |||||||||
| 9. Procrastination | −.076 | .059 | −.192 | .459** | .227* | −.102 | .022 | −.423** | – | ||||||||
| 10. TSS economic | .324** | −.176 | .024 | −.172 | .150 | −.005 | .054 | −.019 | −.423** | – | |||||||
| 11. TSS nonorganized | −.292** | .140 | .033 | .209* | .024 | −.097 | .015 | −.059 | .294** | −.617** | – | ||||||
| 12. TSS past | .093 | −.009 | .133 | .217* | .231* | .060 | .146 | −.322** | .104 | .214* | −.071 | – | |||||
| 13. TSS future | .160 | .055 | −.022 | .141 | .285** | .158 | .195 | −.070 | .034 | .285** | −.302** | .403** | – | ||||
| 14. TSS submissive | .080 | .033 | .203 | −.212* | −.096 | .163 | −.032 | .201 | −.552** | .269* | −.253* | −.048 | .077 | – | |||
| 15. TSS anxiety | −.093 | .081 | .094 | .296** | .092 | .002 | −.018 | −.514** | .175 | .117 | −.006 | .427** | .201 | −.045 | – | ||
| 16. TSS tenacity | .281** | −.155 | −.072 | −.331** | −.097 | −.011 | .109 | .263* | −.458** | .431** | −.412** | .081 | .014 | .329** | −.120 | – | |
| 17. TSS quick return | .040 | .190 | .101 | .127 | .228* | .033 | −.020 | −.095 | .010 | .240* | −.026 | .016 | −.038 | −.006 | .022 | .003 | – |
Note: SMS, Self‐Monitoring Scale; TEIQue‐SF, Trait Emotional Intelligence Questionnaire–Short Form; TSS, Time‐Style Scale.
p < .05.
p < .01.
Regression analyses
Regression analyses were performed based on the same procedure as in Study 1 and are reported in Table 5. No regression analyses were performed for the intuitive or the spontaneous styles because no significant correlation was observed between these two styles and the social orientation or time approach measures.
Table 5.
Linear regression analyses of decision styles by measures of social orientation and time approach—Study 2 (N = 90)
| Rational | Avoidant | Dependent | |
|---|---|---|---|
| SMS ability to modify self‐presentation | |||
| SMS sensitivity for expressive behavior of others | |||
| TEIQue‐SF Trait Emotional Intelligence | −.407*** | −.118 | |
| Procrastination | .238* | .159 | |
| TS preference for economic time | .188 | ||
| TS preference for nonorganized time | −.113 | .094 | |
| TS orientation toward the future | .252* | ||
| TS orientation toward the past | .078 | .071 | |
| TS time submissiveness | .062 | ||
| TS time anxiety | .003 | ||
| TS tenacity | .153 | −.103 | |
| TS preference for quick return | .224* | ||
| R 2 | .14 | .39 | .20 |
| R 2 adjusted | .11 | .34 | .16 |
| Model statistics | F(3, 86) = 4.54** | F(7, 82) = 7.60*** | F(5, 84) = 4.31** |
Note: Estimates are standardized coefficients (β), reported for all predictors included in the regression analyses of each decision style.
SMS, Self‐Monitoring Scale; TEIQue‐SF, Trait Emotional Intelligence Questionnaire–Short Form; TS, Time‐Style Scale.
p ˂ .001.
p ˂ .01.
p ˂ .05.
The regression analysis for the rational style accounted for 14% of the variance. Hypothesis 1 stated that reports of preference for an economic and a tenacious approach to time would be positively related to the rational style but were not supported as none of the three independent variables were significant as single predictors.
The regression analysis for the avoidant style accounted for some 40% of the variance. Hypothesis 3 stated that reports of emotional intelligence would be negatively related to the avoidant style, whereas reports of procrastination and the three time style preference for nonorganized time, orientation toward the past, and time anxiety would be positively related to the avoidant style. In partial support of Hypothesis 3, reports of emotional intelligence (negative direction) and procrastination were found to be significant predictors for the avoidant style.
Finally, the regression analysis for the dependent style accounted for 20% of the variance. Hypothesis 4, stating that reports of emotional intelligence would be negatively related to the dependent style, whereas reports of procrastination and the two time‐style time submissiveness and time anxiety would be positively related to the dependent style, was not supported. For the dependent style, the future‐orientated and the preference for quick return time styles were found to be the significant predictors. In sum, the regression analyses in Study 2 showed that the amount of variance accounted for by the social orientation and the time style measures varied from 14% to 40% for the rational, the avoidant, and the dependent styles.
Testing the two‐component model of decision styles
Finally, we tested the two‐component model of decision styles presented by Dewberry et al. (2013a) by using our GDMS data. In order to improve the conditions for this, the samples in Studies 1 (N = 118) and 2 (N = 90) were combined (N = 208) and used in all analyses in the succeeding text. Although recommendations on sample size and which model fit indices to use vary (see e.g., Barrett, 2007; O'Boyle & Williams, 2011), some indices may be overestimated because our combined sample is still rather small.
Structural equation modeling was performed by using the stata version 14.2 with maximum likelihood estimation. We report chi‐square, root mean square error of approximation (RMSEA), comparative fit index (CFI), Tucker Lewis index (TLI), and standardized root mean square residual (SRMR) as fit indices. We further present Akaike's information criterion (AIC) and Bayesian information criterion (BIC) in order to assess which model, when compared between the presented nested models, has the most parsimonious model fit. Based on modification indices, we also tested some possibilities for further improvements of the tested models. This means that we investigated how the basic model (i.e., replication of the two‐component model presented in Dewberry et al. [2013a]) could be improved to better fit the present data. The improved models are nested within the basic model, which implies that we can compare CFIs (AIC and BIC) in order to establish the most parsimonious model. Lower values indicate better fit, and when comparing models, the lower value indicates the better fitting model according to the present data. We compare the goodness of fit statistics based on the recommendations in Hair, Black, Babin, Anderson, and Tatham (2010) and thereby acknowledge that absolute thresholds for model fit are not advisable. Thus we, in the succeeding texts, follow the rules of thumb resulting in cautious wordings such as ‘poor’ and ‘acceptable’.
Initially, a confirmatory factor analysis (CFA) was performed to test the factor structure of the decision styles on the GDMS to the data. The results indicated that the latent variable structure was not ideal in terms of model fit. However, there were no cross‐loadings found in the CFA; that is, there were no cases where items on one style loaded (>.30) on another style. We continued by omitting items 12, 19, and 27 due to factor loadings <.30 in the initial CFA. The CFA without the three items still resulted in a poor fit, χ 2 (200) = 585.14, p < .001, RMSEA = .10 (90% CI = .09–.11), CFI = .84; TLI = .81; SRMR = .14; AIC = 11 551.06; BIC = 11 803.86.
Next, in line with the procedure by Dewberry et al. (2013a), we tested two models: (1) an unrelated model without any parameters and (2) a structural model with two added parameters—specifying relationships between the intuitive and the spontaneous styles, as well as between the avoidant and the dependent styles, respectively (see Figures 1–3 in Dewberry et al., 2013a). The unrelated model (Figure 1) had a poor fit χ 2 (231) = 813.38, p < .001, RMSEA = .12 (90% CI = .12–.13), CFI = .74; TLI = .71; SRMR = .21; AIC = 11 761.30; BIC = 11 983.77.
Figure 1.

Structural equation model for the unrelated model without parameters, showing standardized effects among latent variables, indicators, and error terms (n = 208). For General Decision‐Making Style Scale (GDMS) item‐numbers, see Table V in Spicer and Sadler‐Smith (2005)
The structural model (Figure 2) with added parameters (Dewberry et al., 2013a) also showed a poor model fit χ 2 (207) = 725.33, p < .001, RMSEA = .11 (90% CI = .10–.12), CFI = .78; TLI = .75; SRMR = .17; AIC = 11 633.24; BIC = 11 788.29.
Figure 2.

Structural equation model replicating the two‐component model with two parameters (Dewberry et al., 2013a), showing standardized effects among latent variables, indicators, and error terms (n = 208). For General Decision‐Making Style Scale (GDMS) item‐numbers, see Table V in Spicer and Sadler‐Smith (2005)
Through the use of modification indices, we could improve the model according to the present data by introducing two additional parameters (i.e., compared with the structural model, proposed by Dewberry et al., 2013a). These two additional parameters indicate a strong relationship between the rational style on the spontaneous style and a relationship between the spontaneous style on the dependent style. The model could be further improved by letting the error terms of the GDMS6 and GDMS23, and the GDMS5 and the GDMS16 items, covary freely. In the further improved model (Figure 3), there was a strong negative relationship between the rational style and the spontaneous style and also a negative relationship between the spontaneous and the dependent styles. The model fit for the further improved model was acceptable: χ 2 (201) = 462.26, p < .001, RMSEA = .08 (90% CI = .07–.09), CFI = .89; TLI = .87; SRMR = .12; AIC = 11 382.18; BIC = 11 557.45.
Figure 3.
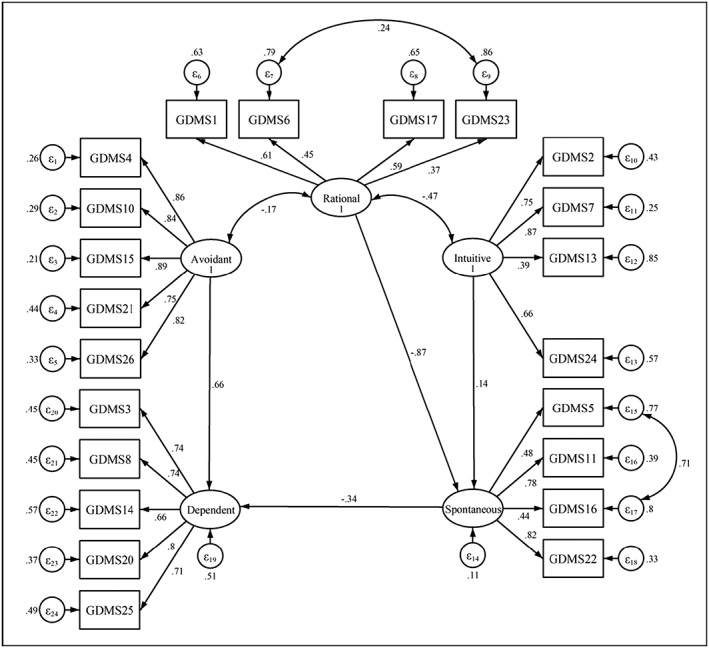
Structural equation model for the further improved model with four parameters (two of which were tested by cf. Dewberry et al. [2013a]), showing standardized effects among latent variables, indicators, and error terms (n = 208). For General Decision‐Making Style Scale (GDMS) item‐numbers, see Table V in Spicer and Sadler‐Smith (2005)
General Discussion
Using two different samples, the present study investigated the relation between decision styles to specific aspects of social orientation and approach to time. Overall, the observed pattern of relations partly supported our hypotheses. We first discuss the results of the present study's main focus, that is, the observed relationships between specific measures of social orientation and time approach to decision styles. We then attend to the results relating to the two‐component model of decision styles (Dewberry et al., 2013a).
The relation between aspects of social orientation and time approach and decision styles
The rational style
Supporting Hypothesis 1, the results of Study 1 showed that the economic (i.e., structured) and the tenacious (i.e., persistent) time styles were positively related to the rational style. However, Hypothesis 1 was not supported by the results of the regression analysis in Study 2. Possibly, as the preference for nonorganized time style (negative relation) was included in the analysis of Study 2, this may have taken out the effect of the economic and the tenacious time styles—as the nonorganized time style captures the very opposite approach to time compared with those two time styles. Furthermore, notably, the positive relation between emotional intelligence and the rational style previously reported in a high‐school sample (Di Fabio & Kenny, 2012) was not replicated in the older and professional sample (Study 2). Previous research has reported that people high in the rational style show high levels of self‐efficacy (Mau, 2000), internal locus of control (Scott & Bruce, 1995), and earned self‐esteem (Thunholm, 2004). These results, together with our finding that people high in the rational style also report to approach activities in a structured (i.e., economic) and tenacious manner, indicate that people with a rational style may be driven by a basic motivation for socially accountable accomplishments in their decision making (i.e., by use of an elaborate and explicit decision‐making process).
The intuitive style
No relations were hypothesized for the intuitive style, and the results only showed that one of the measures of social orientation was related to the intuitive style (i.e., the self‐monitoring subdimension: sensitivity to expressive behavior of others showed a positive relation in Study 1). One interpretation of this result is that neither people's social orientation nor time approach relates to preference for making intuitive decisions. This interpretation is supported by the weak relation between emotional intelligence and the intuitive style reported by Di Fabio and Kenny (2012). However, it is also possible that the intuitive style simply does not relate to the specific aspects of social orientation or time approach we measured. Supportive of this alternative explanation, Carelli et al. (2011) found that reports of present orientation related to the intuitive style, that is, an aspect of time orientation not included in our study.
The lack of observed relation between the intuitive style and the social orientation measures is somewhat surprising. Although a tendency to be guided by intuition means that one relies on internally generated affective experiences and associations, it could be expected that such associations have a learning history dependent on picking up other people's reactions or evaluations. Carelli et al.'s (2011) report of a relation between the intuitive style and a present orientation time style suggests an alertness to ongoing events, and the finding in our Study 1, of a relation between intuition and sensitivity to the expressive behavior of others, supports that intuitive decision makers take an interest in social relations, although their interest may be of a more passive kind compared to decision makers with a rational style. Given this suggestion, future research should explore the relation among other aspects of social orientation than those covered in the present study and the intuitive style.
The spontaneous style
The results for the spontaneous style partly confirmed Hypothesis 2. In Study 1, participants who gave higher reports of a tendency to have an amorally manipulative social orientation and a preference for quick returns, while also to be less inclined to structure and prioritize the usage of time, gave higher reports of the spontaneous style. This suggests that people with a spontaneous style tend to take decision making less seriously and to be motivated to get decisions over with. However, these relations were not replicated in Study 2. Possibly, the professional sample in Study 2 may be more inclined to take a responsible approach to decision making compared with the university student sample in Study 1. In support of this, previous research has reported that with age, people become more concerned with how they spend their time (e.g., Strough et al., 2014; Usunier & Vallette‐Florence, 2007).
The avoidant style
The results for the avoidant style provided some support for Hypothesis 3 and indicate that this style is associated with aspects of a somewhat problematic social orientation. For example, distrust of others (Study 1) and poor emotional understanding/regulation (Study 2) were found to be related to the avoidant style. Thus, in line with the suggestion by Di Fabio and Kenny (2012), people who tend to avoid making decisions may do so partly because they have trouble understanding their own and other people's emotional reactions. We also found that reports of a past‐oriented, nonorganized, anxious, and nonpersistent approach to time – indicating a withdrawal from social life in terms of approaching decision making in an unstructured and nongoal‐oriented way – was related to the avoidant style. Moreover, procrastination was found to be strongly related to the avoidant style. This adds support to the assumption that the avoidant style relates to a tendency to withdrawal from social life, as procrastination behavior has been reported to be associated with worries of socially prescribed perfectionism, self‐critical thinking, and fear of negative social evaluations (Steel, 2007).
The dependent style
We found reports of the self‐monitoring subdimension: sensitivity to expressive behavior of others (Study 1) and emotional intelligence (Study 2) to be negatively related to the dependent style. These results provide support for the social orientation part of Hypothesis 4. The hypothesized relations between time submissiveness and time anxiety to the dependent style were observed in the correlations but were not confirmed by the regression analyses. Furthermore, the predictive relationships of time approach measures for the dependent style differed between the two samples studied. In Study 1, reports of the time style preference for economic time and procrastination were positively related to the dependent style. In Study 2, reports of future orientation and a preference for quick return were positively related to the dependent style. One possible interpretation of these inconsistent results is that they illustrate the complexity of the dependent style. That is, people reporting a preference for the dependent style seems to be engaged in their decision making (e.g., motivated to structure their activities/decision making), but to have trouble upholding this ambition. To illustrate, the dependent style was negatively related to the spontaneous style in Study 1 but positively related to the spontaneous style and reports of the quick return time style in Study 2. Speculatively, in some settings, consulting others (or devolving decision making onto others) can be a strategy people use in order to get decisions over with in a seemingly responsible way. Additionally, the negative relations observed between the dependent style and reports on sensitivity to expressive behavior of others (Study 1), and reports on the ability to regulate one's own and other people's emotional reactions (Study 2), may provide an explanation for the negativity of the dependent style reported in previous research (e.g., Allwood & Salo, 2012; Bruine de Bruin et al., 2007). It may be that individuals who report using the dependent style have an excessive reliance on other people and on the advice given (Flynn et al., 2006; Gino, Brooks, & Schweitzer, 2012). In this context, it is relevant to note that people prone to use the dependent style are socially oriented (Loo, 2000) but not socially adaptive (Di Fabio & Kenny, 2012). Nevertheless, Delaney, Strough, Parker, and Bruine de Bruin (2015) noted that the dependent style may reflect both socially oriented decision makers (e.g., motivated to gain information and acceptance) and unmotivated and/or unskilled decision makers (e.g., shift decision initiative and responsibility onto others). Yet, it is also possible that the inconsistent results for the dependent style are due to sampling error given the relatively small sample sizes used in the two studies. Hence, future research should specifically study if two subtypes of the dependent style can be identified, one subtype characterized by social constructiveness and one subtype characterized by social anxiousness and passivity.
The two‐component model of decision styles
We tested if the present data (combined sample, N = 208) could replicate and provide additional support for the two‐component model (Dewberry et al., 2013a). The results showed that the two‐component model did not fit the data well. However, the two‐component model could be improved by introducing two additional parameters and further improved by letting the error terms of four GDMS items to covary freely. Thus, our results indicate some limits on the generality of the two‐component model, of which the most important may be the relation between the spontaneous style and the dependent style. However, the within‐component link between the rational style and the spontaneous style is noteworthy. Still, we acknowledge that our small sample is problematic and that the fit indices for the improved models were only barely acceptable. In addition, apart from the five decision styles included in our study, Dewberry et al. also included three other styles (e.g., regret) that could have contributed to the differences in the results. Nevertheless, it is reasonable to assume that the two‐component structure (core and regulative) is meant to have generality irrespective of which further styles are tested at the same time.
One possible implication of our results is that the spontaneous style may not best reflect core decision processes (Dewberry et al., 2013a), but rather decision regulating processes. Previous research has noted that the essence of the spontaneous style is to act on impulse (Parker et al., 2007) and that impulsive behavior is more common among men, who also have been found to have higher preference for use of the spontaneous style, whereas women may prefer the use of the dependent style (see Delaney et al., 2015). Furthermore, impulsivity is often considered to be an evasive behavior, and being spontaneous in one's decision making can therefore be seen as a strategy to cope with decision‐related anxiety. Speculatively, it may be more important (and/or socially prescribed) for men to appear ‘decisive’, thereby having a proneness to make impulsive decisions when experiencing decision‐related anxiety. In contrast, women may be more motivated (and/or socially prescribed) to be socially or interpersonally oriented (see e.g., Cross & Madson, 1997), thereby to be more inclined to consult others in order to deal with decision‐related anxiousness. Alternatively, as suggested by one reviewer, certain states in one of the components (e.g., low in spontaneous style) may influence processes in the other component (e.g., increased tendency to dependent style), depending on the context (e.g., when in a hierarchical social system). These observations are in line with noting that, on a conceptual level, the spontaneous style also seems to relate to if and when decisions are made (regulating processes) and the dependent style also seems to relate to how decisions are made (e.g., by asking others and core processes).
In sum, we encourage future research to further explore if the two‐component model (Dewberry et al., 2013a) should be revised by placing the spontaneous style among the regulatory styles. Additionally, future research could also investigate if the dependent style could profitably be split up into two styles, one core and one regulative.
Limitations
This study reports correlational data; future research should explore if causal relationships can be demonstrated between social orientation, time approach, and decision styles. Overall, the rather small samples used in the study can be considered a limitation. The fact that some measures used in Study 1 were needed to be replaced in Study 2 may also be considered to be a limitation, as is the observed low reliabilities for certain measures. Another limitation is that the police investigator sample used in Study 2 can be considered to be a somewhat unique sample, encountering difficult line of duty decisions and therefore may not generalize to other populations. Furthermore, the use of cross‐sectional data in the present study should be improved by the use of longitudinal data in future research.
With respect to our attempt to replicate the results of Dewberry et al. (2013a), several limitations may pose problems for the comparison between our results and Dewberry et al.'s results. Our results show that participants' responses to the GDMS items did not fully discriminate as expected or as compared with Dewberry et al. (2013a). This may suggest that the GDMS inventory is less generalizable than we expected. We used a combined sample, consisting of undergraduates and police officers. These samples may differ on a group level, adding some irrelevant variance. In addition, our models included fewer styles than the models analyzed by Dewberry et al. It should also be acknowledged that our combined sample is still relatively small, and thus, the multivariate modeling may be overestimated or underestimated.
Conclusions and Future Research
The present study contributes to the understanding of individual differences in decision styles. Our results show that the way people usually go about to approach and handle their decision relates to their social orientation and their overall approach to time and time‐related activities. More specifically, our results show that people who report the use of the rational style also report an overall structured use and attitude to time. This indicates a basic motivation for making successful and accountable decisions. Moreover, our results suggest that people who report to frequently use the spontaneous style may do so because they tend to take decision making less seriously and/or are motivated to get decisions over with. Furthermore, our results indicate that people who report the use of the avoidant style also give reports illustrative for a tendency of withdrawal from social life. The observed relations for the dependent style suggest that this style seems to capture people with a socially active/constructive orientation as well as people who have a more passive/anxious stance. The observed ambiguity of the dependent style and the possibility of separating the dependent style into two styles should be further investigated in future research.
In addition, we only found qualified support for the generality of the proposed two‐component model for decision styles (Dewberry et al., 2013a). It is therefore possible that the relation between decision styles of the suggested two components (i.e., core decision processes and decision regulative processes) may be more complex. Future research on decision styles should test the extent to which our findings replicate in other samples and cultural contexts.
Acknowledgements
We gratefully acknowledge PhD Anders Carlander for running the structural equation modeling analyses. We also gratefully acknowledge the support for this research by a grant from the Swedish Research Council for Health, Working Life and Welfare (FORTE) dnr: 2010‐0430 to the second author (Carl Martin Allwood).
Biographies
Martin Geisler is a researcher at the University of Gothenburg and a postdoctoral researcher at Malmö University. His research interests include decision making, social cognition, and organizational psychology.
Carl Martin Allwood is full professor of psychology at the University of Gothenburg, Sweden. His research interests include judgment and decision making, social cognition, and culture oriented psychology.
Geisler, M. , and Allwood, C. M. (2018) Relating Decision‐Making Styles to Social Orientation and Time Approach. J. Behav. Dec. Making, 31: 415–429. doi: 10.1002/bdm.2066.
This research was funded by a grant from the Swedish Research Council for Health, Working Life and Welfare, FORTE. dnr: 2010‐0430 to the second author (Carl Martin Allwood).
References
- Allwood, C. M. , & Salo, I. (2012). Decision‐making styles and stress. International Journal of Stress Management, 19(1), 34–47. https://doi.org/10.1037/a0027420. [Google Scholar]
- Appelt, K. C. , Milch, K. F. , Handgraaf, M. J. J. , & Weber, E. U. (2011). The Decision Making Individual Differences Inventory and guidelines for the study of individual differences in judgment and decision‐making research. Judgment and Decision making, 6, 252–262. [Google Scholar]
- Barrett, P. (2007). Structural equation modelling: Adjudging model fit. Personality and Individual Differences, 42(5), 815–824. https://doi.org/10.1016/j.paid.2006.09.018. [Google Scholar]
- Bavol'ár, J. , & Orosová, O. (2015). Decision‐making styles and their associations with decision‐making competencies and mental health. Judgment and Decision making, 10(1), 115–122. [Google Scholar]
- Bruine de Bruin, W. , Parker, A. M. , & Fischhoff, B. (2007). Individual differences in adult decision‐making competence. Journal of Personality and Social Psychology, 92, 938–956. https://doi.org/10.1037/0022-3514.92.5.938. [DOI] [PubMed] [Google Scholar]
- Carelli, M. G. , Wiberg, B. , & Wiberg, M. (2011). Development and construct validation of the Swedish Zimbardo time perspective inventory. European Journal of Psychological Assessment, 27, 220–227. https://doi.org/10.1027/1015-5759/a000076. [Google Scholar]
- Cross, S. E. , & Madson, L. (1997). Models of the self: Self‐construals and gender. Psychological Bulletin, 122(1), 5–37. [DOI] [PubMed] [Google Scholar]
- Curşeu, P. L. , & Schruijer, S. G. L. (2012). Decision styles and rationality: An analysis of the predictive validity of the General Decision‐Making Style Inventory. Educational and Psychological Measurement, 72(6), 1053–1062. https://doi.org/10.1177/0013164412448066. [Google Scholar]
- Dahling, J. J. , Whitaker, B. J. , & Levy, P. E. (2009). The development and validation of a new Machiavellianism scale. Journal of Management, 35(2), 219–257. https://doi.org/10.1177/0149206308318618. [Google Scholar]
- Day, D. V. , Schleicher, D. J. , Unckless, A. L. , & Hiller, N. J. (2002). Self‐monitoring personality at work: A meta‐analytic investigation of construct validity. Journal of Applied Psychology, 87, 390–401. https://doi.org/10.1037//0021-9010.87.2.390. [DOI] [PubMed] [Google Scholar]
- Delaney, R. , Strough, J. , Parker, A. M. , & Bruine de Bruin, W. (2015). Variations in decision‐making profiles by gender and age: A cluster‐analytic approach. Personality and Individual Differences, 85, 19–24. https://doi.org/10.1016/j.paid.2015.04.034. [DOI] [PMC free article] [PubMed] [Google Scholar]
- Dewberry, C. , Juanchich, M. , & Narendran, S. (2013a). The latent structure of decision styles. Personality and Individual Differences, 54, 566–571. https://doi.org/10.1016/j.paid.2012.11.002. [Google Scholar]
- Dewberry, C. , Juanchich, M. , & Narendran, S. (2013b). Decision‐making competence in everyday life: The roles of general cognitive styles, decision‐making styles and personality. Personality and Individual Differences, 55, 783–788. https://doi.org/10.1016/j.paid.2013.06.012. [Google Scholar]
- Di Fabio, A. , & Kenny, M. E. (2012). The contribution of emotional intelligence to decision styles among Italian high school students. Journal of Career Assessments, 20(4), 404–414. https://doi.org/10.1177/1069072712448893. [Google Scholar]
- Flynn, F. J. , Reagans, R. E. , Amantullah, E. T. , & Ames, D. R. (2006). Helping ones way to the top: Self‐monitors achieve status by helping others and knowing who helps whom. Journal of Personality and Social Psychology, 91, 1123–1137. https://doi.org/10.1037/0022-3514.91.6.1123. [DOI] [PubMed] [Google Scholar]
- Geisler, M. , & Allwood, C. M. (2015). Competence and quality in real‐life decision making. PLoS One, 10(11), e0142178 https://doi.org/10.1371/journal.pone.0142178. [DOI] [PMC free article] [PubMed] [Google Scholar]
- Gino, F. , Brooks, A. W. , & Schweiter, M. E. (2012). Anxiety, advice, and the ability to discern: Feeling anxious motivates individuals to seek and use advice. Journal of Personality and Social Psychology, 102(3), 497–512. https://doi.org/10.1037/a0026413. [DOI] [PubMed] [Google Scholar]
- Hair, J. F. J. , Black, W. C. , Babin, B. J. , Anderson, R. E. , & Tatham, R. L. (2010). Multivariate data analysis. New Jersey, NJ: Prentice‐Hall. [Google Scholar]
- Holman, E. A. , & Zimbardo, P. G. (2009). The social language of time: The time perspective‐social network connection. Basic and Applied Psychology, 31, 136–147. https://doi.org/10.1080/01973530902880415. [Google Scholar]
- Kline, R. B. (2005). Principles and practice of structural equation modeling (2nd ed.,). New York: The Guilford Press. [Google Scholar]
- Lay, C. H. (1986). At last, my research article on procrastination. Journal of Research in Personality, 20, 474–495. [Google Scholar]
- Lennox, R. D. , & Wolfe, R. N. (1984). Revision of the Self‐Monitoring Scale. Journal of Personality and Social Psychology, 46, 1349–1364. https://doi.org/10.1037/0022-3514.46.6.1349. [DOI] [PubMed] [Google Scholar]
- Leykin, Y. , & DeRubeis, R. J. (2010). Decision‐making styles and depressive symptomatology: Development of the decision styles questionnaire. Judgment and Decision making, 7(5), 506–515. [Google Scholar]
- Loewenstein, G. , Read, D. , & Baumeister, R. F. (2003). Time and decision—Economic and psychological perspectives on intertemporal choice. New York: Russell Sage. [Google Scholar]
- Loo, R. (2000). A psychometric evaluation of the General Decision‐Making Style Inventory. Personality and Individual Differences, 29(5), 895–905. [Google Scholar]
- Mann, L. , Burnett, P. , Radford, M. , & Ford, S. (1997). The Melbourne Decision Making Questionnaire: An instrument for measuring patterns for coping with decisional conflict. Journal of Behavioral Decision Making, 10(1), 1–19. https://doi.org/10.1002/(SICI)1099-0771(199703)10:1%3C1::AID-BDM242%3E3.0.CO;2-X. [Google Scholar]
- Mau, W. C. (2000). Cultural differences in career decision‐making styles and self‐efficacy. Journal of Vocational Behavior, 57, 365–378. https://doi.org/10.1006/jvbe.1999.1745. [Google Scholar]
- Mohammed, S. , & Schwall, A. (2009). Individual differences and decision making: What we know and where we go from here In Hodgkinson G. P., & Ford J. K. (Eds.), International review of industrial and organizational psychology ( Vol. 24, pp. 249–312). Chichester, UK: John Wiley & Sons. [Google Scholar]
- O'Boyle, E. H. Jr. , & Williams, L. J. (2011). Decomposing model fit: Measurement vs. theory in organizational research using latent variables. Journal of Applied Psychology, 96, 1–12. https://doi.org/10.1037/a0020539. [DOI] [PubMed] [Google Scholar]
- Parker, A. M. , Bruine de Bruin, W. , & Fischhoff, B. (2007). Maximizers versus satisficers: Decision‐making styles, competence, and outcomes. Judgment and Decision making, 2(6), 342–350. [Google Scholar]
- Petrides, K. V. , & Furnham, A. (2001). Trait emotional intelligence: Psychometric investigation with reference to established trait taxonomies. European Journal of Personality, 15, 425–448. https://doi.org/10.1002/per.416. [Google Scholar]
- Petrides, K. V. , & Furnham, A. (2006). The role of trait emotional intelligence in a gender‐specific model of organizational variables. Journal of Applied Psychology, 36, 552–569. [Google Scholar]
- Petrides, K. V. , Vernon, P. A. , Schermer, J. A. , & Veselka, L. (2011). Trait emotional intelligence and the dark triad traits of personality. Twin Research and Human Genetics, 14, 35–41. https://doi.org/10.1375/twin.14.1.35. [DOI] [PubMed] [Google Scholar]
- Rilling, J. K. , & Sanfey, A. G. (2011). The neuroscience of social decision‐making. Annual Review of Psychology, 62, 23–48. https://doi.org/10.1146/annurev.psych.121208.131647. [DOI] [PubMed] [Google Scholar]
- Scott, S. G. , & Bruce, R. A. (1995). Decision‐making style: The development and assessment of a new measure. Educational and Psychological Measurement, 55(5), 818–831. [Google Scholar]
- Sevdalis, N. , Petrides, K. V. , & Harvey, N. (2007). Trait emotional intelligence and decision‐related emotions. Personality and Individual Differences, 42, 1347–1358. https://doi.org/10.1016/j.paid.2006.10.012. [Google Scholar]
- Spicer, D. P. , & Sadler‐Smith, E. (2005). An examination of the general decision making style in two UK samples. Journal of Managerial Psychology, 20(2), 137–149. https://doi.org/10.1108/02683940510579777. [Google Scholar]
- Steel, P. (2007). The nature of procrastination: A meta‐analytic and theoretical review of quintessential self‐regulatory failure. Psychological Bulletin, 133, 65–94. https://doi.org/10.1037/0033-2909.133.1.65. [DOI] [PubMed] [Google Scholar]
- Strough, J. , Parker, A. M. , & Bruine de Bruin, W. (2015). Understanding life‐span developmental changes in decision‐making competence In Hess T. M., Strough J., & Löckenhoff C. E. (Eds.), Aging and decision making empirical and applied perspectives (, pp. 235–257). Amsterdam: Elsevier. [Google Scholar]
- Strough, J. , Schlosnagle, L. , Karns, T. , Lemaster, P. , & Pichayayothin, N. (2014). No time to waste: Restricting life‐span temporal horizons decrease the sunk‐cost fallacy. Journal of Behavioral Decision Making, 27, 78–94. https://doi.org/10.1002/bdm.1781. [Google Scholar]
- Telle, N. T. , Senior, C. , & Butler, M. (2011). Trait emotional intelligence facilitates responses to a social gambling task. Personality and Individual Differences, 50, 523–526. https://doi.org/10.1016/j.paid.2010.11.010. [Google Scholar]
- Tetlock, P. E. (1985). Accountability: The neglected social context of judgment and choice In Staw B., & Cummings L. (Eds.), Research in organizational behavior ( Vol. 1, pp. 297–332). Greenvich, CT: JAI Press. [Google Scholar]
- Thunholm, P. O. (2004). Decision‐making styles: Habit, style or both? Personality and Individual Differences, 36, 931–944. [Google Scholar]
- Usunier, J.‐C. , & Vallette‐Florence, P. (2007). The Time Styles Scale: A review of developments and replications over 15 years. Time & Society, 16, 333–366. https://doi.org/10.1177/0961463X07080272. [Google Scholar]
- Vohs, K. D. , Baumeister, R. F. , & Ciarocco, N. J. (2005). Self‐regulation and self‐presentation: Regulatory resource depletion impairs impression management and effortful self‐presentation depletes regulatory resources. Journal of Personality and Social Psychology, 88(4), 632–657. https://doi.org/10.1037/0022-3514.88.4.632. [DOI] [PubMed] [Google Scholar]
- Wittmann, M. , & Paulus, M. P. (2008). Decision making, impulsivity and time perception. Trends in Cognitive Sciences, 12, 7–12. https://doi.org/10.1016/j.tics.2007.10.004. [DOI] [PubMed] [Google Scholar]
- Wood, N. L. , & Highhouse, S. (2014). Do self‐reported decision‐styles relate with others' impressions of decision quality? Personality and Individual Differences, 70, 224–228. https://doi.org/10.1016/j.paid.2014.06.036. [Google Scholar]
- Zimbardo, P. G. , & Boyd, J. N. (1999). Putting time in perspective: A valid, reliable individual‐differences metric. Journal of Personality and Social Psychology, 77, 1271–1288. https://doi.org/10.1037/0022-3514.77.6.1271. [Google Scholar]