

Abstract
Background
Blocking muscarinic receptors could have an effect on cardiac function, especially among elderly patients with overactive bladder (OAB).
Study Objective
To investigate the risk of cardiovascular (CV) events in users of antimuscarinic drugs to treat OAB.
Design, Setting, and Participants
Cohort study of new users of darifenacin, fesoterodine, oxybutynin, solifenacin, tolterodine, or trospium, 18 years or older, in the United Kingdom's Clinical Practice Research Datalink (CPRD), 2004–2012.
Outcome Measurements and Main Results
Using tolterodine as the reference, we estimated propensity‐score–stratified incidence rate ratios (IRRs) for acute myocardial infarction, stroke, CV mortality, major adverse cardiac events (MACE, a combined end point of the previous three), and all‐cause death for individual antimuscarinic drugs. The study cohort included 119,912 new users of OAB drugs. The mean age at cohort entry was 62 years, 70% were female, and the mean follow‐up was 3.3 years. The adjusted IRR for MACE and current use of oxybutynin compared with current use of tolterodine was 1.14 (95% confidence interval [CI] 1.01–1.30). In contrast, the IRR was 0.65 (CI 0.56–0.76) for current use of solifenacin compared with tolterodine. In this study, performed with health care data, the distribution of risk factors was relatively similar across users of different OAB drugs and, although our analyses controlled for a range of measured potential confounders, residual confounding cannot be ruled out.
Conclusions
In an observational comparative study of users of medications to treat OAB conducted in routine clinical practice, the risk for CV side effects was increased in users of oxybutynin and decreased in users of solifenacin compared with users of tolterodine.
Keywords: United Kingdom, pharmacoepidemiology, urinary bladder, overactive, cardiovascular diseases, muscarinic antagonists
Overactive bladder syndrome (OAB) is defined as urgency with or without urge incontinence, usually experienced with frequency and nocturia.1 The prevalence of urge urinary incontinence has been reported to be as high as 36% depending on the country, age, and tool used to measure it.2 The European Prospective Investigation in Cancer and Nutrition (EPIC) study used a single tool to assess prevalence rates of OAB in persons 18 years or older in Canada, Germany, Italy, Sweden, and the United Kingdom. The overall prevalence of OAB was 12%.3
Antimuscarinic drugs have for a long time been the only drug class used in the treatment of OAB and continue to be the first line of pharmacologic treatment for OAB in the United Kingdom.4, 5, 6 They interact with muscarinic receptors in the bladder detrusor and urothelium, leading to decreased bladder afferent activity and resulting in reduced urgency sensation and other OAB symptoms.7, 8 Muscarinic receptors are present throughout the body. Blocking them could affect cardiac function, especially in elderly patients with OAB who are more likely to have cardiovascular (CV) comorbidities and risk factors. Adverse cardiac effects potentially associated with use of some antimuscarinic drugs include increased heart rate and QT interval prolongation.9 Increasing resting heart rate was associated with increased overall morbidity and mortality, particularly in patients with CV disease.10 Literature reviews on the safety of antimuscarinic drugs to treat OAB do not report on their CV safety.11, 12 However, inhaled anticholinergic drugs were associated with an increased risk for CV events in patients with chronic obstructive pulmonary disease,13 but this effect may not be directly applicable to the population with OAB, a common condition that is not life threatening.
Antimuscarinic drugs used to treat OAB differ in their selectivity for muscarinic receptors M1–M5 and in their ability to cross the blood‐brain barrier.10, 14 These differences result in somewhat different effectiveness and safety profiles. Although these drugs are thought to have a safe CV profile, the comparative CV safety of antimuscarinic drugs used to treat OAB is currently being studied.15
Objective
To investigate the extent to which the risk of acute myocardial infarction (AMI), stroke, CV mortality, composite major adverse CV events (MACE, inclusive of nonfatal AMI, nonfatal stroke, or CV mortality), and all‐cause mortality differed by antimuscarinic drug used for the treatment of OAB.
Material (Patients) and Methods
Design, Setting, and Participants
We conducted a retrospective cohort study with health care data from the United Kingdom's Clinical Practice Research Datalink (CPRD) for patients newly prescribed specified antimuscarinics to treat OAB. This study was undertaken to obtain background data before a larger postapproval safety study requested by the health authorities for mirabegron, a β‐3 adrenergic agonist indicated for the treatment of symptomatic OAB. Data will be analyzed in 2019.
The CPRD is a governmental not‐for‐profit research service, jointly funded by the United Kingdom's National Institute for Health Research and the Medicines and Healthcare products Regulatory Agency, a part of the Department of Health. The CPRD contains information recorded by primary health care practitioners as part of their routine clinical practice in the country (http://www.cprd.com/intro.asp) and is considered a valuable source of longitudinal medical information routinely used for epidemiological research.16 The CPRD covers ~8% of the UK population and includes ~5.7 million active individuals who are alive and currently contributing data to the database; 13.2 million individuals have been part of the CPRD at some point.17 Core data are stored in the General Practitioner Online Database (GOLD) that includes information on diagnoses, symptoms, referrals, tests ordered, test results, prescriptions issued, and additional clinical information obtained from general practices. Approximately half of the practices permit linkage with external data sources—Hospital Episode Statistics (HES) hospitalization data and the Office for National Statistics (ONS) mortality data.
The study period was January 1, 2004, through December 31, 2012. Patients in the study had at least 12 months of continuous enrollment in the database, followed by an index prescription (cohort entry date) for darifenacin, fesoterodine, oxybutynin, solifenacin, tolterodine, or trospium. To qualify as an index prescription, the patient could not have received a prescription for the same agent during the previous 12 months (but could have received a prescription for another agent). All patients were 18 years or older at the time of the index prescription. Patients were excluded if they had a diagnosis of cancer other than nonmelanoma skin cancer or had a diagnosis of or treatment for human immunodeficiency virus (HIV) infection before cohort entry.
Follow‐up started on the cohort entry date (index prescription) and finished at the end of the study period, end of data collection for the practice, death, emigration, cancer diagnosis (except nonmelanoma skin cancer), diagnosis of or treatment for HIV infection, or a cardiovascular event, whichever came first. For the individual end points, person‐time at risk accumulated until the date of occurrence of the specific end point; for example, the occurrence of stroke in an individual did not terminate follow‐up with respect to AMI. For the composite MACE, follow‐up ended at the first occurrence of any of its components. This censoring focuses on the risk to the first CV event, eliminating the modifying effect of one CV event on the risk of a subsequent event.
Person‐time was classified based on individual OAB drug prescriptions and defined in a time‐varying manner. Patients could contribute exposed person‐time to different OAB drugs over their follow‐up. Drug therapy episodes of current use of a medication were created by linking consecutive prescriptions for a given drug into a single continuous episode as long as the gap between consecutive prescriptions was not longer than 60 days. A therapy episode then referred to the period of continuous treatment with a given drug plus 7 days added to the end of the last prescription in the episode. The 7 days were added to reflect that patients may have skipped doses and had them at the end of days’ supply and to account for delays between the prescription, issuing, dispensing, and start of use. The end of a therapy episode was defined as the end of treatment with a particular drug or a switch to or addition of another OAB drug. Switches occurred when a patient stopped taking one OAB drug and started taking another OAB drug in an adjacent therapy episode or when a patient was taking more than one OAB drug during a therapy episode and dropped one or more of those drugs while continuing to take the other drug(s). An add‐on treatment occurred when a patient started taking an additional OAB drug while continuing the current OAB therapy. Then the episode of current use of a single medication ends. After an episode of current drug use ended, patients stopped contributing person‐time to this pool until the next eligible episode (if any) started.
Outcome Measurements and Statistical Analysis
We first described the overall cohort and the subsets stratified by drug at cohort entry. We summarized selected baseline characteristics of the study cohort at cohort entry: age, sex, year of cohort entry, risk factors, comorbidities, and year 2010 values of the Index of Multiple Deprivation, a relative measure of several types of deprivation (e.g., health, education, crime, and access to services such as hospitals) in small geographic areas.18
The CV end points of interest were AMI, including out‐of‐hospital coronary heart disease (CHD) deaths; stroke (hemorrhagic or ischemic including cerebrovascular death); CV mortality (including CHD death and cerebrovascular disease death); and all‐cause mortality. We also examined a composite end point, MACE, inclusive of nonfatal AMI, nonfatal stroke, or CV mortality. For practices that permit linkage, all hospital episodes with an International Statistical Classification of Diseases and Related Health Problems, 10th Revision (ICD‐10) code for AMI or stroke as a primary diagnosis were identified and considered to be confirmed cases. The underlying cause of death in ONS mortality data was also used to identify AMI and stroke cases (ICD‐10 codes). For practices not linked to external sources, outcomes were ascertained from general practitioner (GP) records (Read codes) and confirmed through patient profile review and/or questionnaires completed by the GP who cared for the patient.19
We estimated crude and age‐sex–standardized incidence rates (IRs) per 1000 person‐years for current exposure to any OAB drug and to individual OAB drugs using exact 95% confidence intervals (CIs) for the Poisson distribution. The entire follow‐up time of the study cohort from cohort entry date to end of follow‐up was used for standardization.
To compare specific antimuscarinic agents, we estimated propensity score–adjusted incidence rate ratios (IRRs) for individual OAB drugs compared with current use of tolterodine. This drug was selected because it is commonly used both in the United Kingdom and worldwide, making it a suitable comparator with regard to statistical and clinical considerations. For each drug other than tolterodine, we fit models to estimate the propensity for a patient to receive that drug instead of tolterodine, given the patient's characteristics. For each comparison, the propensity score was estimated through logistic regression models using patients exposed to the corresponding OAB medications at cohort entry. These models included terms for sex, age at cohort entry, year at cohort entry, Index of Multiple Deprivation (quintiles), OAB, hypertension (diagnosis codes or medications), diabetes (diagnosis codes or medications), smoking, history of AMI, history of stroke, history of transient ischemic attack, history of CHD, history of heart failure, history of peripheral artery disease or peripheral vascular disease, dyslipidemia, atrial fibrillation, chronic obstructive pulmonary disease, dementia, hemiplegia or paraplegia, liver disease, peptic ulcer disease, renal disease, dialysis, rheumatologic disease, gout, organ transplantation, menopause (women only), body mass index in the 3 years before cohort entry, obesity treatment, alcohol use, alcohol abuse or alcohol‐related diseases, drug abuse, outpatient visits in the year before cohort entry, hospitalizations in the year before cohort entry, and drug use before cohort entry: hormone replacement therapy (women only), tamoxifen, letrozole, thyroid hormone replacement, digoxin, nitrates and other antianginal drugs, lipid‐lowering drugs, nonaspirin nonsteroidal antiinflammatory drugs, low‐dose aspirin and other antiplatelets, immunosuppressive agents, antiarrhythmic drugs, thrombolytic therapy, and warfarin. Comorbidities were identified using diagnosis codes from all medical history before cohort entry, except where noted otherwise. After trimming the area of nonoverlapping propensity scores (~1% of extreme values in each tail), to remove from the analysis patients who were not comparable,20 patients were grouped into strata defined by deciles of the propensity score distribution in those receiving the alternative treatment to tolterodine at entry. Point estimates and 95% CIs from the deciles were pooled using conventional Mantel‐Haenszel techniques.
The study was designed and implemented in line with the International Society for Pharmacoepidemiology Guidelines for Good Pharmacoepidemiology Practices;21 European Medicines Agency Guidelines on Good Pharmacovigilance Practices (GVP), Module VIII – Post‐Authorisation Safety Studies;22 the European Network of Centres for Pharmacoepidemiology and Pharmacovigilance Guide on Methodological Standards in Pharmacoepidemiology;23 and the Food and Drug Administration's Best Practices for Conducting and Reporting Pharmacoepidemiologic Safety Studies Using Electronic Healthcare Data Guidance 24 and was judged to be exempt from review by the RTI International institutional review board. The protocol was approved by the CPRD Independent Scientific Advisory Committee (protocol number 13_142A). The protocol for this study was registered in the EU PAS Register before the start of the study (EUPAS5529).25
Results
Descriptive Analysis
The study cohort included 119,912 new users of OAB drugs. The mean age at cohort entry was 62 years, 70% of users were female, and the mean follow‐up was 3.3 years (range 1 day to 9 years including person‐time of current use and person‐time of noncurrent use). Of all index therapy episodes, 33% were for oxybutynin, 31% for tolterodine, and 27% for solifenacin. Table 1 shows the characteristics of patients exposed to the different OAB medications.
Table 1.
Characteristics of Exposed Patients, by Index OAB Drug(s)a at Study Cohort Entry
| Variable | Index OAB drug | |||||
|---|---|---|---|---|---|---|
| Darifenacin (n=151) | Fesoterodine (n=2344) | Oxybutynin (n=40,651) | Solifenacin (n=33,120) | Tolterodine (n=37,506) | Trospium (n=6071) | |
| Mean (SD) age at cohort entry, yrs | 65.3 (14.4) | 60.1 (16.5) | 62.8 (17.4) | 61.3 (16.3) | 62.8 (16.3) | 64.1 (16.1) |
| Age range in years at cohort entry, % | ||||||
| 18–24 | n/a | 2.1 | 2.4 | 1.8 | 1.4 | 1.3 |
| 25–34 | n/a | 5.0 | 4.7 | 4.0 | 3.9 | 3.4 |
| 35–44 | 8.6 | 11.3 | 9.6 | 11.0 | 9.7 | 8.8 |
| 45–54 | 13.9 | 18.7 | 14.3 | 17.2 | 15.0 | 13.5 |
| 55–64 | 19.9 | 19.5 | 18.7 | 20.6 | 20.7 | 20.3 |
| 65–74 | 28.5 | 21.8 | 20.6 | 21.1 | 21.6 | 23.0 |
| 75–84 | 21.2 | 16.1 | 20.7 | 17.8 | 20.2 | 21.5 |
| 85+ | 6.0 | 5.4 | 9.0 | 6.5 | 7.5 | 8.4 |
| Sex, % | ||||||
| Male | 29.8 | 29.9 | 32.3 | 26.1 | 31.4 | 30.8 |
| Female | 70.2 | 70.1 | 67.7 | 73.9 | 68.6 | 69.2 |
| Calendar year at cohort entry, % | ||||||
| 2004 | 10.1 | 0.5 | 18.4 | 23.6 | ||
| 2005 | 9.3 | 3.9 | 17.3 | 18.5 | ||
| 2006 | 9.5 | 5.8 | 15.0 | 13.4 | ||
| 2007 | 21.9 | 10.3 | 8.2 | 13.2 | 9.0 | |
| 2008 | 29.1 | 2.4 | 9.9 | 11.4 | 10.6 | 6.7 |
| 2009 | 13.9 | 16.9 | 10.7 | 15.2 | 8.6 | 5.5 |
| 2010 | n/a | 24.1 | 11.5 | 16.9 | 7.0 | 6.3 |
| 2011 | 12.6 | 28.9 | 13.8 | 18.5 | 5.5 | 7.6 |
| 2012 | 19.9 | 27.7 | 14.9 | 19.5 | 4.4 | 9.4 |
| Index of multiple deprivation, % | ||||||
| 1 | 27.2 | 20.6 | 21.0 | 22.0 | 24.2 | 21.3 |
| 2 | 19.2 | 22.2 | 20.3 | 21.1 | 19.9 | 21.5 |
| 3 | 17.9 | 17.6 | 20.5 | 19.5 | 20.1 | 21.8 |
| 4 | 21.9 | 22.8 | 21.6 | 20.0 | 19.4 | 17.3 |
| 5 | 13.9 | 16.8 | 16.6 | 17.3 | 16.4 | 18.1 |
| OABb | 57.6 | 54.1 | 46.6 | 52.2 | 49.8 | 53.2 |
| Hypertension diagnosis codes or medications, % | 83.4 | 79.9 | 80.9 | 80.4 | 80.4 | 82.2 |
| Diabetes diagnosis codes or medications, % | 10.6 | 12.8 | 11.6 | 11.7 | 10.3 | 12.1 |
| Smoking, % | ||||||
| Never | 47.7 | 46.8 | 46.9 | 47.2 | 48.0 | 47.7 |
| Former | 34.4 | 37.2 | 35.5 | 36.4 | 33.9 | 34.5 |
| Current | 16.6 | 15.9 | 16.2 | 16.0 | 16.4 | 15.9 |
| Unknown history | n/a | n/a | 1.4 | 0.4 | 1.7 | 2.0 |
| Alcohol use, % | ||||||
| Nondrinker | 21.9 | 15.9 | 13.8 | 13.5 | 13.3 | 13.8 |
| Low to moderate intake | 49.0 | 52.6 | 51.2 | 54.0 | 51.3 | 51.7 |
| High to very high intake | 19.2 | 16.6 | 18.4 | 18.5 | 18.3 | 17.6 |
| Drinker unknown quantity | 2.0 | 6.3 | 5.9 | 5.5 | 6.3 | 6.3 |
| Unknown history | 7.9 | 8.7 | 10.6 | 8.5 | 10.8 | 10.6 |
| Alcoholism or alcohol‐related diseases, % | 4.0 | 3.7 | 3.1 | 2.9 | 2.7 | 2.8 |
| History of AMI, % | 6.0 | 3.7 | 4.2 | 3.6 | 4.1 | 4.4 |
| History of stroke, % | 9.9 | 7.3 | 7.3 | 6.2 | 6.9 | 8.2 |
| History of transient ischemic attack, % | 6.0 | 4.2 | 4.1 | 3.6 | 4.2 | 5.0 |
| History of CHD, % | 16.6 | 12.2 | 13.1 | 12.2 | 13.2 | 15.1 |
| History of heart failure, % | 6.0 | 2.7 | 3.5 | 2.6 | 3.4 | 3.9 |
| History of peripheral artery disease/Peripheral vascular disease, % | 7.3 | 6.4 | 7.3 | 6.7 | 6.8 | 7.9 |
| Health services utilization, mean (SD) in the year before cohort entry year | ||||||
| Outpatient visits | 12.3 (11.0) | 10.8 (8.5) | 10.8 (9.6) | 10.6 (8.9) | 10.7 (9.5) | 11.5 (9.8) |
| Hospitalizations | 1.0 (1.7) | 0.7 (1.3) | 0.5 (1.4) | 0.6 (1.2) | 0.5 (1.2) | 0.6 (1.2) |
AMI = acute myocardial infarction; CHD = coronary heart; n/a = not applicable; OAB = overactive bladder; SD = standard deviation.
Includes all patients with a qualifying index prescription.
OAB diagnosis per Read codes.
At cohort entry, ~50% of study patients had a diagnostic code for OAB in their medical history, from 47% in users of oxybutynin to 58% in users of darifenacin. Based on diagnostic codes or treatment, at cohort entry 81% of patients had hypertension and 11% had diabetes. For both diagnoses, no substantial variation was found across OAB drugs.
Coronary heart disease was present at cohort entry for 13% of the study cohort overall, 13% of oxybutynin users, 13% of tolterodine users, but 17% of darifenacin users. At cohort entry, 4.0% of the study cohort had experienced an AMI (6.0% of darifenacin users), 4.1% had experienced a transient ischemic attack (6.0% of darifenacin users), and 7.0% had peripheral vascular disease. Approximately 98% of patients had smoking history recorded: 47% were never smokers, 35% were former smokers, and 16% were current smokers. Regarding alcohol consumption, 14% were nondrinkers, 52% had a low or moderate alcohol intake, 18% had a high or very high intake, 5.9% drank an unknown amount of alcohol, and 10% did not have alcohol consumption recorded.
Incidence of Cardiovascular End Points
During follow‐up of the 119,912 new users of OAB drugs, 1983 AMIs, 2184 strokes, and 2097 deaths occurred due to CV causes (1126 CHD deaths and 1007 cerebrovascular disease deaths; both causes could be listed on a patient's death certificate). A total of 4728 patients experienced an event included in the MACE definition, and 9487 died of any cause. For periods of current use of any OAB drug, the age‐sex‐standardized IR was 4.9 (95% CI 4.5–5.3) per 1000 person‐years for AMI, 6.0 (CI 5.6–6.4) for stroke, 4.5 (CI 4.2–4.9) for CV mortality, 12.2 (CI 11.6–12.8) for MACE, and 19.9 (CI 19.1–20.6) for all‐cause mortality. Crude and standardized IRs for CV outcomes, by current exposure to individual OAB medications, are detailed in Table 2.
Table 2.
Person‐time, Frequency, and Incidence Rates (per 1000 Person‐Years) for Cardiovascular Outcomes, by Current Exposure to Overactive Bladder
| Events | Individuals contributing person‐time | Person‐time, yrs | Crude incidence rate | (95% CI)a | Standardized incidence rateb | (95% CI) | |
|---|---|---|---|---|---|---|---|
| AMI, with current exposure to | |||||||
| Any OAB drug | 663 | 119,912 | 124,226 | 5.34 | (4.94–5.76) | 4.90 | (4.53–5.29) |
| Darifenacin | 1 | 647 | 447 | 2.24 | (0.06–12.45) | 2.45 | (0.06–13.67) |
| Fesoterodine | 13 | 5879 | 3491 | 3.72 | (1.98–6.37) | 3.95 | (2.08–6.79) |
| Oxybutynin | 214 | 50,440 | 31,420 | 6.81 | (5.93–7.79) | 5.94 | (5.16–6.80) |
| Solifenacin | 165 | 48,718 | 41,824 | 3.95 | (3.37–4.60) | 4.00 | (3.41–4.67) |
| Tolterodine | 241 | 46,641 | 41,292 | 5.84 | (5.12–6.62) | 5.01 | (4.39–5.68) |
| Trospium | 49 | 11,088 | 7927 | 6.18 | (4.57–8.17) | 5.58 | (4.11–7.39) |
| Stroke, with current exposure to | |||||||
| Any OAB drug | 818 | 119,912 | 124,028 | 6.60 | (6.15–7.06) | 6.00 | (5.60–6.43) |
| Darifenacin | 3 | 644 | 443 | 6.77 | (1.40–19.78) | 5.11 | (1.01–15.06) |
| Fesoterodine | 11 | 5874 | 3482 | 3.16 | (1.58–5.65) | 3.47 | (1.71–6.23) |
| Oxybutynin | 251 | 50,410 | 31,367 | 8.00 | (7.04–9.06) | 6.76 | (5.94–7.65) |
| Solifenacin | 212 | 48,703 | 41,752 | 5.08 | (4.42–5.81) | 5.12 | (4.45–5.87) |
| Tolterodine | 299 | 46,628 | 41,251 | 7.25 | (6.45–8.12) | 6.34 | (5.63–7.10) |
| Trospium | 57 | 11,071 | 7902 | 7.21 | (5.46–9.35) | 6.54 | (4.94–8.49) |
| Cardiovascular death, with current exposure to | |||||||
| Any OAB drug | 630 | 119,912 | 124,917 | 5.04 | (4.66–5.45) | 4.53 | (4.18–4.90) |
| Darifenacin | 2 | 648 | 448 | 4.47 | (0.54–16.14) | 4.70 | (0.50–17.16) |
| Fesoterodine | 10 | 5893 | 3503 | 2.85 | (1.37–5.25) | 3.24 | (1.54–5.97) |
| Oxybutynin | 243 | 50,473 | 31,591 | 7.69 | (6.76–8.72) | 6.37 | (5.59–7.24) |
| Solifenacin | 100 | 48,790 | 42,039 | 2.38 | (1.94–2.89) | 2.43 | (1.98–2.96) |
| Tolterodine | 234 | 46,655 | 41,541 | 5.63 | (4.93–6.40) | 4.71 | (4.13–5.36) |
| Trospium | 53 | 11,102 | 7981 | 6.64 | (4.97–8.69) | 5.79 | (4.33–7.59) |
| MACE, with current exposure to | |||||||
| Any OAB drug | 1644 | 119,912 | 123,356 | 13.33 | (12.69–13.99) | 12.19 | (11.61–12.80) |
| Darifenacin | 6 | 643 | 443 | 13.55 | (4.97–29.49) | 12.31 | (4.32–27.16) |
| Fesoterodine | 27 | 5860 | 3470 | 7.78 | (5.13–11.32) | 8.47 | (5.55–12.36) |
| Oxybutynin | 521 | 50,378 | 31,199 | 16.70 | (15.30–18.20) | 14.32 | (13.10–15.62) |
| Solifenacin | 400 | 48,633 | 41,542 | 9.63 | (8.71–10.62) | 9.82 | (8.88–10.84) |
| Tolterodine | 599 | 46,614 | 41,012 | 14.61 | (13.46–15.82) | 12.63 | (11.63–13.69) |
| Trospium | 126 | 11,058 | 7848 | 16.05 | (13.37–19.11) | 14.52 | (12.07–17.31) |
| All‐cause mortality, with current exposure to | |||||||
| Any OAB drug | 2744 | 119,912 | 124,917 | 21.97 | (21.15–22.80) | 19.87 | (19.13–20.63) |
| Darifenacin | 7 | 648 | 448 | 15.64 | (6.29–32.22) | 16.31 | (6.13–34.38) |
| Fesoterodine | 35 | 5893 | 3503 | 9.99 | (6.96–13.89) | 11.85 | (8.21–16.54) |
| Oxybutynin | 969 | 50,473 | 31,591 | 30.67 | (28.77–32.67) | 25.61 | (24.00–27.30) |
| Solifenacin | 620 | 48,790 | 42,039 | 14.75 | (13.61–15.96) | 15.37 | (14.18–16.64) |
| Tolterodine | 940 | 46,655 | 41,541 | 22.63 | (21.20–24.12) | 19.21 | (18.00–20.49) |
| Trospium | 212 | 11,102 | 7981 | 26.56 | (23.11–30.39) | 23.42 | (20.35–26.82) |
AMI = acute myocardial infarction; CI = confidence interval; MACE = major adverse cardiac events; OAB = overactive bladder.
Confidence intervals for the crude incidence rates were calculated using exact Poisson methods.
Overall results were standardized to the sex and age distribution of the study cohort person‐years; sex‐specific results were standardized to the sex‐specific age distribution of the study cohort person‐years.
Comparative Analysis
Table 3 shows the effect of current use of oxybutynin, solifenacin, and trospium compared with current use of tolterodine for the five CV end points as IRRs estimated from the propensity score analysis. The use of darifenacin and fesoterodine was insufficient to estimate propensity score–adjusted IRRs.
Table 3.
Adjusted Incidence Rate Ratio for Current Exposure to Individual OAB Drugs Compared with Current Use of Tolterodine (Propensity Score Analysis)
| End point | Current exposure | |||
|---|---|---|---|---|
| Oxybutynin | Solifenacin | Tolterodine | Trospium | |
| AMI | 1.20 (0.98‐1.46) | 0.64 (0.50–0.82) | Ref. | 0.93 (0.64–1.35) |
| Stroke | 1.12 (0.94–1.34) | 0.70 (0.56–0.88) | Ref. | 0.96 (0.70–1.33) |
| Coronary heart disease death | 1.36 (1.05–1.75) | 0.49 (0.33–0.71) | Ref. | 1.15 (0.73–1.80) |
| Cerebrovascular disease death | 1.37 (1.03–1.82) | 0.45 (0.28–0.73) | Ref. | 0.86 (0.49–1.49) |
| Cardiovascular mortality | 1.34 (1.11–1.62) | 0.46 (0.34–0.62) | Ref. | 1.02 (0.72–1.45) |
| MACE | 1.14 (1.01–1.30) | 0.65 (0.56–0.76) | Ref. | 1.03 (0.82–1.29) |
| Overall mortality | 1.26 (1.14–1.38) | 0.68 (0.60–0.77) | Ref. | 1.12 (0.94–1.33) |
The propensity score was estimated through logistic regression using patients who experienced single exposure to each drug other than tolterodine at cohort entry. These models adjusted for age at cohort entry, sex, calendar year at cohort entry, and a number of comorbidities and exposure to medications. After trimming ~1% of extreme values in each tail, patients were grouped into propensity score strata defined by deciles of the propensity score distribution in patients receiving the comparison (as opposed to the reference) medication at entry. Stratified incidence rate ratios estimated in propensity score analyses were calculated using the Mantel‐Haenszel approach.
AMI = acute myocardial infarction; MACE = major adverse cardiovascular event; OAB = overactive bladder; Ref. = reference.
The point estimates for the IRRs for AMI, stroke, CV mortality, MACE, and all‐cause mortality for current exposure to oxybutynin versus tolterodine were consistently greater than 1 (Figure 1). In contrast, the point estimates for IRRs for AMI, stroke, CV mortality, MACE, and all‐cause mortality for current exposure to solifenacin, compared with current use of tolterodine, were all lower than 1 (Figure 2). Compared with current use of tolterodine, a 14% increase was noted in the risk of MACE for current use of oxybutynin (adjusted IRR 1.14, 95% CI 1.01–1.30) and a 50% reduction in the risk of MACE for current use of solifenacin (IRR 0.65, CI 0.56–0.76). Incidence rate ratios for trospium were all near 1, with no other consistent pattern.
Figure 1.
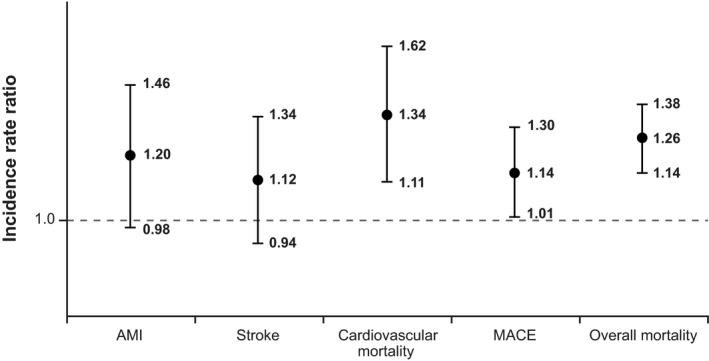
Propensity score–stratified analysis comparing current use of oxybutynin against current use of tolterodine. AMI = acute myocardial infarction; MACE = major adverse cardiovascular event. Vertical bars represent 95% confidence intervals around the incidence rate ratios.
Figure 2.
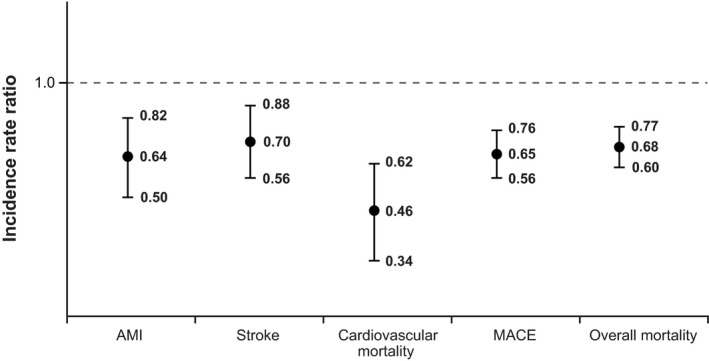
Propensity score–stratified analysis comparing current use of solifenacin against current use of tolterodine. AMI = acute myocardial infarction; MACE = major adverse cardiovascular event. Vertical bars represent 95% confidence intervals around the incidence rate ratios.
Discussion
In our study, current use of oxybutynin was associated with increased risk for CV outcomes in comparison with current use of tolterodine. Current use of solifenacin was associated with a lower risk for CV outcomes.
Patients with OAB have a larger prevalence of CV comorbidities than persons without such a diagnosis,26 and the prevalence of OAB and CV comorbidity increase with age. Further, it was suggested that treated patients with OAB may have an increased CV risk compared with untreated patients with OAB.27, 28 In our population, the distribution of CV risk factors was relatively similar across users of different OAB drugs. To control for residual differences in these factors that could confound our comparative results, we estimated propensity score–adjusted IRRs. A limitation of the study is that due to the low prevalence of use of darifenacin and fesoterodine (0.1% and 2%, respectively), standardized IRs were imprecise, and we could not estimate propensity score–adjusted IRRs.
Studies in large health care utilization databases like this one allow the assessment of safety outcomes in routine clinical practice; however, a limitation is inherent in the data sources. Because the data include records from health care in a routine clinical care setting, they contain administrative and coding errors, such as duplicated prescription records, that are likely due to repeated issue‐and‐print orders at the GP office at the time of patient visits. Diagnoses are recorded to the extent that GPs consider them necessary for their clinical activity. Non‐life‐threatening conditions are sometimes underrecorded, as is the case with the diagnosis of OAB. Exposure information, including drug‐use and treatment patterns, was derived from prescriptions issued that the patient might not have filled and followed. Therapy episodes of current use after prescriptions of OABs were based on published information on OAB use, but we may not have captured the reality of drug treatments.29 Prescriptions in electronic medical records (just like filled or reimbursed prescriptions in other sources of data used in observational studies) do not provide information on whether a drug was discontinued before the end of the days’ supply or continued after the end of the days’ supply. Thus we rely on assumptions and indirect methods to obtain this information, such as incorporating a 7‐day extension of current use or requiring gaps longer than 60 days to consider a therapy discontinued.
We used three sources of information to identify CV end points: HES and ONS, for practices that allow linkage to these data, and CPRD GOLD data for nonlinked practices. Case identification of CV end points recorded in the CPRD were evaluated in previous studies. The positive predictive value (PPV) for AMI cases ascertained by primary discharge diagnosis ICD‐10 codes in HES was reported to be 92%.30 Studies using CPRD GP information only also showed high PPVs31, 32, 33 for AMI and for ischemic and hemorrhagic stroke.34, 35, 36 In our study, we validated CV end points identified in GP information. The PPVs were higher than 80%.19 For overall mortality, we studied a sample of 146 patients without linkage to HES or ONS with records indicating they had died but had no diagnosis codes for AMI or stroke. All of them were confirmed dead through questionnaires filled out by their GPs. In a sample of 149 patients with no death, AMI, or stroke records, we asked GPs if the patients had died, and no death was reported.19
Antimuscarinic drugs increase heart rate and duration of the QT interval that are not well captured in the data source. To overcome this limitation, we focused on hard end points, AMI, stroke, CV death, and all‐cause death because increased heart rate was associated with increased CV morbidity and mortality.10, 37
In our study, the IRRs for AMI, stroke, MACE, overall mortality, and CV mortality for current exposure to oxybutynin compared with current exposure to tolterodine all indicated positive effects on CV risk. In contrast, point estimates for the IRRs for AMI, stroke, MACE, overall mortality, and CV mortality for current exposure to solifenacin relative to tolterodine were in the opposite direction. Lower IRRs for CV end points for solifenacin in comparison with tolterodine were also observed in a Swedish cohort study38 with the same design as this one, but not in a similar study conducted in Denmark, where the risk of the targeted CV end points was similar across individual OAB drugs and did not indicate a consistently increased risk for any individual OAB drug.15 In the Nordic countries, use of oxybutynin is minimal and insufficient to study its effects on CV end points.15, 29, 38 The fact that results are not consistent across these populations in observational studies, together with unclear safety results from in vitro studies and randomized clinical trials,9, 10 precludes us from making recommendations to modify clinical practice.
This set of studies has produced two valuable contributions. First, none of the study drugs seem to be markedly and consistently harmful or safer, and second, the observed safety results vary across populations despite the common protocol used by these studies. The Danish and Swedish health care systems and data sources are similar, and both differ from the UK health care system and data source. Exposure data in the Danish and Swedish study were derived from dispensed prescriptions and from issued prescriptions in this study. Duration of use was estimated using the waiting‐time distribution method in Denmark,39 the dispensed number of daily defined doses in Sweden,40 and the recorded days’ supply in the CPRD. Despite these differences, patterns of drug utilization were similar in the three populations.29 In the Danish and Swedish studies, data sources included outpatient visits to hospitals and hospitalizations, whereas in the present study, data sources also include primary care, and hospitalization data are available for a part of the population. We could not identify differences in patient characteristics that would explain the differences in safety results across populations. None of these studies could assess genetic differences or exposure to over‐the‐counter medications.
Conclusion
In this retrospective cohort study of new users of OAB medications, the risk of AMI, stroke, CV mortality, and all‐cause mortality, compared with tolterodine, was increased in users of oxybutynin and decreased in users of solifenacin.
Acknowledgments
We thank Adele Monroe, John Forbes, and Whitney Krueger from RTI Health Solutions for their help preparing the manuscript, and Stefan de Vogel and Willem Jan Atsma from Astellas for their input during the study. We also thank Arlene Gallagher, senior researcher at Medicines and Healthcare Products Regulatory Agency, the technical contact with RTI Health Solutions for data from the Clinical Practice Research Datalink; the entire CPRD team for the support provided during design and conduct of the study; and all GPs who contributed data to the CPRD.
Supported by Astellas Pharma Global Development, Inc.
Conflict(s) of interest: The study was funded by Astellas Pharma Global Development. Alejandro Arana, Andrea V. Margulis, Lisa J. McQuay, Ryan Ziemiecki, Jennifer L. Bartsch, Kenneth J. Rothman, and Susana Perez‐Gutthann are employees of RTI International, an independent nonprofit research organization that does work for government agencies and pharmaceutical companies. Cristina Varas‐Lorenzo was an employee of RTI International, now retired. Milbhor D'Silva, Billy Franks, and Kwame Appenteng are employees of Astellas Pharma Global Development, the sponsors and funders of this study. The contract provides the RTI‐HS research team independent publication rights. The sponsor provided input on the study design but had no role in data collection or analysis. All authors had full access to all of the data (including statistical reports and tables) and take responsibility for the integrity and accuracy of the data analysis and results. In line with the Guidance on Good Pharmacovigilance Practices (GVP): Module VIII, of the European Medicines Agency, the sponsor reviewed the manuscript and provided comments, but the authors made final decisions regarding its content and submission.
Conference Presentation: Selected parts of these results were included in a poster presentation at the 32nd International Conference on Pharmacoepidemiology and Therapeutic Risk Management; August 25–28, 2016, Dublin, Ireland.
References
- 1. Abrams P, Cardozo L, Fall M, et al. The standardisation of terminology in lower urinary tract function: report from the standardisation sub‐committee of the International Continence Society. Urology 2003;61:37–49. [DOI] [PubMed] [Google Scholar]
- 2. Milsom I, Coyne KS, Nicholson S, Kvasz M, Chen CI, Wein AJ. Global prevalence and economic burden of urgency urinary incontinence: a systematic review. Eur Urol 2014;65:79–95. [DOI] [PubMed] [Google Scholar]
- 3. Irwin DE, Milsom I, Hunskaar S, et al. Population‐based survey of urinary incontinence, overactive bladder, and other lower urinary tract symptoms in five countries: results of the EPIC study. Eur Urol 2006;50:1306–14; discussion 14–15. [DOI] [PubMed] [Google Scholar]
- 4. National Institute for Health and Clinical Excellence . Managing overactive bladder in women. National Institute for Health and Clinical Excellence; July 20, 2017. Available from http://pathways.nice.org.uk/pathways/urinary-incontinence-in-women. Accessed January 26, 2018. [Google Scholar]
- 5. Groen J, Pannek J, Castro Diaz D, et al. Summary of European Association of Urology (EAU) Guidelines on Neuro‐Urology. Eur Urol 2016;69:324–33. [DOI] [PubMed] [Google Scholar]
- 6. National Institute for Health and Clinical Excellence . Managing lower urinary tract symptoms in men. National Institute for Health and Clinical Excellence; October 20, 2017. Available from http://pathways.nice.org.uk/pathways/lower-urinary-tract-symptoms-in-men. Accessed January 26, 2018. [Google Scholar]
- 7. Finney SM, Andersson KE, Gillespie JI, Stewart LH. Antimuscarinic drugs in detrusor overactivity and the overactive bladder syndrome: motor or sensory actions? BJU Int 2006;98:503–7. [DOI] [PubMed] [Google Scholar]
- 8. Yamaguchi O. Latest treatment for lower urinary tract dysfunction: therapeutic agents and mechanism of action. Int J Urol 2013;20:28–39. [DOI] [PubMed] [Google Scholar]
- 9. Rosa GM, Bauckneht M, Scala C, et al. Cardiovascular effects of antimuscarinic agents in overactive bladder. Expert Opin Drug Saf 2013;12:815–27. [DOI] [PubMed] [Google Scholar]
- 10. Andersson KE, Campeau L, Olshansky B. Cardiac effects of muscarinic receptor antagonists used for voiding dysfunction. Br J Clin Pharmacol 2011;72:186–96. [DOI] [PMC free article] [PubMed] [Google Scholar]
- 11. Chapple CR, Khullar V, Gabriel Z, Muston D, Bitoun CE, Weinstein D. The effects of antimuscarinic treatments in overactive bladder: an update of a systematic review and meta‐analysis. Eur Urol 2008;54:543–62. [DOI] [PubMed] [Google Scholar]
- 12. Corcos J, Przydacz M, Campeau L, et al. CUA guideline on adult overactive bladder. Can Urol Assoc J 2017;11:E142–73. [DOI] [PMC free article] [PubMed] [Google Scholar]
- 13. Singh S, Loke YK, Furberg CD. Inhaled anticholinergics and risk of major adverse cardiovascular events in patients with chronic obstructive pulmonary disease: a systematic review and meta‐analysis. JAMA 2008;300:1439–50. [DOI] [PubMed] [Google Scholar]
- 14. Andersson KE. Antimuscarinics for treatment of overactive bladder. Lancet Neurol 2004;3:46–53. [DOI] [PubMed] [Google Scholar]
- 15. Margulis AV, Hallas J, Pottegard A, et al. Comparison of cardiovascular events among treatments for overactive bladder: a Danish nationwide cohort study. Eur J Clin Pharmacol 2018;74:193–9. [DOI] [PubMed] [Google Scholar]
- 16. Khan NF, Harrison SE, Rose PW. Validity of diagnostic coding within the General Practice Research Database: a systematic review. Br J Gen Pract 2010;60:e128–36. [DOI] [PMC free article] [PubMed] [Google Scholar]
- 17. Independent Scientific Advisory Committee . ISAC for Medicines and Healthcare products Regulatory Agency (MHRA) database research Annual Report, Jan 2014 to Dec 2014. 2015. Available from https://www.gov.uk/government/uploads/system/uploads/attachment_data/file/580497/2014_annual_report.pdf. Accessed March 23, 2017.
- 18. Office for National Statistics . Using indices of deprivation in the United Kingdom: guidance paper. Department for Communities and Local Government, The Scottish Government, Northern Ireland Statistics & Research Agency, Llywodraeth Cymru Welsh Government; 2014. Available from http://www.neighbourhood.statistics.gov.uk/HTMLDocs/images/UK%20wide%20guidance%20paper%20December%202014_tcm97-148683.pdf. Accessed August 18, 2015.
- 19. Margulis A, Varas‐Lorenzo C, Bui C, et al. Validation of cardiovascular events and covariates in CPRD GOLD using questionnaires to general practitioners (GPs). Pharmacoepidemiol Drug Saf 2016;25(Suppl 3):S255–6. [Google Scholar]
- 20. Schneeweiss S. A basic study design for expedited safety signal evaluation based on electronic healthcare data. Pharmacoepidemiol Drug Saf 2010;19:858–68. [DOI] [PMC free article] [PubMed] [Google Scholar]
- 21. ISPE . Guidelines for good pharmacoepidemiology practices (GPP). Revision 3. Bethesda, MD: International Society for Pharmacoepidemiology; 2015. Available from http://www.pharmacoepi.org/resources/guidelines_08027.cfm. Accessed May 23, 2016. [Google Scholar]
- 22. EMA . Guideline on good pharmacovigilance practices (GVP). Module VIII – Post‐authorisation safety studies (EMA/813938/2011 Rev 2* Corr**). European Medicines Agency; 04 August 2016. Available from http://www.ema.europa.eu/docs/en_GB/document_library/Scientific_guideline/2012/06/WC500129137.pdf. Accessed May 26, 2017.
- 23. ENCePP . Guide on methodological standards in pharmacoepidemiology (EMA/95098/2010 Rev.5). London, UK: European Network of Centres for Pharmacoepidemiology and Pharmacovigilance; 2016. [Google Scholar]
- 24. Food and Drug Administration . Guidance for industry and FDA staff. Best practices for conducting and reporting pharmacoepidemiologic safety studies using electronic healthcare data. Silver Spring, MD: U.S. Department of Health and Human Services, Food and Drug Administration; 2013. [Google Scholar]
- 25. ENCePP . Post‐authorization safety program—validation of the Clinical Practice Research Datalink for the study of cardiovascular and neoplasm events in users of treatments for overactive bladder. London, UK: European Network of Centres for Pharmacoepidemiology and Pharmacovigilance; 2016. [Google Scholar]
- 26. Hubeaux K, Deffieux X, Raibaut P, Le Breton F, Jousse M, Amarenco G. Evidence for autonomic nervous system dysfunction in females with idiopathic overactive bladder syndrome. Neurourol Urodyn 2011;30:1467–72. [DOI] [PubMed] [Google Scholar]
- 27. Andersson KE, Sarawate C, Kahler KH, Stanley EL, Kulkarni AS. Cardiovascular morbidity, heart rates and use of antimuscarinics in patients with overactive bladder. BJU Int 2010;106:268–74. [DOI] [PubMed] [Google Scholar]
- 28. Asche CV, Kim J, Kulkarni AS, Chakravarti P, Andersson KE. Presence of central nervous system, cardiovascular and overall co‐morbidity burden in patients with overactive bladder disorder in a real‐world setting. BJU Int 2012;109:572–80. [DOI] [PubMed] [Google Scholar]
- 29. Margulis A, Linder M, Arana A, et al. Patterns of use of antimuscarinic drugs to treat overactive bladder in Denmark, Sweden and the United Kingdom. Pharmacoepidemiol Drug Saf 2016;25(Suppl 3):S653. [DOI] [PMC free article] [PubMed] [Google Scholar]
- 30. Herrett E, Shah AD, Boggon R, et al. Completeness and diagnostic validity of recording acute myocardial infarction events in primary care, hospital care, disease registry, and national mortality records: cohort study. BMJ 2013;346:f2350. [DOI] [PMC free article] [PubMed] [Google Scholar]
- 31. Varas‐Lorenzo C, García‐Rodríguez LA, Perez‐Gutthann S, Duque‐Oliart A. Hormone replacement therapy and incidence of acute myocardial infarction. A population‐based nested case‐control study. Circulation 2000;101:2572–8. [DOI] [PubMed] [Google Scholar]
- 32. García Rodríguez LA, Varas‐Lorenzo C, Maguire A, González‐Pérez A. Nonsteroidal antiinflammatory drugs and the risk of myocardial infarction in the general population. Circulation 2004;109:3000–6. [DOI] [PubMed] [Google Scholar]
- 33. Hammad TA, McAdams MA, Feight A, Iyasu S, Dal Pan GJ. Determining the predictive value of Read/OXMIS codes to identify incident acute myocardial infarction in the General Practice Research Database. Pharmacoepidemiol Drug Saf 2008;17:1197–201. [DOI] [PubMed] [Google Scholar]
- 34. Arana A, Varas C, González‐Pérez A, Gutiérrez L, Bjerrum L, García Rodríguez LA. Hormone therapy and cerebrovascular events: a population‐based nested case‐control study. Menopause 2006;13:730–6. [DOI] [PubMed] [Google Scholar]
- 35. Ruigomez A, Martin‐Merino E, Rodríguez LA. Validation of ischemic cerebrovascular diagnoses in the health improvement network (THIN). Pharmacoepidemiol Drug Saf 2010;19:579–85. [DOI] [PubMed] [Google Scholar]
- 36. Gaist D, Wallander MA, González‐Pérez A, García‐Rodríguez LA. Incidence of hemorrhagic stroke in the general population: validation of data from The Health Improvement Network. Pharmacoepidemiol Drug Saf 2013;22:176–82. [DOI] [PubMed] [Google Scholar]
- 37. Zhang Y, Post WS, Dalal D, Blasco‐Colmenares E, Tomaselli GF, Guallar E. QT‐interval duration and mortality rate: results from the Third National Health and Nutrition Examination Survey. Arch Intern Med 2011;171:1727–33. [DOI] [PMC free article] [PubMed] [Google Scholar]
- 38. Linder M, Margulis A, Anveden‐Berglind I, et al. Cardiovascular risk in users of antimuscarinic drugs for overactive bladder: A cohort study in the Swedish National Registers. Pharmacoepidemiol Drug Saf 2016;25(Suppl 3):S491–2. [Google Scholar]
- 39. Stovring H, Pottegard A, Hallas J. Determining prescription durations based on the parametric waiting time distribution. Pharmacoepidemiol Drug Saf 2016;25:1451–9. [DOI] [PubMed] [Google Scholar]
- 40. WHO Collaborating Centre for Drug Statistics Methodology . Definition and general considerations. Oslo, Norway: Norwegian Institute of Public Health; 2016. [Google Scholar]