

Abstract
Purpose
Focal nodular hyperplasia (FNH) and hepatocellular adenoma (HCA) are liver tumors that require different management. We assessed the potential of point shear wave elastography (pSWE) to differentiate FNH from HCA and the interobserver and intraobserver reliability of pSWE in the examination of these lesions and of native liver tissue (NLT).
Methods
The study included 88 patients (65 FNH, 23 HCA). pSWE was performed by two experienced liver sonographers (observers 1 [O1] and 2 [O2]) and acquired within the lesion of interest and NLT. Group differences, optimal cutoff for characterization and interobserver reliability was assessed with Mann‐Whitney‐U, area under the ROC curce (AUROC) and intraclass correlation coefficient (ICC). Intraobserver reliability in NLT was assessed in 20 healthy subjects using ICC.
Results
Median stiffness was significantly higher in FNH than in HCA (7.01 kPa vs 4.98 kPa for O1 (P = 0.017) and 7.68 kPa vs 6.00 kPa for O2 (P = 0.031)). A cutoff point for differentiation between the two entities could not be determined with an AUROC of 0.67 (O1) and 0.69 (O2). Interobserver reliability was good for lesion‐ stiffness (ICC = 0.86) and poor for NLT stiffness (ICC = 0.09). In healthy subjects, intraobserver reliability for NLT‐stiffness was poor for O1 (ICC = 0.23) and moderate for O2 (ICC = 0.62).
Conclusion
This study shows that pSWE cannot reliably differentiate FNH from HCA. Interobserver and intraobserver reliability for pSWE in NLT were insufficient. Interpretation of results gained with this method should be done with great caution.
Keywords: benign liver tumor, focal nodular hyperplasia, hepatocellular adenoma, elastography
1. INTRODUCTION
Focal nodular hyperplasia (FNH) and hepatocellular adenoma (HCA) are two clinically important benign focal liver lesions. Histologically, these two lesions differ. FNH is in fact a pseudotumor with a large part consisting of fibrotic stroma making the lesion stiff, while HCA does not have a substantial fibrotic component and has a consistency similar to that of healthy liver tissue.1
Differentiating between these two lesions is essential because each requires specific management. Follow‐up of FNH is not necessary, provided the correct diagnosis has been made, but HCA often needs to be resected or at least monitored in view of the risk of bleeding or transformation into hepatocellular carcinoma.2, 3 The current standard diagnostic workup includes either contrast‐enhanced ultrasound (CEUS) or contrast‐enhanced MRI (CE‐MRI).4, 5, 6, 7 The estimated sensitivity and specificity of CEUS in the differentiation of FNH from HCA are 67% and 100%, respectively, with a significantly reduced sensitivity in lesions >35 mm.8 For CE‐MRI with hepatocellular specific contrast, the sensitivity is estimated at 91%–100% and the specificity at 87%–100%.9 When the diagnosis remains uncertain, these patients may undergo a tumor biopsy.10 In order to avoid a percutaneous biopsy and the associated risk of complications11 or even the surgical resection of a suspect lesion that turns out to be FNH, improvement of the diagnostic process is needed.
The first ultrasound elastography method for the liver became available in 2003 in the form of transient elastography with the Fibroscan device.12 This method uses a mechanic pulse to measure the stiffness of the liver tissue. In 2008, a new elastography technique named Acoustic Radiation Force Impulse quantification (ARFI®, Siemens) became available and was incorporated in the ultrasound scanner. This method uses ultrasound point shear wave elastography (pSWE) and measures the speed of the shear wave (perpendicular to the axis of the ultrasound beam) in a small region at a selected depth within 80 mm from the skin. Other companies have started to develop similar technologies, including ElastPQ® by Philips Healthcare. pSWE can be used as a noninvasive, reproducible, and easy method of assessing liver fibrosis. A few preliminary studies have shown that pSWE can also be used to measure the stiffness of focal liver lesions such as FNH or HCA and can help in differentiating between these lesions, especially if the lesions are small.13, 14, 15, 16
The primary aim of this study was to assess the diagnostic value of pSWE (ElastPQ®, Phillips Healthcare) in the differentiation between FNH and HCA. We also intended to assess the interobserver and intraobserver reliability of pSWE in the evaluation of these liver lesions and in the native liver tissue (NLT).
2. PATIENTS AND METHODS
This diagnostic study was performed in a tertiary referral center for focal liver lesions and was approved by the accredited local institutional review board.
2.1. Patients with FNH or HCA
Patients diagnosed with FNH or HCA between January 1st 2007 and November 30th 2016 were eligible. All patients who first underwent CEUS and subsequently had either contrast enhanced MRI (CE‐MRI) or biopsy confirming the diagnosis were included. When available, histological diagnosis was considered as the reference standard. In all other cases, the final diagnosis was discussed during a multidisciplinary tumor board (with radiologists, hepatologists and surgeons) and based on the combination of CEUS and CE‐MRI characteristics. Patients who underwent previous intervention for treatment of FNH or HCA or had severe other liver disease (eg, cirrhosis, hepatocellular carcinoma, liver metastasis) were excluded. In addition, women over the age of 50 with an HCA were excluded, as these lesions often regress after menopause.17
We identified potentially eligible patients from the electronic databases of the departments of Gastroenterology and Hepatology and Surgery of the Erasmus MC, Rotterdam. Information on sex, date of birth, date of diagnosis, lesion diameter at diagnosis, CEUS diagnosis, CE‐MRI diagnosis, and histological diagnosis was retrieved from electronic patient records. CEUS and CE‐MRI diagnoses were based on typical imaging characteristics.4, 5, 6, 7 HCA subtype (eg, steatotic, inflammatory, beta‐catenin mutated or unclassified) was based on CE‐MRI7, 18, 19 or biopsy.20 An experienced abdominal radiologist (M.T. with 20 years of experience) reviewed the CE‐MRI examinations of patients in whom HCA subtype was not yet established and determined that subtype.
2.2. Healthy subjects
We asked 20 healthy employees of the department of Gastroenterology & Hepatology and the department of Surgery to volunteer as healthy subjects. Subjects were included if they were male or female, between 20 and 35 years of age and when they were available on the day the measurements took place. Exclusion criteria for healthy subjects were a known liver disease or a systemic disease requiring medication.
2.3. Ultrasound examination and pSWE
We sent an information letter to all eligible patients and later contacted them by telephone to assess whether they were willing to participate in the study. Patients were scheduled for routine ultrasound examination and pSWE at the outpatient clinic of the Gastroenterology and Hepatology department after we received written informed consent. We performed pSWE using the Philips Epiq7 ultrasound system equipped with aa C5‐1 broadband curved‐array (Philips Healthcare Andover, MA). Two experienced liver sonographers (P.T. and R.K., with 25 and 15 years of experience, respectively), hereinafter referred to as observer #1 (O1) and observer #2 (O2), independently performed the measurements in all patients according to the European Federation of Societies for Ultrasound in Medicine and Biology (EFSUMB) guidelines for the performance of elastography.21, 22
In patients with either FNH or HCA, we measured the lesion's size in mm and acquired pSWE measurements from the lesion situated best in the field of view, and preferably the largest lesion. In case there were multiple lesions, we performed the measurements in the lesion situated best in the field of view and preferably the largest lesion. Patients were asked to hold their breath at the moment of the measurement. Each measurement provides a quantitative value of stiffness in kilopascals (kPa). In the analysis, we used the medians of these ten values obtained in the lesion and of the 10 values obtained in the surrounding NLT. Additionally, we calculated the lesion/liver stiffness‐ratio (LLSR).
All healthy subjects were randomly appointed to either O1 or O2. In each of the 10 individuals the sonographers performed two rounds of ten measurements in the NLT at 10‐min intervals.
2.4. Statistical analysis
We used IBM SPSS software version 21.0 (Chicago, Il) for statistical analysis and reported continuous variables as medians and interquartile ranges (IQR) and binary variables as frequencies (n) and percentages (%). We used Mann‐Whitney U test to assess differences for continuous variables and χ2 test for categorical variables. Correlation between variables was analyzed using Pearson product‐moment correlation coefficient. Performance of the ElastPQ was evaluated using receiver operating characteristic (ROC) curves. Interpretation of the ROC curves was based on the area under the ROC Curve (AUROC), which is a value between 0 and 1. The accuracy of the diagnostic test was classified using the following point system: <0.60 fail, 0.60–0.70 poor, 0.70–0.80 fair, 0.80–0.90 good and >0.90 excellent. Interobserver and intraobserver reliabilities were assessed using two‐way mixed effects consistency, single measures intraclass correlation coefficient (ICC) model. Interpretation of the ICC was based on Cohen's kappa, also a value between 0 and 1. Values <0.50 were classified as poor inter‐rater agreement, 0.50–0.75 as moderate, 0.75–0.90 as good and > 0.90 as excellent. A P‐value of <0.05 was considered as the level of significance.
3. RESULTS
3.1. Patients with FNH or HCA
We found 252 patients (244 females and 8 males) with a focal liver lesion eligible to participate in this study as they underwent both CEUS and CE‐MRI or biopsy confirming the diagnosis FNH or HCA. Thirty‐three patients were excluded because they either underwent an intervention or because the lesion was not visible at last follow‐up and 106 patients were excluded because they were either untraceable or did not consent to participation. One patient was deceased (unrelated to liver disease). Finally, we scheduled pSWE for 113 patients and a total of 88 patients (23 with HCA and 65 with FNH) were included in the study at the end (Figure 1). Eight patients were excluded because the lesion was situated too deep for pSWE and 17 because the lesion could not be found anymore during US examination. O1 performed pSWE in all included patients and O2 repeated the measurements in 62 patients (13 HCA and 49 FNH).
Figure 1.
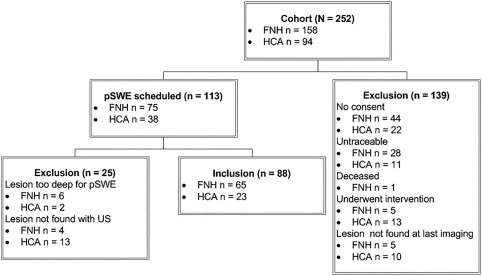
Inclusion flowchart of patients with a focal liver lesion. FNH, focal nodular hyperplasia; HCA, hepatocellular adenoma; pSWE, point shear wave elastography
Eighty‐seven out of 88 patients included were female (Table 1). In the FNH group, the diagnosis was confirmed by CEUS in 56 patients (86.2%), seven lesions were characterized as HCA and in two patients, CEUS could not differentiate between FNH and HCA. CE‐MRI confirmed FNH diagnosis in 61 patients (93.8%). One lesion was initially characterized as HCA and in one patient CE‐MRI could not differentiate between HCA and FNH. Eleven cases of FNH (16.9%) were biopsy proven. In the HCA group, 20 cases (87.0%) were confirmed by CEUS, two were characterized as FNH and in one case CEUS could not differentiate between FNH and HCA. CE‐MRI confirmed HCA diagnosis in 21 patients (91.3%). One case was initially characterized as FNH and another as a different benign liver tumor (angiomyolipoma). Five cases of HCA (21.7%) were biopsy proven.
Table 1.
Baseline characteristics of patients with a focal liver lesion
| FNH (n = 65) | HCA (n = 23) | |
|---|---|---|
| Sex | ||
| Female | 64 | 23 |
| Male | 1 | 0 |
| Age (years) | 41 (34–52) | 43 (33–46) |
| Lesion diameter at diagnosis (mm) | 50 (35–62) | 35 (26–60) |
| Lesion diameter at time of study (mm) | 45 (30–60) | 20 (12–28) |
| Time since diagnosis (months) | 71 (62–81) | 47 (21–76) |
| Diagnosis CEUS | ||
| FNH | 56 (86.2) | 2 (8.7) |
| HCA | 7 (10.8) | 20 (87.0) |
| FNH or HCA | 2 (3.1) | 1 (4.3) |
| Diagnosis at CE‐MRI | ||
| FNH | 61 (93.8) | 1 (4.3) |
| HCA | 1 (1.5) | 21 (91.3) |
| FNH or HCA | 1 (1.5) | 0 |
| Other | 0 | 1 (4.3) |
| Not performed | 2 (3.1) | 0 |
| Histopathologic diagnosis | ||
| Yes | 11 (16.9) | 5 (21.7) |
| No | 54 (83.1) | 18 (78.3) |
Values are given as n (%) or median (IQR).
CE‐MRI, contrast enhanced magnetic resonance imaging; CEUS, contrast enhanced ultrasound; FNH, focal nodular hyperplasia; HCA, hepatocellular adenoma.
We determined the median FNH and HCA stiffness values per observer (Table 2 and Figure 2). For both O1 and O2, the median FNH stiffness value was significantly higher than the HCA stiffness value (7.01 vs 4.98 kPa (P = 0.017) and 7.68 vs 6.00 kPa (P = 0.031), respectively). The median NLT stiffness value for O1 was 2.41 kPa (IQR 1.13–3.45) and 3.50 kPa (2.96–4.45) for O2. For O1, the median LLSR for FNH was 4.00 (IQR 2.05–7.00) and the median LLSR for HCA was 1.35 (IQR 0.84–2.71) (P < 0.001). For O2, these values were 2.44 (IQR 1.52–4.44) for LLSR for FNH and 1.34 (IQR 0.96–1.97) for LLSR for HCA (P = 0.010). No correlation between lesion size and stiffness value was found for both FNHs and HCAs (P > 0.05).
Table 2.
Stiffness values and lesion/liver stiffness ratios for focal nodular hyperplasias and hepatocellular adenomas
| Observer 1 | Observer 2 | |
|---|---|---|
| Stiffness values | ||
| FNH | 7.01 (4.02–13.37) | 7.68 (5.37–12.99) |
| HCA | 4.98 (2.89–7.25) | 6.00 (3.83–7.07) |
| P‐value | 0.017a | 0.031a |
| NLT | 2.41 (1.13–3.45) | 3.50 (2.96–4.45) |
| Lesion/liver stiffness ratios | ||
| FNH | 4.00 (2.05–7.00) | 2.44 (1.52–4.44) |
| HCA | 1.35 (0.84–2.71) | 1.34 (0.96–1.97) |
| P‐value | <0.001a | 0.010a |
Values are given as median (IQR). FNH, focal nodular hyperplasia; HCA, hepatocellular adenoma; NLT, native liver tissue.
Mann‐Whitney U test showed a statistically significant difference in FNH vs HCA stiffness and lesion/liver stiffness ratios for both observers 1 and 2.
Figure 2.
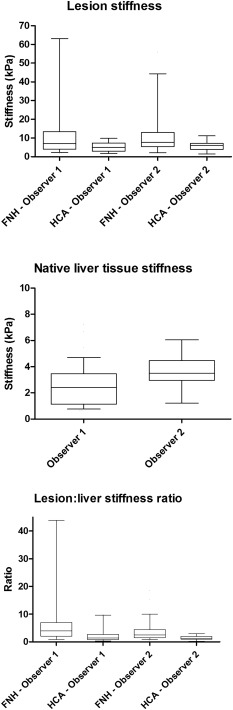
Box‐and‐whisker plots for lesion stiffness, native liver tissue stiffness and lesion:liver stiffness ratio. Box: median and IQR, whiskers: 5–95 percentiles. FNH, focal nodular hyperplasia; HCA, hepatocellular adenoma
ROC analysis for lesion pSWE values showed an AUROC for differentiating FNH from HCA of 0.67 for O1 and 0.69 for O2. Interobserver reliability analysis showed an ICC of 0.86 for lesion stiffness (95%CI: 0.78–0.92), 0.09 for liver stiffness (95%CI: −0.16–0.33) and 0.78 (95%CI: 0.66–0.86) for LLSR. Subgroup analysis based on lesion longest diameter was done in 36 lesions <30 mm (median, 20 mm; IQR, 14–25) and 52 lesions >30 mm (median. 50 mm; IQR, 40–66). It resulted in an ICC for lesions <30 mm of 0.18 (95% CI: 0.24–0.55) and for lesions >30 mm of 0.88 (95% CI: 0.78–0.93).
In 15 patients either the CEUS versus MRI or biopsy diagnosis did not match, or distinction between FNH and HCA could not be made based on that CEUS imaging modality. The stiffness values for these lesions ranged from 1.65 to 8.75 kPa for FNHs and from 1.29 to 9.36 kPa for HCAs.
Fourteen HCAs were classified as inflammatory, four as steatotic and five were unclassified. The median stiffness values for the inflammatory HCAs were 4.99 and 4.46 kPa for O1 and O2, respectively (range, 1.44–10.08), 4.82 and 7.07 kPa, respectively (range, 1.29–20.03) for the steatotic HCAs and 4.98 and 6.10 kPa, respectively (range, 2.11–7.77 kPa) for the unclassified HCA.
3.2. Healthy subjects
Twenty healthy subjects were included. O1 performed pSWE in the NLT of 4 males and 6 females with a median age of 27.5 years (IQR 25.8–28.3). O2 performed pSWE in 5 males and 5 females with a median age of 27.0 years (IQR 23.5–29.0). Intraobserver reliability analysis showed an ICC coefficient of 0.23 (95% CI: 0.13–0.73) and 0.62 (95% CI:0.02–0.89) for O1 and O2, respectively.
4. DISCUSSION
There is a need to improve the noninvasive diagnosis of FNH and HCA in order to avoid overtreatment of FNH and undertreatment of HCA. Due to its benign course, FNH typically does not need treatment or follow‐up. In contrast, a proportion of HCAs do require regular surveillance or treatment in the form of surgical resection because of a risk of complications. Several preliminary studies have shown a possible benefit from pSWE in differentiating between these two benign liver tumors. However, the present study could not confirm the hypothesis that pSWE performed with ElastPQ® can be used to distinguish FNH from HCA. Although median pSWE values were significantly higher in FNHs compared to HCAs, we were unable to determine an acceptable cutoff point for this characterization due to the great variability in pSWE values.
These results are in disagreement with previous studies, which suggested that pSWE was a useful supplementary method to distinguish FNH from HCA during conventional ultrasound. One of these studies was by Gallotti et al.,14 who found a significant difference in pSWE values between FNHs and HCAs. However, they did not try to determine a cutoff point for this differentiation.
We can divide elastography methods in pSWE (as used in this study) and multidimensional shear wave elastography. There are some studies available evaluating the diagnostic value of multidimensional SWE, that did determine a cutoff point for the differentiation. One of these studies was performed by Ronot et al.,23 who found that FNH could be differentiated from other lesions (among which HCA, hemangiomas, focal fatty sparing, cholangiocarcinoma, and hepatocellular carcinoma) with an AUROC of 0.86. Another study by Brunel et al.24 focused only on the characterization of FNH and HCA and found the highest accuracy (95%) with a cutoff stiffness value of 18.8 kPa (AUROC 0.93). The differences between their results and ours might be caused by the use of different software, as both these studies used two‐dimensional SWE (Aixplorer®, SuperSonic Imaging), compared with pSWE (ElastPQ®, Philips Healthcare) in our study.
Another possible explanation for the different results may lie in differences between cohorts. We included patients who were diagnosed with FNH or HCA in the past, whereas the previously mentioned studies23, 24 performed elastography at the moment of diagnosis. This might explain an important difference in patients with HCA. The majority of patients used oral contraceptives at the time of diagnosis and these lesions often spontaneously regress after cessation of these pills.25 We confirmed regression of HCA from 35 mm to 20 mm in a median follow‐up period of 47 months. The influence of this regression process on the lesion stiffness remains unknown. Another remarkable difference between the present study and the study by Brunel et al.24 is the stiffness values for the different HCA‐subtypes. Brunel et al. found higher values in inflammatory HCAs, whereas in our cohort we found high values in both steatotic and inflammatory HCAs. We did not perform statistical analysis on these results, as there were only four patients in the steatotic HCA group and five in the unclassified group and therefore statistical analysis would not be reliable.
In this study, we also checked whether pSWE could provide a contributory argument in patients in whom there was a discrepancy between CEUS and MRI or biopsy diagnosis. Unfortunately, this was not the case, the pSWE values ranged from low to high for both lesions.
The use of pSWE for the evaluation of focal liver lesions has limitations. The first limitation is that currently it cannot be used in lesions that are situated deeper than 80 mm from the skin. In this study, we had to exclude eight patients because the lesion was too deep. During the execution of this study, we noticed that several factors might affect a lesion's stiffness value. For example, higher values may be seen in lesions with a fibrotic membrane where the pSWE region of interest exceeds the lesion diameter, in lesions located just underneath the liver capsule or in the proximity of one of the ligaments and in lesions with scar tissue. Lower values may be found in lesions with intralesional arteries or veins or lesions located in the proximity of any liver artery or vein.
In this study, we also assessed the interobserver reliability in patients with focal liver lesions using the ICC. We found good interobserver reliability for lesion stiffness but a poor one for the surrounding NLT. Subgroup analysis showed a better interobserver reliability in lesions >30 mm compared to those <30 mm. In 2012, Gallotti et al.14 also did an interobserver evaluation while performing ARFI ultrasound imaging in patients with focal liver lesions, including hepatocellular carcinomas, hemangiomas, HCAs, metastases, and FNHs). They compared the mean values between the two operators and did not find a statistically significant difference. However, we believe that the ICC is a more valid method to assess interobserver reliability and that it would be wise to validate other elastography software with this method.
This study also assessed the intraobserver reliability of pSWE in determining the stiffness of NLT in healthy subjects. Remarkably, we found poor to moderate intraobserver reliability while other studies had good to excellent results.26, 27 This is also stated in the most recent update of the EFSUMB guidelines on the use of elastography.28 The differences might be explained by our small sample size of healthy subjects, but could also indicate that the performance of pSWE in determining the stiffness of NLT in healthy subjects is not as good as the first results showed.
This study has limitations. The first is the fact that not all lesions were biopsied and therefore only 17% of FNHs and 22% of HCAs were pathologically proven. Although pathological examination remains the gold standard for diagnosis of benign liver tumors, clinical practice guidelines advise to rely mainly on imaging findings as CE‐MRI has a high sensitivity and specificity. Biopsy should only be performed in case of diagnostic uncertainty after state‐of‐the‐art imaging.29 Second, we had a high rate of failed pSWE examinations (25 out of 113 patients) due to either the depth of the lesion or because the lesion could not be found at ultrasound examination. Thirteen HCAs could not been found, as these lesions may regress after cessation of oral contraceptives.17 We must highlight that this was the reason that we purposely excluded all female patients with HCA over 50 years of age. More remarkable was the fact that four FNHs also could not be found at ultrasound examination, as these lesions usually do not regress over time. The last limitation is the possible skewed distribution between males and females in this study, as only one male was included. It is known that both types of lesions have a female predominance, although a clear relationship with female sex steroids has only been demonstrated for HCA. Additionally, guidelines advise to perform a resection in all men with proven HCA as they appear to have a higher risk of malignant transformation.29
In conclusion, this study suggests that pSWE cannot reliably differentiate between FNH and HCA. Additionally, both interobserver and intraobserver reliability for pSWE measurements of the NLT were insufficient. Interpretation of the results gained with this method should be done with caution.
Taimr P, Klompenhouwer AJ, Thomeer MGJ, et al. Can point shear wave elastography differentiate focal nodular hyperplasia from hepatocellular adenoma. J Clin Ultrasound. 2018;46:380–385. https://doi.org/10.1002/jcu.22603
REFERENCES
- 1. Maillette de Buy Wenniger L, Terpstra V, Beuers U. Focal nodular hyperplasia and hepatic adenoma: epidemiology and pathology. Dig Surg. 2010;27(1):24–31. [DOI] [PubMed] [Google Scholar]
- 2. Dardenne S, Hubert C, Sempoux C, et al. Conservative and operative management of benign solid hepatic tumours: a successful stratified algorithm. Eur J Gastroenterol Hepatol. 2010;22(11):1337–1344. [DOI] [PubMed] [Google Scholar]
- 3. Choi BY, Nguyen MH. The diagnosis and management of benign hepatic tumors. J Clin Gastroenterol. 2005;39(5):401–412. [DOI] [PubMed] [Google Scholar]
- 4. Dietrich CF, Schuessler G, Trojan J, et al. Differentiation of focal nodular hyperplasia and hepatocellular adenoma by contrast‐enhanced ultrasound. Br J Radiol. 2005;78(932):704–707. [DOI] [PubMed] [Google Scholar]
- 5. Vilgrain V, Flejou JF, Arrive L, et al. Focal nodular hyperplasia of the liver: MR imaging and pathologic correlation in 37 patients. Radiology. 1992;184(3):699–703. [DOI] [PubMed] [Google Scholar]
- 6. D'Onofrio M, Crosara S, De Robertis R, et al. Contrast‐enhanced ultrasound of focal liver lesions. AJR Am J Roentgenol. 2015;205:W56–W66. [DOI] [PubMed] [Google Scholar]
- 7. Laumonier H, Bioulac‐Sage P, Laurent C, et al. Hepatocellular adenomas: magnetic resonance imaging features as a function of molecular pathological classification. Hepatology. 2008;48(3):808–818. [DOI] [PubMed] [Google Scholar]
- 8. Roche V, Pigneur F, Tselikas L, et al. Differentiation of focal nodular hyperplasia from hepatocellular adenomas with low‐mechanical‐index contrast‐enhanced sonography (CEUS): effect of size on diagnostic confidence. Eur Radiol. 2015;25(1):186–195. [DOI] [PubMed] [Google Scholar]
- 9. McInnes MD, Hibbert RM, Inacio JR, et al. Focal nodular hyperplasia and hepatocellular adenoma: accuracy of gadoxetic acid‐enhanced MR imaging–a systematic review. Radiology. 2015;277(2):413–423. [DOI] [PubMed] [Google Scholar]
- 10. Tselikas L, Pigneur F, Roux M, et al. Impact of hepatobiliary phase liver MRI versus contrast‐enhanced ultrasound after an inconclusive extracellular gadolinium‐based contrast‐enhanced MRI for the diagnosis of benign hepatocellular tumors. Abdom Radiol (NY). 2017;42(3):825–832. [DOI] [PubMed] [Google Scholar]
- 11. Piccinino F, Sagnelli E, Pasquale G, et al. Complications following percutaneous liver biopsy. A multicentre retrospective study on 68,276 biopsies. J Hepatol. 1986;2(2):165–173. [DOI] [PubMed] [Google Scholar]
- 12. Piscaglia F, Salvatore V, Mulazzani L, et al. Ultrasound shear wave elastography for liver disease. A critical appraisal of the many actors on the stage. Ultraschall Med. 2016;37(01):1–5. [DOI] [PubMed] [Google Scholar]
- 13. Frulio N, Laumonier H, Carteret T, et al. Evaluation of liver tumors using acoustic radiation force impulse elastography and correlation with histologic data. J Ultrasound Med. 2013;32(1):121–130. [DOI] [PubMed] [Google Scholar]
- 14. Gallotti A, D'onofrio M, Romanini L, et al. Acoustic radiation force impulse (ARFI) ultrasound imaging of solid focal liver lesions. Eur J Radiol. 2012;81(3):451–455. [DOI] [PubMed] [Google Scholar]
- 15. Guibal A, Boularan C, Bruce M, et al. Evaluation of shearwave elastography for the characterisation of focal liver lesions on ultrasound. Eur Radiol. 2013;23(4):1138–1149. [DOI] [PubMed] [Google Scholar]
- 16. Heide R, Strobel D, Bernatik T, et al. Characterization of focal liver lesions (FLL) with acoustic radiation force impulse (ARFI) elastometry. Ultraschall Med. 2010;31(04):405–409. [DOI] [PubMed] [Google Scholar]
- 17. Klompenhouwer AJ, Sprengers D, Willemssen FE, et al. Evidence of good prognosis of hepatocellular adenoma in post‐menopausal women. J Hepatol. 2016;65(6):1163–1170. [DOI] [PubMed] [Google Scholar]
- 18. Ronot M, Bahrami S, Calderaro J, et al. Hepatocellular adenomas: accuracy of magnetic resonance imaging and liver biopsy in subtype classification. Hepatology. 2011;53(4):1182–1191. [DOI] [PubMed] [Google Scholar]
- 19. van Aalten SM, Thomeer MG, Terkivatan T, et al. Hepatocellular adenomas: correlation of MR imaging findings with pathologic subtype classification. Radiology. 2011;261(1):172–181. [DOI] [PubMed] [Google Scholar]
- 20. Zucman‐Rossi J, Jeannot E, Nhieu JT, et al. Genotype‐phenotype correlation in hepatocellular adenoma: new classification and relationship with HCC. Hepatology. 2006;43(3):515–524. [DOI] [PubMed] [Google Scholar]
- 21. Bamber J, Cosgrove D, Dietrich CF, et al. EFSUMB guidelines and recommendations on the clinical use of ultrasound elastography. Part 1: basic principles and technology. Ultraschall Med. 2013;34(02):169–184. [DOI] [PubMed] [Google Scholar]
- 22. Cosgrove D, Piscaglia F, Bamber J, et al. EFSUMB guidelines and recommendations on the clinical use of ultrasound elastography. Part 2: clinical applications. Ultraschall Med. 2013;34(03):238–253. [DOI] [PubMed] [Google Scholar]
- 23. Ronot M, Di Renzo S, Gregoli B, et al. Characterization of fortuitously discovered focal liver lesions: additional information provided by shearwave elastography. Eur Radiol. 2015;25(2):346–358. [DOI] [PubMed] [Google Scholar]
- 24. Brunel T, Guibal A, Boularan C, et al. Focal nodular hyperplasia and hepatocellular adenoma: the value of shear wave elastography for differential diagnosis. Eur J Radiol. 2015;84(11):2059–2064. [DOI] [PubMed] [Google Scholar]
- 25. Edmondson HA, Reynolds TB, Henderson B, et al. Regression of liver cell adenomas associated with oral contraceptives. Ann Intern Med. 1977;86:180–182. [DOI] [PubMed] [Google Scholar]
- 26. Guzman‐Aroca F, Reus M, Berna‐Serna JD, et al. Reproducibility of shear wave velocity measurements by acoustic radiation force impulse imaging of the liver. A Study in Healthy Volunteers. J Ultrasound Med. 2011;30(7):975–979. [DOI] [PubMed] [Google Scholar]
- 27. Ferraioli G, Tinelli C, Lissandrin R, et al. Point shear wave elastography method for assessing liver stiffness. World J Gastroenterol. 2014;20:4787–4796. [DOI] [PMC free article] [PubMed] [Google Scholar]
- 28. Dietrich CF, Bamber J, Berzigotti A, et al. EFSUMB Guidelines and Recommendations on the Clinical Use of Liver Ultrasound Elastography, Update 2017 (Long Version). Ultraschall Med 2017;38(4):e16‐e47. [DOI] [PubMed] [Google Scholar]
- 29. European Association for the Study of the L . EASL Clinical practice guidelines on the management of benign liver tumours. J Hepatol. 2016;65(2):386–398. [DOI] [PubMed] [Google Scholar]