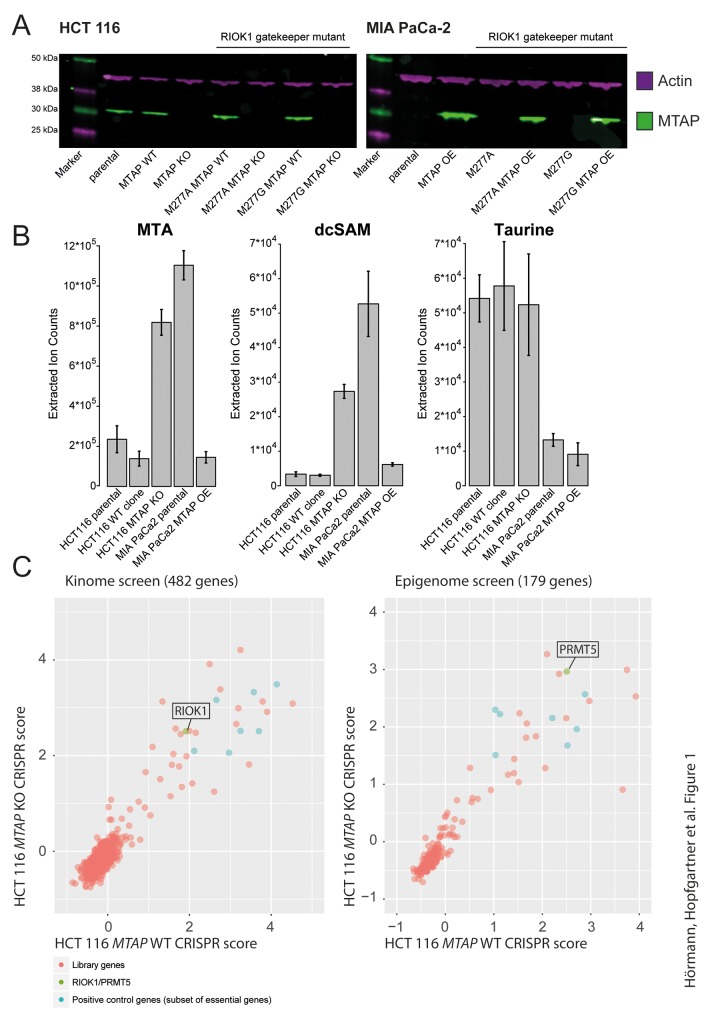
Figure 1. Generation of MTAP isogenic cell lines.
(A) Western Blot confirmation of MTAP status in HCT 116 and MIA PaCa-2 MTAP isogenic cell lines with and without the RIOK1 gatekeeper mutations M277A and M277G. Green: MTAP; Magenta: Actin loading control. MTAP KO refers to MTAP knockout clones; MTAP OE refers to MTAP overexpressing cell lines. (B) Mass Spectrometry based analysis of a select set of metabolites confirms increased MTA levels upon loss of MTAP. Similarly, dcSAM (decarboxylated S-Adenosine Monophosphate) levels correlate with the MTAP status, whereas control metabolite (Taurine) levels are not dependent on the MTAP status. Bars represent mean and error bars depict the standard deviation. (C) Kinome and epigenome CRISPR screens in MTAP isogenic cell lines identify RIOK1 and PRMT5 as essential genes irrespective of the MTAP status. CRISPR scores associated with all screened genes are listed in Supplementary Tables 2–5.

