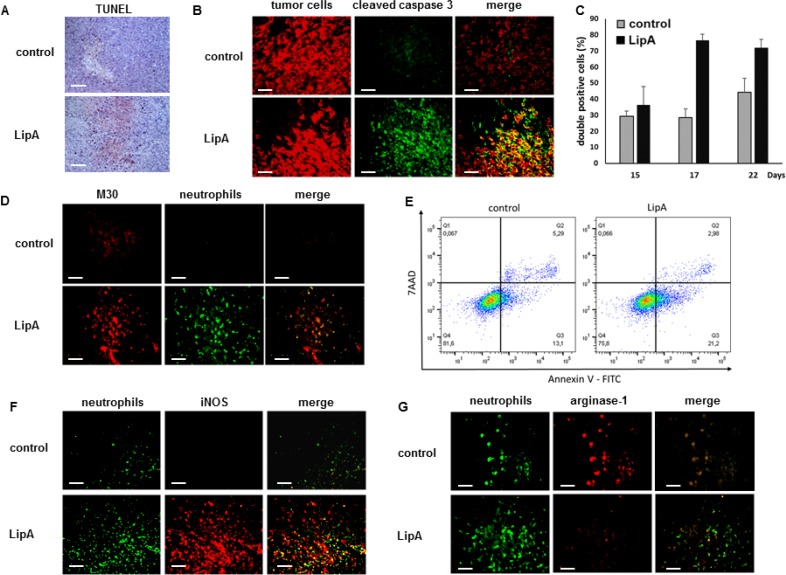
Figure 3. LipA treatment induced tumor cell death in the vicinity of infiltrated anti-tumorigenic neutrophils.
Tumors from LipA treated or control rats were removed at day 17 (A, B, D, F, G), fixed and cut into 5-μm cryosections. (A) Apoptotic cells were present in the core of tumors from LipA treated rats but not in tumors from control rats (TUNEL, red). (B) Immunostaining of tumor cells (anti-cytokeratin Ab, red) and cleaved caspase 3 (anti-cleaved caspase 3 Ab, green). (C) The levels of tumor cells containing cleaved caspase 3 were determined at days 15, 17 and 22 by counting of these cells in 3 independent slides per animals, 4 animals per group. Shown are the mean % of double positive cells ± SEM. (D) Immunostaining of apoptotic tumor cells (M30 Ab, red) and neutrophils (anti-HIS48 antibody, green). (E) The levels of apoptotic tumors cells (AnnV+ cells) was determined using an Annexin V-7AAD staining, after LipA treatment of co-culture of CT26 cells and tumor associated-neutrophils. (F, G) Staining for neutrophils (anti-HIS48 Ab, green) and (F) iNOS (anti-iNOS Ab, red) or (E) arginase-1 (anti-arginase-1 Ab, red). Micrographs are representative of at least 3 independent experiments, 4 animals per group (scale bars = 50 µm).

