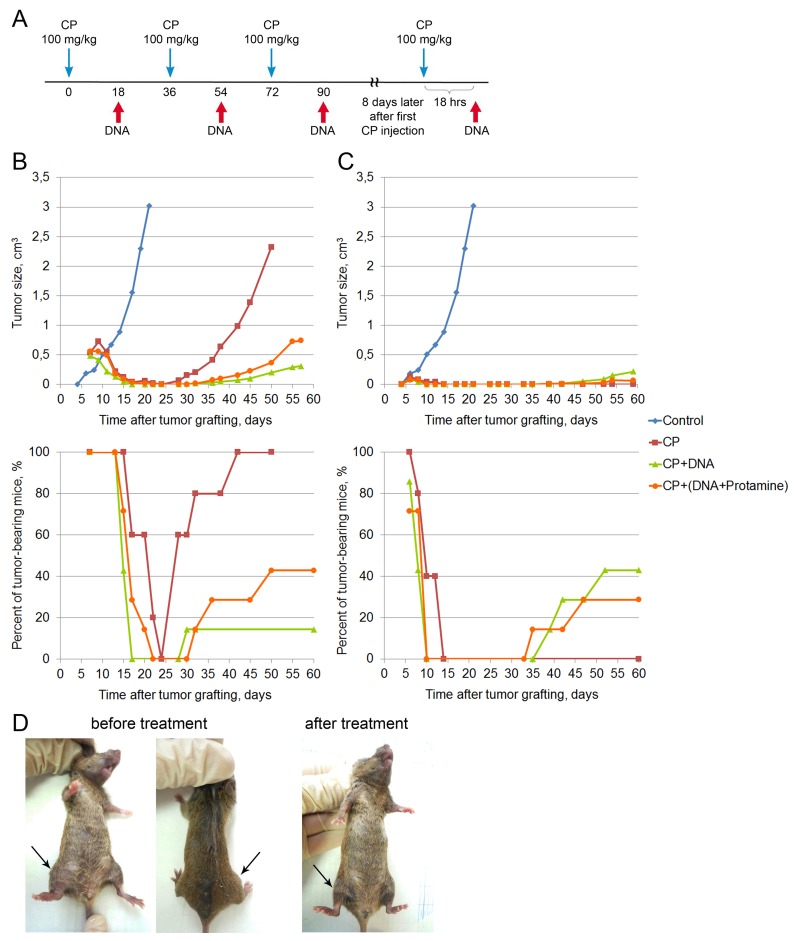
Figure 1. Treatment of a Krebs-2 solid tumor (winter 2016).
(A) A schedule of injections. Blue arrow corresponds to CP injection, DNA injections are denoted by a red arrow on the schematic. DNA preparation was a mixture of equal amounts of native human DNA and salmon DNA (3 : 5 = cross-linked : native). (B) Dynamics of changes in the tumor size and number of animals with tumor upon treatment of a 0.5 cm3 graft. Data for the following animal groups treated according to the schedule (A) are shown: control, untreated, CP, CP-only; CP+DNA, CP and DNA injected directly into the tumor at a dose of 1 mg/mouse (first injection of 0.5 mg), CP+(DNA+protamine), CP and DNA injections in combination with protamine given intravenously at a dose of 0.1 mg. (C) Dynamics of changes in the tumor size and number of tumor-bearing animals upon treatment of a non-palpable graft. Treatment groups are the same as in (В). (D) An animal with an initial tumor size of 0.5 cm3 (before treatment) and also the animal with complete cure 210 days after the start of treatment (after treatment).

