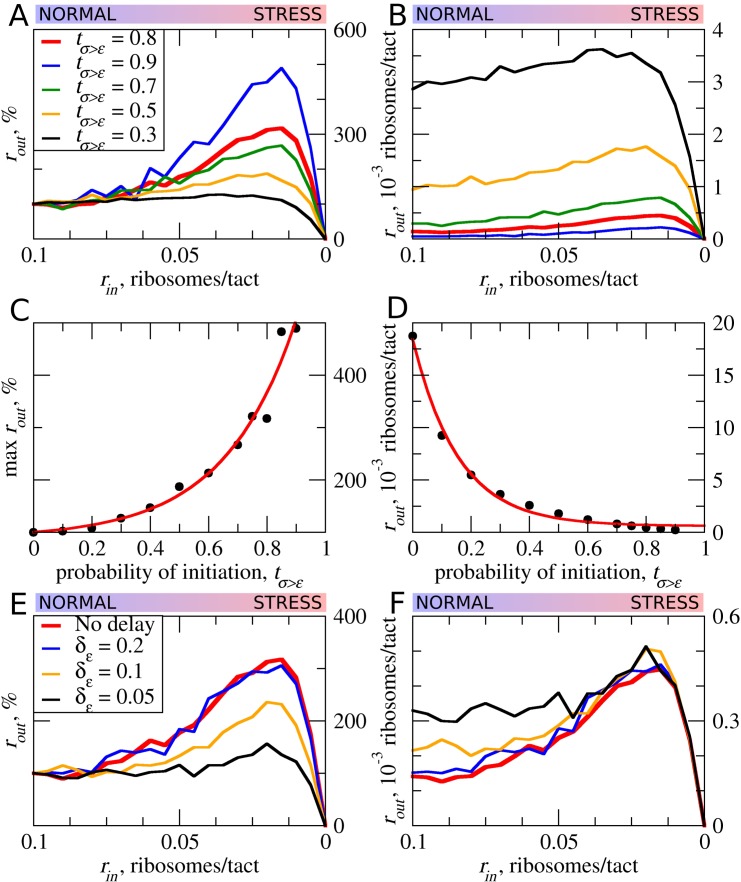
Figure 4. The effect of uORF initiation efficiency (tσ>ε) on stress resistance.
Other parameters of the simulations tε>σ=0; L=100; mσ=0.3; mε=0.3. (A, B) Relative (rout[rin]/rout[rin=0.1]) (A) and absolute (B) changes in the density of ribosomes downstream of a uORF for a range of rin from 0.1 to 0 for different uORF initiation efficiencies (tσ>ε). (C) Dependence of the relative (rout) maximum increase on the uORF initiation efficiency tσ>ε. (D) Dependence of absolute maximum rout rate on tσ>ε. (E, F) Relative (rout[rin]/rout[rin=0.1]) (E) and absolute (F) changes in the density of ribosomes downstream of a uORF depending on the delay δε, which is the probability that newly formed elongating will move. For no delay, δε=1. Source data for panel (A) are provided in Figure 4—source data 1, for panel (B) in Figure 4—source data 2, for panel (E) in Figure 4—source data 3 and for panel (F) in Figure 4—source data 4.

