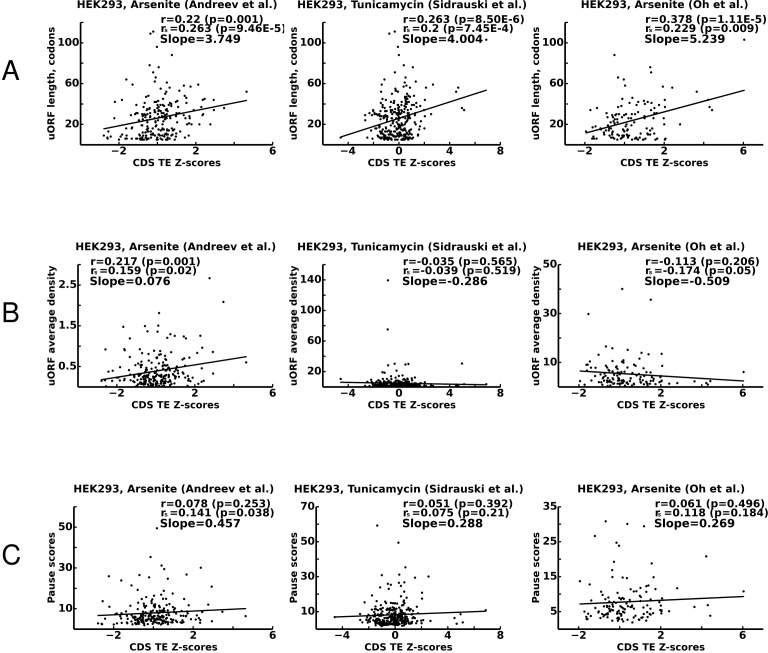
Figure 7. Correlations between translational stress resistance of mRNAs and features in the 5’ leaders of uOFRs for three studies.
(A) uORF length. (B) uORF translation initiation measured as uORF translation efficiency. (C) Ribosome pausing estimated with pause score. Pearson correlation coefficients (r) and Spearman rank correlations (rs) are provided for each plot along with the corresponding p-values. The slope of linear regression is also indicated for each plot. Source data are provided in Figure 7—source data 1.

