Abstract
The segmentation and classification of retinal arterioles and venules play an important role in the diagnosis of various eye diseases and systemic diseases. The major challenges include complicated vessel structure, inhomogeneous illumination, and large background variation across subjects. In this study, we employ a fully convolutional network to simultaneously segment arterioles and venules directly from the retinal image, rather than using a vessel segmentation-arteriovenous classification strategy as reported in most literature. To simultaneously segment retinal arterioles and venules, we configured the fully convolutional network to allow true color image as input and multiple labels as output. A domain-specific loss function was designed to improve the overall performance. The proposed method was assessed extensively on public data sets and compared with the state-of-the-art methods in literature. The sensitivity and specificity of overall vessel segmentation on DRIVE is 0.944 and 0.955 with a misclassification rate of 10.3% and 9.6% for arteriole and venule, respectively. The proposed method outperformed the state-of-the-art methods and avoided possible error-propagation as in the segmentation-classification strategy. The proposed method was further validated on a new database consisting of retinal images of different qualities and diseases. The proposed method holds great potential for the diagnostics and screening of various eye diseases and systemic diseases.
OCIS codes: (100.0100) Image processing, (150.0150) Machine vision
1. Introduction
Retinal arterioles and venules, defined as small blood vessels directly before and after the capillaries, are the only human microcirculation that can be non-invasively observed in vivo with an optical method. Various eye diseases and systemic diseases manifest themselves on the fundus image as retinal arteriole and venule changes [1, 2]. Specifically, diseases may affect the arterioles and venules differently. For example, the narrowing of retinal arterioles and widening of retinal venules independently predict the risk of mortality and ischemic stroke [3]. Therefore, identifying and quantifying the changes of retinal arterioles and venules may serve as potential biomarkers for the diagnosis and long-term monitoring of these diseases.
Manual segmentation is extremely labor-intensive and clinically not feasible. Thus, it is of great importance to automatically segment and analyze the arterioles and venules individually on the retinal images. The main challenges for automatic segmentation are three-fold. First, the vascular morphology varies greatly in an image because of an inherited inhomogeneous illumination partially caused by the image acquisition procedure (i.e., projecting a spherical surface onto a plane). Second, by projecting three-dimensional vascular trees to a two-dimensional image, the vessel trees are overlapped with incomplete structures. At last, the retina shows diverse background pigmentation across images because of different biological characteristics (i.e., races and ages).
In the past decades, various methods have been developed to classify the retinal vessels into arteriole and venule, which can be categorized as tree-based methods and pixel classification methods. The tree-based methods target at dividing the retinal vessels into individual biological vessel trees often by a graph-theoretic method [4–7]. Rothaus et al. reported a rule-based method that propagates vessel labels through a pre-segmented vascular graph, in which the labels need to be manually initialized [4]. Hu et al. proposed a graph-based, meta-heuristic algorithm to separate vessel trees [5]. Dashtbozorg et al. proposed to classify the vessel trees by deciding the type of each crossing point and assigning arteriole or venule label to each vessel segment [6]. A more recent work by Estrada et al. also used a graph-theoretic framework incorporated with a likelihood model [7]. Tree-based methods usually require manual seeds for initialization. Furthermore, a single mislabel along the propagation may lead to mislabel of the entire vessel tree. On the other hand, the pixel classification methods extract hand-crafted local features around pixels with known true labels and build classifiers or likelihood models for test images [8–13]. The local features are usually designed based on observable colorimetric and geometric differences between arterioles and venules. For example, arterioles contain oxygenated hemoglobin that shows higher reflectance than deoxygenated hemoglobin in specific wavelengths and are thus brighter than venules. The central light reflex (CLR) phenomenon is another widely used feature, which is more frequently seen in retinal arterioles than venules. Narasimha-Iyer et al. reported an automatic method to classify arterioles and venules in dual-wavelength retinal images with structural and functional features, including the CLR and oxygenation rate difference between arterioles and venules [8]. Saez et al. reported a clustering method and the features are RGB/HSL color and gray levels [11]. Niemeijer et al. reported a supervised method and the designed features are HSV color features and Gaussian derivatives [9, 10]. Vazquez et al. proposed a retinex image enhancement method to adjust the uneven illumination inside a retinal image [12]. Our group also proposed an intra-image and inter-image normalization method to reduce the sample differences in feature space [13]. Pixel classification methods often struggle at finding the most representative features. As discussed above, the retinal images have an inherited inhomogeneous illumination and have large variation across images. Though some efforts have been made to alleviate the problem [12, 13], the improvement is limited because pixel classification methods show an inability to incorporate context information. At last, there are some common limitations for tree-based methods and pixel classification methods. First, a high-quality vessel segmentation is usually required as input, which is used for graph construction in tree-based methods and for reducing the three-class problem (e.g., arteriole, venule, and background) to a two-class problem (e.g., arteriole and venule) in pixel classification methods. However, vessel segmentation, by itself, is another challenging task in image analysis. In the reported arteriole and venule classification methods, the vessel segmentation is either from manual or semi-automatic methods [7, 14], which makes the algorithm pipeline time-consuming, or from other automatic algorithms [6, 10, 11], which makes an error propagation inevitable. At last, most of the methods reported in literatures are only trained and tested on limited data sets. The performance on data sets with large variations has not been reported yet.
Convolutional neural networks (CNN) have been widely applied in image labeling and segmentation in recent years. Though initially developed for image labeling, various methods have been proposed for semantic segmentation in an image [15–17]. In the field of retinal image analysis, although several CNN methods have been reported for vessel segmentation [18, 19], to our best knowledge, this is the first application for simultaneous vessel segmentation and arteriovenous classification. In this study, we apply and extend a fully convolutional network (FCN) first proposed by Ronneberger et al. [20]. Specifically, the architecture is modified to allow true color image as input and multi-label segmentation as output. Second, a domain-specific loss function is designed, which can be used as a general strategy for imbalanced multi-class segmentation problem. The proposed method was compared extensively with literatures on available public data sets. To assess the robustness of our method between images with various qualities, we further assessed our method on a new database consisting of fundus images with diverse qualities and disease signs.
2. Experimental materials
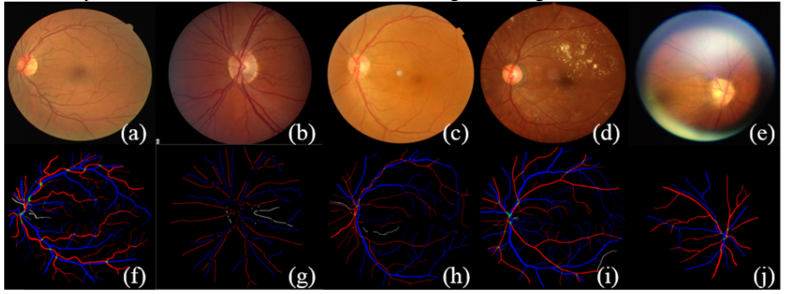
The DRIVE (Digital Retinal Image for Vessel Extraction) database consists of 40 color fundus photographs from a diabetic retinopathy screening program [21]. Seven out of the 40 images contain pathologies such as exudates, hemorrhages and pigment epithelium changes. The image size is 768 × 584 pixels (Canon CR5 non-mydriatic 3-CCD camera). The 20 images from the test set was manually labeled by trained graders and thus is included in this study. Full annotation was given for this data set, meaning each pixel was given a label of arteriole (red), venule (blue), crossing (green), uncertain vessel (white), or background (black). This A/V annotated data set is also known as the RITE data set [5]. The INSPIRE data set contains 40 optic-disc centered color fundus images with a resolution of 2392 × 2048 pixels [10]. Only selected vessel centerline pixels are labeled in this data set [6]. Arteriole centerlines, venule centerlines, and uncertain centerlines are labeled in red, blue, and white, respectively.
The method is further assessed on a new database (REVEAL, REtinal arteriole &VEnule AnLysis), which includes three sets of images of different image quality and disease signs. Specifically, REVEAL1 includes ten images from ten participants with diabetes mellitus (Topcon TRC-NW6S retinal camera, FOV of 45°, image size 3872 × 2592 pixels). This data set contains early signs of diabetic retinopathy, such as microaneurysm and exudates. REVEAL2 includes 10 images from ten subjects (Kowa nonmyd α-D VK-2, FOV of 45°, image size 1600 × 1270 pixels). REVEAL2 shows severe signs of diabetic retinopathy, such as large hemorrhage. REVEAL3 includes ten low quality fundus images from ten normal subjects. The images were acquired using a smartphone-compatible fundus camera (iExaminer plus ‘Panoptic’, FOV of 25°, Welch-Allyn Inc., Skaneateles Fall, NY, USA). Two well-trained graders (G1 and G2) manually labeled all arterioles and venules in the images. G1 manually labeled two data sets (REVEAL 1&2) and G2 manually labeled two data sets (REVEAL 1&3). For REVEAL1, G1 is regarded as ground truth and inter-grader repeatability is assessed for G2. Similar as the DRIVE data set, four labels are given in the manual segmentation (i.e., red, blue, green, and white for arterioles, venules, crossings, and uncertain vessels). ITK-SNAP version 3.6.0 was used for manual grading. This data set shows large diversity in image quality and disease severity. Moreover, it includes smartphone-based fundus images, which is playing an increasingly important role in point-of-care (POC) disease diagnosis and screening. The data sets, including original images and manual labels, are publicly available and we encourage researchers to develop and test their methods using this database (http://bebc.xjtu.edu.cn/retina-reveal). Typical images and corresponding manual labels from public data sets and the REVEAL database are given in Fig. 1.
Fig. 1.
Typical images and the corresponding manual labels from the DRIVE, INSPIRE, and REVEAL database. (a) and (f) are typical image and manual segmentation from the DRIVE data set. (b) and (g) are typical image and manual segmentation from the INSPIRE data set. It should be noted that the original manual segmentation only contains vessel centerlines of 1-pixel width, which is dilated for the sake of better visualization. (c)-(e) and (h)-(j) are typical images and manual segmentations from the REVEAL database. From left to right are images from REVEAL 1, 2, and 3, respectively.
3. Methods
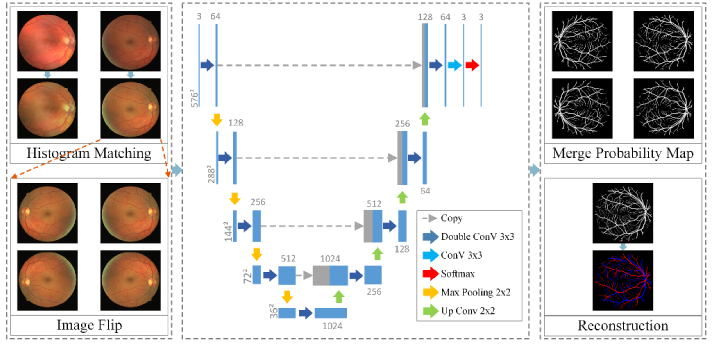
We employ the FCN architecture to simultaneously segment both arteriole trees and venule trees in the retinal image. The flowchart of proposed method is given in Fig. 2. All color channels (i.e., red, green, and blue) are fused to allow the usage of full color information. In a pilot study, it is noticed that fine vessels are easily missed and that arterioles are more easily to be misclassified as venules. We thus designed the loss function to enhance the detection ability of the network on fine vessels as well as arteriole vessels.
Fig. 2.
Flowchart of the proposed method.
3.1 Preprocessing
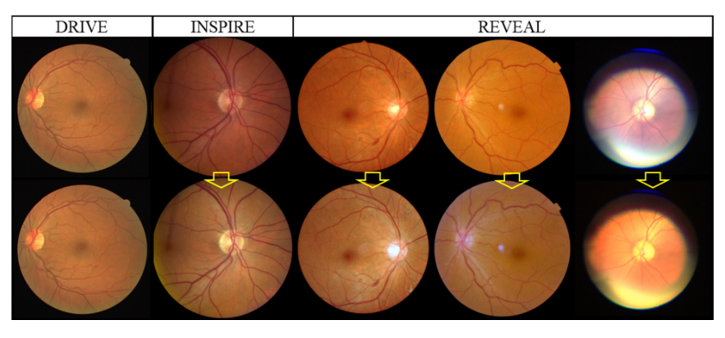
Retinal image has a wide variability in background color, which may influence the performance of the FCN network. Image normalization by histogram matching is applied to eliminate the background differences. Histogram matching is the transformation of the image histogram so that it matches the histogram of a target image [22]. In our study, the performance of proposed method was not sensitive to the selection of target image and the first image from the DRIVE data set was selected for convenience. The R, G, B channels of all other images, including other images in the DRIVE data set, are matched respectively to the R, G, B channels of the target image, as shown in Fig. 3.
Fig. 3.
Histogram matching. The first row is the original color fundus images. The second row is the images after histogram matching. All images are matched to the top left image from the DRIVE data set.
3.2 Training the FCN architecture for retinal arteriole and venule classification
The original FCN architecture can be recognized as two parts, the descending part and the ascending part, with a total number of 23 convolutional layers. However, in the original network, the feature map after each convolution loses its boundary pixels, resulting in different input and output image size. We apply same padding in convolution to avoid inconsistent image sizes. The activation function is rectified linear unit (ReLU). The details of the network can be found in Fig. 2. To maintain the same input and output image size, the size of the input image should be a multiple of 16. In our applications, the input images are resized to 576 × 576 pixels.
Data augmentation of 60 times is implemented by applying a combination of elastic deformation [23] and random flipping of the original image considering the limited number of training images. Hence, the final number of training image is 50 × 60 = 3,000 color fundus images.
In a pilot study, we use the cross entropy of a pixel-wise soft-max loss between the predicted label and ground truth label over the final feature map as the energy function. This simple energy function result in 1) generally under-segmented fine vessels and 2) arterioles prone to be misclassified as venules. In this study, we apply a weighted cross entropy that penalizes each pixel with different labels with different weights, which is precomputed from each ground truth segmentation, as given in Eq. (1).
| (1) |
where l(x) is the true label of each pixel, pk(x) is the softmax output of each pixel, and wc(x) is the weight of each pixel. In the design of wc, more importance is given to arteriole pixels and venule pixels. In our experiment, wc is 10 for arteriole pixels, 5 for venule pixels, and 1 for background pixels.
3.3 Testing
Before being input to the pipeline, the testing image is resized to 576 × 576 pixels. We noticed that slightly different information is provided when the images are oriented in different directions. To better capture the fine vessels, the original images are flipped in the x-, y-, and xy- directions and processed individually. The output images are fused according to the following rule. For each pixel, if any of the four output images indicates it as blood vessel pixel, this pixel is signed as blood vessel, otherwise as background. Then, for each pixel indicated as blood vessel, the sum of arteriole probabilities is compared with the sum of venule probabilities and the label with larger sum is assigned to the pixel. At last, output image is resized to the original image size before assessment.
Ten-fold cross validation is applied on DRIVE and REVEAL. The INSPIRE data set only includes labels for selected centerline pixels and thus is excluded from training. For the training image, crossing points are treated as arteriole pixels while uncertain vessels are regarded as background.
3.4 Assessment method
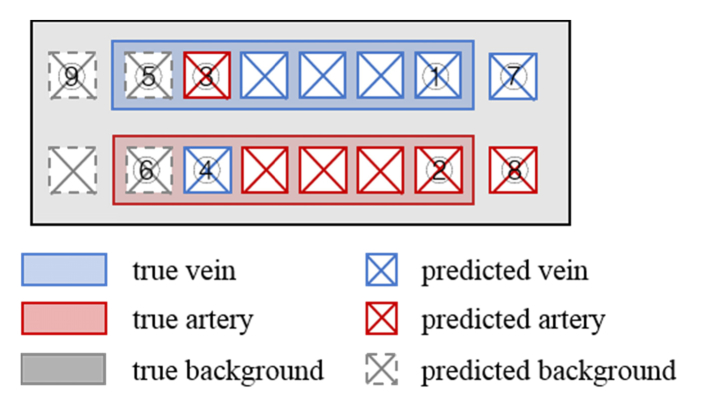
As shown in the following illustration, there are nine different classes if the whole picture is considered at the same time:
Thus, we designed a two-step assessment. First, the overall vessel segmentation result is assessed in a pixel-wise manner for all vessels regardless of their arteriole/venule labels. Then, the arteriovenous classification result is assessed as misclassification rate on the detected vessels.
To assess the general vessel segmentation ability, we calculated the overall sensitivity (Se), specificity (Sp), overall accuracy (Acc), and area under the ROC curve (AUC). The Se, Sp, and Acc are defined as follows:
| (2) |
| (3) |
where TP, TN, FP, and FN are the true positives (1 + 2 + 3 + 4 in Fig. 5), true negatives (9 in Fig. 5), false positives (7 + 8 in Fig. 5), and false negatives (5 + 6 in Fig. 5) of vessel segmentation, respectively. For the automated segmentation result, pixels with a label of arteriole or venule are regarded as vessels and otherwise considered as background. For the INSPIRE data set, the Se and Sp are calculated on all given centerline pixels from the ground truth image.
Fig. 5.
Illustration of the method assessment situation.
After assessing the overall vessel segmentation, the misclassification rate of arterioles (MISCa) and venules (MISCv) are assessed on the true positives (1 + 2 + 3 + 4 in Fig. 5). MISCa is defined as the rate of arterioles that has been misclassified as venules. Similarly, MISCv is defined as the rate of venules that has been misclassified as arterioles.
| (4) |
where TPa, TPv, FPa, and FPv denote the true positives of arteriole (2 in Fig. 5), true positives of venules (1 in Fig. 5), false positives of arteriole (4 in Fig. 5), and false positives of venule (3 in Fig. 5), respectively. At last, the overall accuracy of arteriole and venule classification is defined as:
| (5) |
4. Results
4.1 Assessment on public data sets
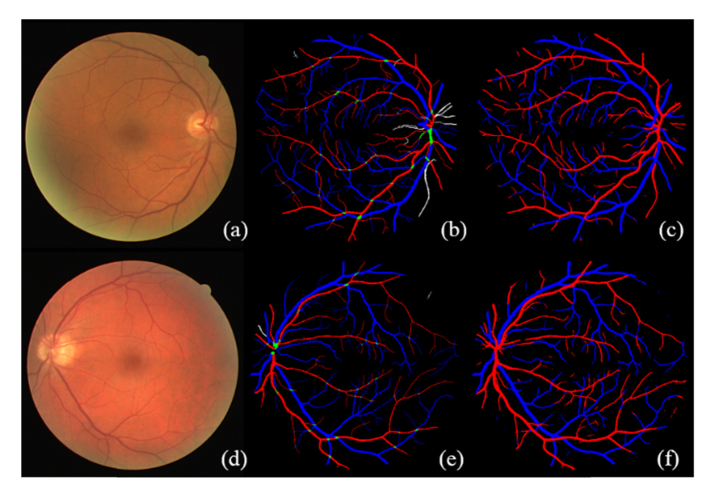
Visualization of original image, ground truth, and automatic segmentation results on the DRIVE data set are given in Fig. 4 as the first column, second column, and third column, respectively. The Se and Sp of vessel segmentation are assessed and compared with the state-of-the-art methods in Table 1 . The proposed method achieves significantly better Se of 0.944 and comparable Sp of 0.955 compared with the state-of-the-art methods. The misclassification rate is 10.3% for arteriole and 9.6% for venule.
Fig. 4.
Visualization of typical results on DRIVE data set. (a) and (d) are the original images. (b) and (e) are the ground truth labels. (c) and (f) are the results of automatic segmentation.
Table 1. Comparison of different vessel segmentation algorithms on DRIVE.
| Methods | Year | Se | Sp | Acc | AUC |
|---|---|---|---|---|---|
| Human | - | 0.776 | 0.972 | - | - |
| Staal et al. [24] | 2004 | - | - | - | 0.952 |
| Ricci et al. [25] | 2007 | - | - | 0.960 | 0.963 |
| Marin et al. [26] | 2011 | 0.707 | 0.980 | 0.945 | 0.959 |
| Miri et al. [27] | 2011 | 0.735 | 0.979 | 0.946 | |
| Roychowdhury et al. [28] | 2015 | 0.739 | 0.978 | 0.949 | 0.967 |
| Wang et al. [29] | 2015 | 0.817 | 0.973 | 0.977 | 0.948 |
| Xu et al. [30] | 2016 | 0.786 | 0.955 | 0.933 | 0.959 |
| Li et al. [19] | 2016 | 0.757 | 0.982 | 0.953 | 0.974 |
| Zhang et al. [31] | 2016 | 0.774 | 0.973 | 0.948 | 0.964 |
| Proposed Method | 2017 | 0.944 | 0.955 | 0.954 | 0.987 |
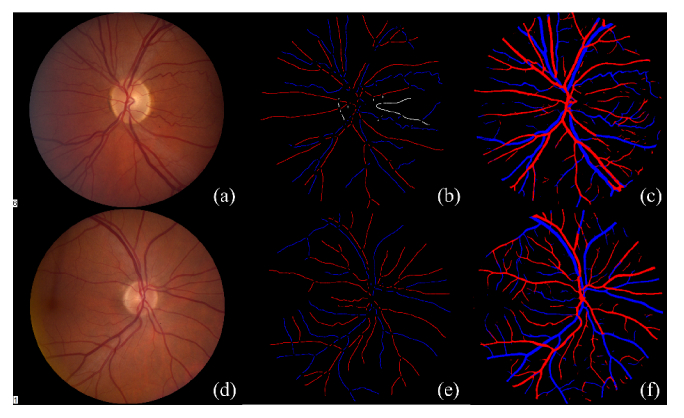
Visualization of the original image, ground truth, and automatic segmentation on the INSPIRE data set is given in Fig. 6. It should be noted that the original ground truth label only contains centerline pixels for selected vessel segments, which is dilated in Fig. 6 only for the sake of better visualization. It should also be noted that the proposed method was not trained on the INSPIRE data set, meaning INSPIRE is an outside test set. The overall Se is 0.889 and the misclassification rate is 26.1% for arteriole and 15.4% for venule.
Fig. 6.
Visualization typical result from the INSPIRE data set. (a) and (d) are original color fundus images. (b) and (e) are the ground truth labels. It should be noted that the original ground truth label only contains vessel centerline pixels (single pixel width). (b) and (e) are dilated to a width of 6 pixels only for the sake of better visualization. (c) and (f) are the automatic segmentation results.
After assessing the vessel segmentation result, the accuracy of arteriole and venule classification is compared with methods in literatures (Table 2 ). Our method achieved comparable results with the literatures. However, it should be noted that the arteriovenous classification methods reported in literature are usually developed and assessed on selected/known vessel segments or centerlines. Our method, on the other hand, is assessed on automatically detected vessel pixels with a ground truth label.
Table 2. Comparison of different arteriole and venule classification algorithms on public data sets.
| Methods | Year | Database | Acc' | Description |
|---|---|---|---|---|
| Niemeijer et al. [9] | 2009 | DRIVE | 0.88 (AUC) | Method evaluated on known vessel centerlines |
| Mirsharif et al. [32] | 2011 | DRIVE | 86% | Method evaluated on selected major vessels and main branches |
| Dashtbozorg et al. [6] | 2014 | DRIVE | 87.4% | Method developed and evaluated on known vessel centerline locations |
| Estrada et al. [7] | 2015 | DRIVE | 93.5% | Methods developed and evaluated on known vessel centerline locations |
| Xu et al. [13] | 2016 | DRIVE | 83.2% | Method evaluated on all correctly detected vessels |
|
Proposed method
|
2017
|
DRIVE
|
90.0%
|
Method evaluated on automatically detected vessels
|
| Dashtbozorg et al. [6] | 2014 | INSPIRE-AVR | 88.3% | Method developed and evaluated on known vessel centerline locations |
| Estrada et al. [7] | 2015 | INSPIRE-AVR | 90.9% | Method developed and evaluated on known vessel centerline locations |
| Proposed method | 2017 | INSPIRE-AVR | 79.2% | Method evaluated on automatically detected vessels |
4.2 Assessment on REVEAL database
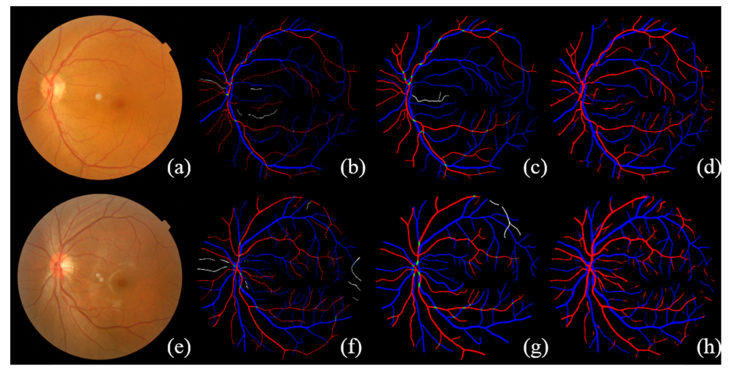
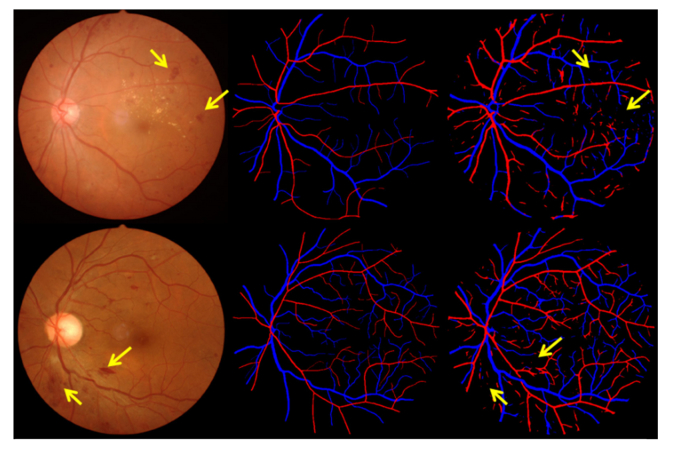
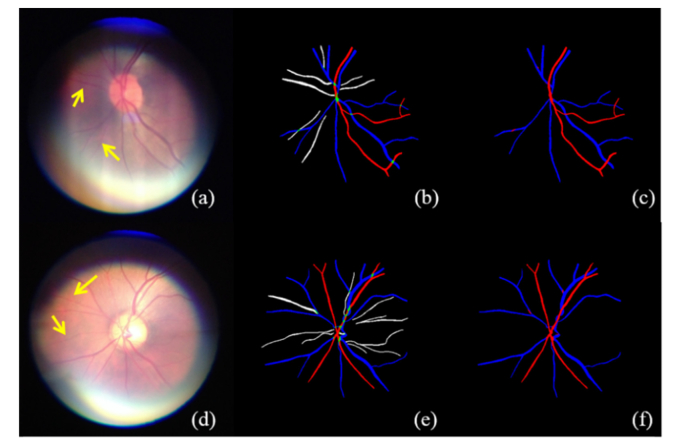
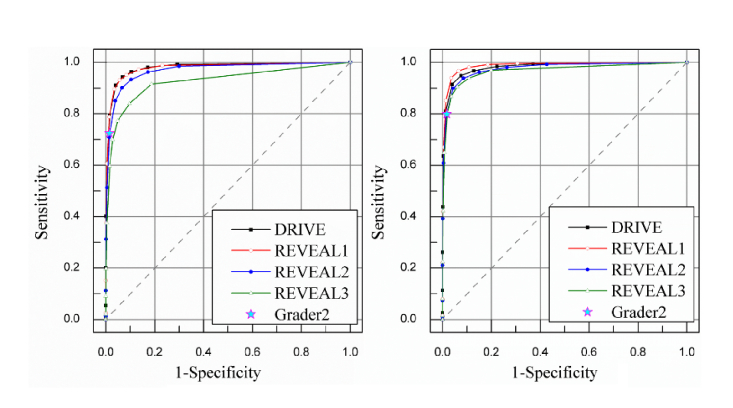
The visualization on three different data sets are given in Figs. 6-8. The number of Se, Sp, MISCa, and MISCv are given in Table 3 . The performance of proposed method on REVEAL1 is given in Fig. 7, which shows that G1 generally gave a thinner vessel segmentation than G2. Compared with the second grader G2, the proposed method shows better Se, comparable Sp, and slightly lower MISCa and MISCv. The proposed method shows a good performance on REVEAL2 as shown in Fig. 8. Specifically, the presence of aneurysms and hemorrhages was not misclassified as blood vessel. The performance of proposed method on REVEAL3 (smartphone images) is given in Fig. 9. The smartphone data set has a low performance in both vessel sensitivity and specificity and arteriole and venule misclassification rate, which is caused by the low image quality. As shown in Fig. 9, sometime it is hard to recognize the type of vessel even for the human grader. The ROC of proposed method on DRIVE and REVEAL is given in Fig. 10.
Fig. 7.
Visualization of the simultaneous arteriole and venule segmentation on REVEAL1 data set. REVEAL1 contains ten images with early signs of diabetic retinopathy. (a) and (e) are the original color fundus images. (b) and (f) are the manual segmentation from G1. (c) and (g) are the manual segmentation from G2. (d) and (h) are the results of automatic segmentation using proposed method.
Fig. 8.
Visualization of automatic arteriole and venule segmentation on REVEAL2, which includes severe signs of diabetic retinopathy. (a) and (d) are the original color fundus images. (b) and (e) are the manual segmentation results. (c) and (f) are the results of automatic segmentation using proposed method.
Table 3. Result on the REVEAL data sets.
| Vessel segmentation |
Arteriole/venule classification |
||||||
|---|---|---|---|---|---|---|---|
| Se | Sp | Acc | MISCa | MISCv | Acc' | ||
| REVEAL1 | G2 | 0.816 | 0.967 | 0.958 | 0.040 | 0.030 | 0.965 |
| Our method | 0.941 | 0.953 | 0.952 | 0.077 | 0.061 | 0.931 | |
| REVEAL2 | Our method | 0.902 | 0.948 | 0.944 | 0.115 | 0.069 | 0.908 |
| REVEAL3 | Our method | 0.792 | 0.978 | 0.973 | 0.299 | 0.113 | 0.794 |
Fig. 9.
Visualization of automatic arteriole and venule segmentation on REVEAL3, which contains ten color fundus images acquired using a smartphone. (a) and (d) are the original color fundus images. (b) and (e) are the manual segmentation results. (c) and (f) are the results of automatic segmentation using proposed method.
Fig. 10.
The ROC of different methods and manual classification on REVEAL data sets. (a) ROC for arterioles segmentations. The AUC is 0.980 for DRIVE and 0.979, 0.969, and 0.926 for the three REVEAL data sets. (b) ROC for venule segmentations. The AUC is 0.981 for DRIVE and 0.987, 0.975, 0.967 for the three REVEAL data sets.
5. Discussion
Applying fully convolutional networks in the segmentation of medical image is challenging because the targets are usually small or have diverse appearances. In this study, retinal blood vessels are fine structures with complicated tree patterns. The simultaneous segmentation of arterioles and venules is challenging as vessel boundary information comes from a finer scale but distinguishing arteriole from venule requires a coarser scale. In our approach, we take advantage of FCN architecture, in which high resolution features from the contracting path are combined with the subsampled features in the expanding path to increase the localization accuracy for fine structures. Another advantage of our method is that it directly classifies arterioles and venules from the original image without need for pre-segmentation of the blood vessels and thus avoids possible error propagation. On the other hand, algorithms reported in the literature that show better result usually require a high-quality vessel segmentation as input.
We tested our method on public data set and more images of different conditions, such as severe DR and fundus images taken using a smartphone at POC settings (Fig. 9). This is of great importance as real clinical images are quite often imperfect with various disease signs and low image quality. To our knowledge, our method is the first method assessed on severe disease cases and on fundus images taken using a smartphone. We made this data set publicly available for the researchers to develop and evaluate their methods (http://bebc.xjtu.edu.cn/retina-reveal).
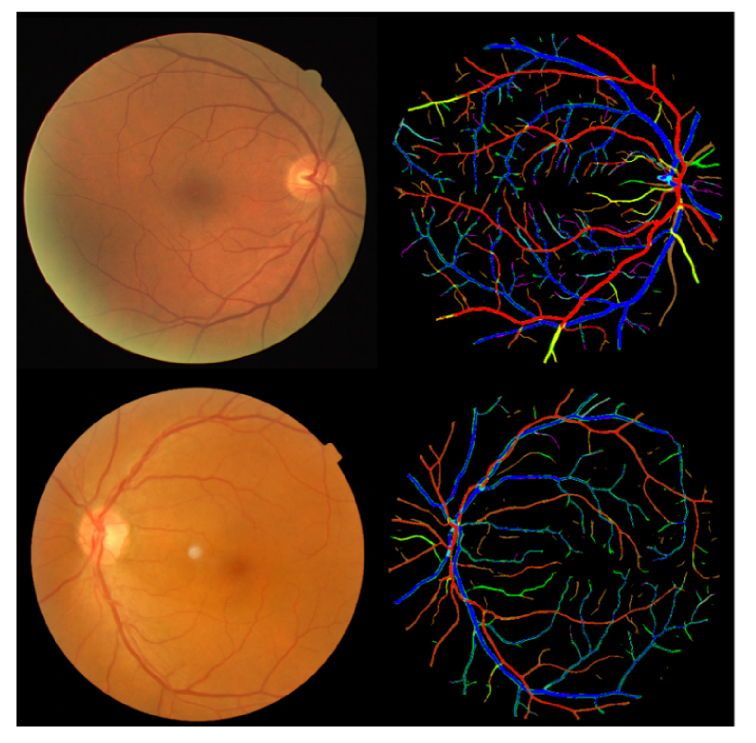
To provide an overall view of the performance, the true background (GTbkg), true vein (GTv), and true artery (GTa) versus predicted background (Pbkg), predicted vein (Pv), and predicted artery (Pa) are shown in 3 × 3 matrices for the DRIVE and REVEAL data sets in Table 4 . For the sake of better comparison, the starred number was normalized to 1 for each data set. For further discussion, the precision and recall of the vessel segmentation was also calculated. Precision is defined as TP/(TP + FP) and recall is defined as TP/(TP + FN). The precisions for DRIVE and REVEAL data sets are 0.65, 0.55, 0.58, 0.53 while the recalls are 0.94, 0.94, 0.90, and 0.79, respectively. We can see the precisions are relatively low comparing with the recalls. The reason is that, as discussed in Fig. 7, graders/automatic methods sometimes have different bias on general vessel width. Table 4 shows that the automatically detected vessels are slightly wider than the manually segmented vessels. Figure 11 shows the color-coded result images, with each color defined as in Table 4. The disagreement on general vessel width can be solved by applying an accurate vessel boundary delineation method [33].
Table 4. The true background, vein, artery and predicted background, vein, artery for DRIVE and RVEAL 1, 2, 3.
| DRIVE | REVEAL 1 | REVEAL 2 | REVEAL 3 | |||||||||
|---|---|---|---|---|---|---|---|---|---|---|---|---|
| Pbkg | Pv | Pa | Pbkg | Pv | Pa | Pbkg | Pv | Pa | Pbkg | Pv | Pa | |
| GTbkg | 26.50 | 0.57 | 0.69 | 44.77 | 1.08 | 1.12 | 34.45 | 0.95 | 0.95 | 171.81 | 2.17 | 1.60 |
| GTv | 0.07 | 1.12 | 0.12 | 0.08 | 1.52 | 0.09 | 0.14 | 1.40 | 0.10 | 0.58 | 2.59 | 0.31 |
| GTa | 0.07 | 0.12 | 1.00† | 0.09 | 0.08 | 1.00† | 0.14 | 0.13 | 1.00† | 0.58 | 0.41 | 1.00† |
Fig. 11.
Sample color-coded result images for the DRIVE and REVEAL1 data sets. The corresponding colors are defined in Table 4.
The network can be trained in less than 70 minutes in cross validation and it takes about 17 seconds to run a test image. The configuration of the computer is Intel CoreTM i7 6700k CPU and NVIDIA GeForce GTX 1080 GPU (8GB). The project was implemented in Python using Keras.
The FCN method has been widely studied and applied in medical image labeling and segmentation in the past few years [15, 16, 34, 35]. Though it generally yields better result, its limitation is also obvious. First, it needs large training data. This is particularly difficult for segmentation tasks as the manual creation of training image is extremely labor-intense. Second, the current architecture shows limited ability to incorporate prior or domain knowledge. In the arteriole and venule segmentation, for example, there are some important prior knowledges to improve the performance, including 1) the label within one vessel segment should be consistent; 2) the daughter branches should have the same label as the mother branch; and 3) the arteriole/venule would not cross another arteriole/venule. How these knowledges can be incorporated in the pipeline should be studied in the future.
Simultaneous arteriole and venous segmentation is the basis for other retinal image analysis towards computer-aided diagnosis, such as population-based screening of diabetic retinopathy and the measurement of arteriolar-to-venular ratio (AVR) [36, 37]. As discussed by Estrada et al., though the significance of AVR has long been appreciated in the research community, the measurement of AVR has been limited to the six largest first level arterioles and venules within a concentric grid (0.5-2.0 disc diameter) centered on the optic disc [7]. Yet the subtler and earlier changes in smaller arterioles and venules have not been studied yet. Another future work will focus on a computer-aided labeling of DR signs and on the study of the association between smaller vessels and systemic diseases.
6. Conclusion
In this paper, we proposed to simultaneously segment retinal arterioles and venules using an improved FCN architecture. This method allowed end-to-end multi-label segmentation of a color fundus image. We assessed our method extensively on publicly data sets and compared with the state-of-the-art methods. The result shows the proposed method outperforms the state-of-the-art methods in vessel segmentation and classification. This method is a potential tool for the computer-aided diagnosis of various eye diseases and systemic diseases.
Funding
National Natural Science Foundation of China (81401480); China Postdoctoral Science Foundation (2016T90929, 2018M631164); the Fundamental Research Funds for the Central Universities (XJJ2018254); Key Program for Science and Technology Innovative Research Team in Shaanxi Province of China (2017KCT-22); and the New Technology Funds of Xijing Hospital (XJ2018-42).
Disclosures
The authors declare that there are no conflicts of interest related to this article.
References and links
- 1.Gariano R. F., Gardner T. W., “Retinal angiogenesis in development and disease,” Nature 438(7070), 960–966 (2005). 10.1038/nature04482 [DOI] [PubMed] [Google Scholar]
- 2.Abràmoff M. D., Garvin M. K., Sonka M., “Retinal imaging and image analysis,” IEEE Rev. Biomed. Eng. 3, 169–208 (2010). 10.1109/RBME.2010.2084567 [DOI] [PMC free article] [PubMed] [Google Scholar]
- 3.Seidelmann S. B., Claggett B., Bravo P. E., Gupta A., Farhad H., Klein B. E., Klein R., Di Carli M., Solomon S. D., “Retinal vessel calibers in predicting long-term cardiovascular outcomes: the atherosclerosis risk in communities study,” Circulation 134(18), 1328–1338 (2016). 10.1161/CIRCULATIONAHA.116.023425 [DOI] [PMC free article] [PubMed] [Google Scholar]
- 4.Rothaus K., Jiang X., Rhiem P., “Separation of the retinal vascular graph in arteries and veins based upon structural knowledge,” Image Vis. Comput. 27(7), 864–875 (2009). 10.1016/j.imavis.2008.02.013 [DOI] [Google Scholar]
- 5.Hu Q., Abràmoff M. D., Garvin M. K., “Automated construction of arterial and venous trees in retinal images,” J. Med. Imaging (Bellingham) 2(4), 044001 (2015). 10.1117/1.JMI.2.4.044001 [DOI] [PMC free article] [PubMed] [Google Scholar]
- 6.Dashtbozorg B., Mendonça A. M., Campilho A., “An Automatic Graph-Based Approach for Artery/Vein Classification in Retinal Images,” IEEE Trans. Image Process. 23(3), 1073–1083 (2014). 10.1109/TIP.2013.2263809 [DOI] [PubMed] [Google Scholar]
- 7.Estrada R., Allingham M. J., Mettu P. S., Cousins S. W., Tomasi C., Farsiu S., “Retinal Artery-Vein Classification via Topology Estimation,” IEEE Trans. Med. Imaging 34(12), 2518–2534 (2015). 10.1109/TMI.2015.2443117 [DOI] [PMC free article] [PubMed] [Google Scholar]
- 8.Narasimha-Iyer H., Beach J. M., Khoobehi B., Roysam B., “Automatic identification of retinal arteries and veins from dual-wavelength images using structural and functional features,” IEEE Trans. Biomed. Eng. 54(8), 1427–1435 (2007). 10.1109/TBME.2007.900804 [DOI] [PubMed] [Google Scholar]
- 9.Niemeijer M., van Ginneken B., Abràmoff M. D., “Automatic classification of retinal vessels into arteries and veins,” in SPIE Medical Imaging (International Society for Optics and Photonics, 2009), 72601F. [Google Scholar]
- 10.Niemeijer M., Xu X., Dumitrescu A. V., Gupta P., van Ginneken B., Folk J. C., Abramoff M. D., “Automated measurement of the arteriolar-to-venular width ratio in digital color fundus photographs,” IEEE Trans. Med. Imaging 30(11), 1941–1950 (2011). 10.1109/TMI.2011.2159619 [DOI] [PubMed] [Google Scholar]
- 11.Saez M., González-Vázquez S., González-Penedo M., Barceló M. A., Pena-Seijo M., Coll de Tuero G., Pose-Reino A., “Development of an automated system to classify retinal vessels into arteries and veins,” Comput. Methods Programs Biomed. 108(1), 367–376 (2012). 10.1016/j.cmpb.2012.02.008 [DOI] [PubMed] [Google Scholar]
- 12.Vázquez S., Cancela B., Barreira N., Penedo M. G., Rodríguez-Blanco M., Seijo M. P., de Tuero G. C., Barceló M. A., Saez M., “Improving retinal artery and vein classification by means of a minimal path approach,” Mach. Vis. Appl. 24(5), 919–930 (2013). 10.1007/s00138-012-0442-4 [DOI] [Google Scholar]
- 13.Xu X., Ding W., Abràmoff M. D., Cao R., “An improved arteriovenous classification method for the early diagnostics of various diseases in retinal image,” Comput. Methods Programs Biomed. 141, 3–9 (2017). 10.1016/j.cmpb.2017.01.007 [DOI] [PubMed] [Google Scholar]
- 14.Kondermann C., Kondermann D., Yan M., “Blood vessel classification into arteries and veins in retinal images,” in Medical Imaging: Image Processing (International Society for Optics and Photonics, 2007), 651247–651247. [Google Scholar]
- 15.He K., Zhang X., Ren S., Sun J., “Spatial Pyramid pooling in deep convolutional networks for visual recognition,” IEEE Trans. Pattern Anal. Mach. Intell. 37(9), 1904–1916 (2015). 10.1109/TPAMI.2015.2389824 [DOI] [PubMed] [Google Scholar]
- 16.Girshick R., Donahue J., Darrell T., Malik J., “Region-Based Convolutional Networks for Accurate Object Detection and Segmentation,” IEEE Trans. Pattern Anal. Mach. Intell. 38(1), 142–158 (2016). 10.1109/TPAMI.2015.2437384 [DOI] [PubMed] [Google Scholar]
- 17.Shelhamer E., Long J., Darrell T., “Fully convolutional networks for semantic segmentation,” IEEE Trans. Pattern Anal. Mach. Intell. 39(4), 640–651 (2017). 10.1109/TPAMI.2016.2572683 [DOI] [PubMed] [Google Scholar]
- 18.Maninis K.-K., Pont-Tuset J., Arbeláez P., Van Gool L., “Deep retinal image understanding,” in Medical Image Computing and Computer-Assisted Intervention – MICCAI 2016 (Springer International Publishing, 2016), 140–148. [Google Scholar]
- 19.Li Q., Feng B., Xie L., Liang P., Zhang H., Wang T., “A Cross-Modality Learning Approach for Vessel Segmentation in Retinal Images,” IEEE Trans. Med. Imaging 35(1), 109–118 (2016). 10.1109/TMI.2015.2457891 [DOI] [PubMed] [Google Scholar]
- 20.Ronneberger O., Fischer P., Brox T., “U-Net: Convolutional Networks for Biomedical Image Segmentation,” in International Conference on Medical Image Computing and Computer-Assisted Intervention, 2015), 234–241. 10.1007/978-3-319-24574-4_28 [DOI] [Google Scholar]
- 21.Niemeijer M., Ginneken B. V., Loog M., “Comparative study of retinal vessel segmentation methods on a new publicly available database,” Proc. SPIE 5370, 648–656 (2004). 10.1117/12.535349 [DOI] [Google Scholar]
- 22.Sonka M., Hlavac V., Boyle R., Image Processing, Analysis, and Machine Vision (Thomson Learning, 2008). [Google Scholar]
- 23.Dosovitskiy A., Springenberg J. T., Riedmiller M., Brox T., “Discriminative unsupervised feature learning with convolutional neural networks,” in Advances in Neural Information Processing Systems 27 (NIPS; 2014), pp. 766–774 (2014) [Google Scholar]
- 24.Staal J., Abràmoff M. D., Niemeijer M., Viergever M. A., van Ginneken B., “Ridge-based vessel segmentation in color images of the retina,” IEEE Trans. Med. Imaging 23(4), 501–509 (2004). 10.1109/TMI.2004.825627 [DOI] [PubMed] [Google Scholar]
- 25.Ricci E., Perfetti R., “Retinal blood vessel segmentation using line operators and support vector classification,” IEEE Trans. Med. Imaging 26(10), 1357–1365 (2007). 10.1109/TMI.2007.898551 [DOI] [PubMed] [Google Scholar]
- 26.Marin D., Aquino A., Gegundez-Arias M. E., Bravo J. M., “A new supervised method for blood vessel segmentation in retinal images by using gray-level and moment invariants-based features,” IEEE Trans. Med. Imaging 30(1), 146–158 (2011). 10.1109/TMI.2010.2064333 [DOI] [PubMed] [Google Scholar]
- 27.Miri M. S., Mahloojifar A., “Retinal image analysis using curvelet transform and multistructure elements morphology by reconstruction,” IEEE Trans. Biomed. Eng. 58(5), 1183–1192 (2011). 10.1109/TBME.2010.2097599 [DOI] [PubMed] [Google Scholar]
- 28.Roychowdhury S., Koozekanani D. D., Parhi K. K., “Iterative Vessel Segmentation of Fundus Images,” IEEE Trans. Biomed. Eng. 62(7), 1738–1749 (2015). 10.1109/TBME.2015.2403295 [DOI] [PubMed] [Google Scholar]
- 29.Wang S., Yin Y., Cao G., Wei B., Zheng Y., Yang G., “Hierarchical retinal blood vessel segmentation based on feature and ensemble learning,” Neurocomputing 149, 708–717 (2015). 10.1016/j.neucom.2014.07.059 [DOI] [Google Scholar]
- 30.Xu X., Ding W., Wang X., Cao R., Zhang M., Lv P., Xu F., “Smartphone-based accurate analysis of retinal vasculature towards point-of-care diagnostics,” Sci. Rep. 6(1), 34603 (2016). 10.1038/srep34603 [DOI] [PMC free article] [PubMed] [Google Scholar]
- 31.Zhang J., Dashtbozorg B., Bekkers E., Pluim J. P. W., Duits R., Ter Haar Romeny B. M., “Robust retinal vessel segmentation via locally adaptive derivative frames in orientation scores,” IEEE Trans. Med. Imaging 35(12), 2631–2644 (2016). 10.1109/TMI.2016.2587062 [DOI] [PubMed] [Google Scholar]
- 32.Mirsharif G., Tajeripour F., Sobhanmanesh F., Pourreza H., Banaee T., “Developing an automatic method for separation of arteries from veins in retinal images,” in 1st International Conference on Computer and Knowledge Engineering (2011). [Google Scholar]
- 33.Xu X., Niemeijer M., Song Q., Sonka M., Garvin M. K., Reinhardt J. M., Abràmoff M. D., “Vessel boundary delineation on fundus images using graph-based approach,” IEEE Trans. Med. Imaging 30(6), 1184–1191 (2011). 10.1109/TMI.2010.2103566 [DOI] [PMC free article] [PubMed] [Google Scholar]
- 34.Krizhevsky A., Sutskever I., Hinton G. E., “ImageNet classification with deep convolutional neural networks,” in International Conference on Neural Information Processing Systems, 2012), 1097–1105. [Google Scholar]
- 35.Ren S., He K., Girshick R., Sun J., “Faster R-CNN: Towards real-time object detection with region proposal networks,” IEEE Trans. Pattern Anal. Mach. Intell. 39(6), 1137–1149 (2017). 10.1109/TPAMI.2016.2577031 [DOI] [PubMed] [Google Scholar]
- 36.Grauslund J., Hodgson L., Kawasaki R., Green A., Sjølie A. K., Wong T. Y., “Retinal vessel calibre and micro- and macrovascular complications in type 1 diabetes,” Diabetologia 52(10), 2213–2217 (2009). 10.1007/s00125-009-1459-8 [DOI] [PubMed] [Google Scholar]
- 37.De Silva D. A., Liew G., Wong M.-C., Chang H.-M., Chen C., Wang J. J., Baker M. L., Hand P. J., Rochtchina E., Liu E. Y., Mitchell P., Lindley R. I., Wong T. Y., “Retinal vascular caliber and extracranial carotid disease in patients with acute ischemic stroke,” The Multi-Centre Retinal Stroke (MCRS) study 40(12), 3695–3699 (2009). 10.1161/STROKEAHA.109.559435 [DOI] [PubMed] [Google Scholar]


