Abstract
Non-contact and minimally invasive endoscopic optical imaging is an invaluable diagnostic tool for tissue examination and cancer screening. The point sampling techniques with high sensitivity to the tissue microenvironment are time consuming and often not affordable in clinics. There is a major clinical need for a large field-of-view (FOV) rapid screening method to highlight subtle tissue microstructural alterations. To address this unmet need, we have developed High Spatial Frequency Domain Imaging (HSFDI)–a non-contact imaging modality that spatially maps the tissue microscopic scattering structures over a large field of view (>1cm2). Based on an analytical reflectance model of sub-diffusive light from forward-peaked highly scattering media, HSFDI quantifies the spatially-resolved parameters of the light scattering phase function (i.e., the backscattering probability and the light spreading length) from the reflectance of structured light modulated at high spatial frequencies. Enhanced signal to noise ratio (SNR) is achieved at even ultra-high modulation frequencies with single snapshot multiple frequency demodulation (SSMD). The variations in tissue microstructures, including the strength of the background (pudding) refractive index fluctuation and the prominent scattering structure (plum) morphology, can then be inferred. After validation with optical phantoms, measurements of fresh ex vivo tissue samples revealed significant contrast and differentiation of the phase function parameters between different types and disease states (normal, inflammatory, and cancerous) of tissue whereas tissue absorption and reduced scattering coefficients only show modest changes. HSFDI may provide wide-field images of microscopic structural biomarkers unobtainable with either diffuse light imaging or point-based optical sampling. Potential clinical applications include the rapid screening of excised tissue and the noninvasive examination of suspicious lesions during operation.
OCIS codes: (170.3660) Light propagation in tissues, (170.3880) Medical and biological imaging, (170.6935) Tissue characterization
1. Introduction
One central tenet in the application of light in biology and medicine is noninvasive diagnosis of the structure and function of tissue from tissue-light interaction [1]. Non-contact and minimally invasive endoscopic optical imaging is an invaluable diagnostic tool for tissue examination and cancer screening. As tissue microstructure represents the refractive index variation which scatters light, scattered light by tissue has been used extensively to identify structural alterations or heterogeneities in tissue due to disease or physiological variations [2,3]. Fiber-optics based [4] and confocal [5] techniques have been successfully used to detect such changes in the superficial layer of tissue. The subwavelength features of microstructures at tens of nanometers have been quantified with scattered light as well with point spectroscopic detection [6,7]. A critical drawback of those approaches for clinical applications is that cumbersome and time consuming raster scanning is required for wide-field imaging and often not affordable in clinics.
Wide-field tissue imaging over field of view of 1cm2 or larger is, however, usually not capable of resolving tissue microstructure. For example, diffuse optical imaging (DOI) by multiple scattering light is limited to the mapping of the reduced scattering coefficient on the overall scattering densities. Nevertheless, diffuse optical imaging is unique in being able to quantify both absorption and scattering properties of tissue simultaneously. Consequently one form of DOI, Spatial Frequency Domain Imaging (SFDI) has attracted significant attention recently as one non-contact and quantitative wide field modality for rapid mapping of the optical properties of turbid media such as biological tissue from reflectance measurement [8–14]. The sensitivity to ultrastructural changes is gained by sub-diffusive light at a close source-detector separation or a high spatial modulation [15–17]. By measuring tissue reflectance modulated at a moderate high spatial frequency (<1mm−1), such SFDI can recover one additional scattering parameter (the γ parameter)–an implicit metric of the size-scale distribution of scattering features [18–20]. There are, however, still some notable limitations with the above method. The morphological details and the microscopic structure of the random medium are encoded in the phase function of the medium which describes the angular distribution of the scattered light upon single interaction with the medium [21–23]. The phase function represents the ultimate information about the microenvironment of the medium that can be retrieved remotely. One would desire to quantify the whole phase function rather than one partial measure such as the γ parameter. Furthermore, higher spatial modulation frequencies are preferable as their sensitivity to the microstructure is enhanced. These limitations arise mainly from two factors: first the lack of an analytical model relating the reflectance of sub-diffusive light to the explicit form of the phase function, and second the degradation of the signal to noise ratio for the modulated reflectance preventing higher spatial frequencies to be applied. Lifting these limitations and enabling modulated light to robustly image the phase function may open up a novel platform of genuinely imaging tissue microstructure over a large field of view with structured light. The significant and even dramatic contrast and differentiation between different types and disease states (normal, inflammatory, and cancerous) of tissue revealed below illustrates such platform to be potentially invaluable for the diagnosis of biological and other random media.
In this paper, we present High Spatial Frequency Domain Imaging (HSFDI)–a non-contact imaging modality that for the first time spatially diagnoses the phase function and maps the tissue microscopic scattering structures over a large field of view (>1cm2). Based on an analytical reflectance model of sub-diffusive light from forward-peaked highly scattering media [24], HSFDI quantifies the map of the backscattering probability pπ and the light spreading length lΘ governing sub-diffusive light from the reflectance of structured light modulated at high spatial frequencies (>1mm−1). The deterioration in the signal to noise ratio (SNR) at higher modulation frequencies in SFDI is overcome with Single Snapshot Multiple frequency Demodulation (SSMD) [25]. Enhanced SNR is achieved at even ultra-high modulation frequencies in HSFDI. The variations in tissue microstructures including the strength of the background (pudding) refractive index fluctuation and the prominent scattering structure (plum) morphology can then be inferred [26]. After validation with optical phantoms, measurements of fresh ex vivo tissue samples revealed significant contrast and differentiation of the microstructural parameters between different types and disease states of tissue whereas tissue absorption and reduced scattering coefficients only show modest change. Our results suggest HSFDI may provide wide-field images of microscopic structural biomarkers unobtainable with either diffuse light imaging or point-based optical sampling. HSFDI suits well various clinical applications including rapid screening of excised tissue and noninvasive examination of suspicious lesions during operation.
2. Methods
2.1 Reflectance of sub-diffusive light from forward-peaked scattering media
Light scattering in turbid media such as biological tissue is a complex process as light propagation is governed by the radiative transport (RT) and the most commonly used diffusion approximation to RT breaks down at a short source-detector separation [16]. It is well recognized that reflectance of sub-diffusive light which has suffered few scattering events and remits nearby the incident point is highly sensitive to the phase function (and microstructure) of the scattering medium. An analytical formulism for sub-diffusive reflectance on the exact form of phase function has only been derived recently which established a theoretical foundation for HSFDI [24, 27]. The analytical model incorporates the small-angle scattering approximation (SAA) to radiative transport for sub-diffusive light reflectance at a close source-detector separation and expresses the dependence of the light reflectance from forward-peaked scattering media on the phase function of the scattering medium in a closed form.
Briefly the backscattered light in the forward-peaked scattering medium constitutes three kinds of contributions: SAA photons which have experienced multiple small angle scattering and exactly one large angle scattering, snake photons which experience exactly two large angle scattering, and diffusive photons which experience more than two large angle scattering. The reflectance profile at an arbitrary separation and over the full spatial frequency has been provided [24]. The reflectance of sub-diffusive light is dominated by SAA photons and takes a simple form:
| (1) |
for a spatially modulated plane wave at frequency q>> and of unit power where pπ is the backscattering probability and lΘ ≡ Θ/μs is the spreading length scale governing the angular spreading of sub-diffusive photons. Here the reduced scattering coefficient equals to μs(1-g), μs is the scattering coefficient, and g is the mean cosine of scattering angles. The arbitrary phase function p(θ) of the scattering medium is mapped to:
| (2) |
In Eq. (2), the parameter pb≈2πp(π) = 2πpπ is the percentage of light which is backscattered into the back hemisphere. The mean squared root scattering angle Θ is associated with the prominent scattering structures in tissue and decreases with their size. The former reflects the strength of the refractive index fluctuation (pudding) and the latter the morphology of the prominent scattering centers (plum) in tissue, respectively [24,26]. Reflectance measurement at multiple high spatial frequencies hence can be used to determine pπ and lΘ via Eq. (1) and to infer the microstructure of the medium.
2.2 High spatial frequency domain imaging
Spatial frequency domain imaging (SFDI) is a wide-field and non-contact method that uses spatially modulated structured illumination patterns: , the reflectance takes the form:
| (3) |
where the ratio IAC(x) over represents Modulation Transfer Function (MTF) of reflectance which in turbid media is determined by its optical properties. Three-phase demodulation from three measurements taken at α, α + 2π/3, and α + 4π/3 phase delays are commonly used to extract IAC(x). This demodulation requires three images and, more importantly, suffers from deteriorating SNR and fails at higher spatial modulation frequencies. HSFDI uses an alternative Single Snapshot Multiple frequency Demodulation technique (SSMD) [25]. SSMD makes use of the orthogonality of harmonic functions to extract multiple modulation components simultaneously from a single structured-illuminated image at once. SSMD exhibits excellent noise suppression in imaging, particularly suitable for high modulation frequency imaging [25].
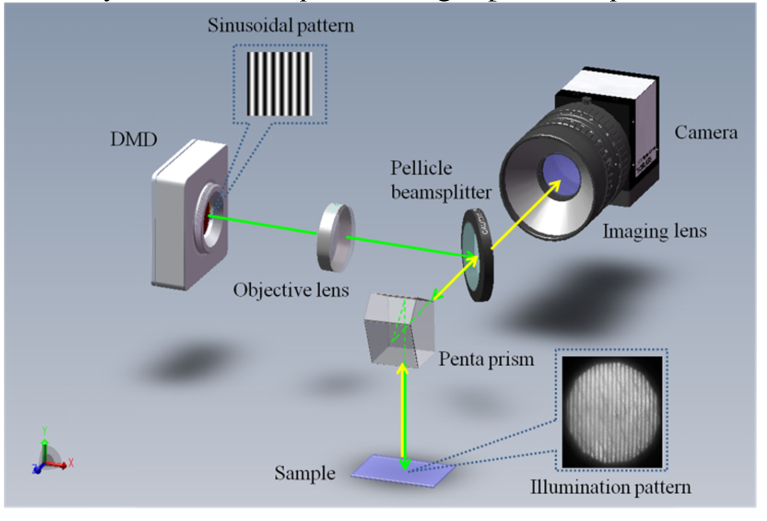
To gain the sensitivity to the phase function (and microstructure) of turbid media, HSFDI operates at high spatial modulation frequencies (>1mm−1). Unlike conventional SFDI setup applicable for low spatial frequency imaging, HSFDI requires both high fidelity and high spatial resolution for modulated illumination and optical imaging systems. The HSFDI instrument is shown schematically in Fig. 1. For the sake of aberration optimization, centered optical configuration is designed using pellicle beam splitter to integrate the modulated illumination system and imaging system without introducing ghosting. The light source is Digital Micromirror Device (DMD, DLP LightCrafter 4500, Texas Instruments) and the red channel (623nm) was used in the reported experiments. The DMD was operated in the pattern mode and the trigger time for one displayed image was set at 10ms. A Canon 5D Mark III camera was used to record the reflectance images with its exposure time set at 50ms. As the output light intensity from the DMD is not linear, calibration was performed to correct this nonlinearity by comparing to the diffuse reflectance from a Lambertian reflectance standard. The modulation transfer function (MTF) of the optical system was also calibrated by imaging resolution test targets (R1L1S1P, Thorlabs, Inc.) over the spatial frequency range. The diffuse reflectance from the Lambertian reflectance standard was used to obtain the illumination intensity, with which the absolute MTF of specimens is determined. The illuminated area on the surface of the specimen was 13mm × 13mm field of view in the reported experiments. The resolution of HSFDI system in the object space is 7.7μm × 7.7μm. The maximum modulated spatial frequency that could be achieved with minimal distortion is 3.33 mm−1 limited by the DMD. The data acquisition speed of HSFDI is very rapid as only a single frame of image is required for reflectance measurement at each high spatial frequency, and it takes approximately 0.3s to accomplish six high spatial frequencies measurements.
Fig. 1.
Schematic diagram of the DMD-based HSFDI system. The structured beam is magnified and projected onto the specimen. Backscattered light from the specimen is imaged onto the camera after passing through the imaging objective.
3. Results and discussion
3.1 Validation with polystyrene sphere suspensions
To test HSFDI in the recovery of phase function parameters (pπ and lΘ), we prepared suspensions of mixed polystyrene spheres. 1.25ml polystyrene sphere suspension of diameter 1.5μm (5.0% concentration) was first diluted by 6.75ml distilled water to yield a measured = 1.25mm−1 at the probing wavelength λ = 623nm. The measured is lower than the theoretical value (2.03mm−1) owing to the precipitation of 1.5μm polystyrene spheres. Then polystyrene sphere suspension of diameter 0.1μm (2.5% concentration) was added at 0.5ml intervals. Such a mixed suspension emulates light scattering by biological tissue with the larger spheres representing the plum and the smaller spheres the pudding following the Plum and Pudding Random Media model for biological tissue [26]. Each mixed suspension was imaged by HSFDI at spatial frequencies of fx = [1/0.9, 1/0.75, 1/0.6, 1/0.45, 1/0.3] mm−1 to recover the phase function parameters pπ and lΘ. The reduced scattering coefficient was also obtained from measurement at a lower spatial frequency fx = 1/3.6 mm−1.
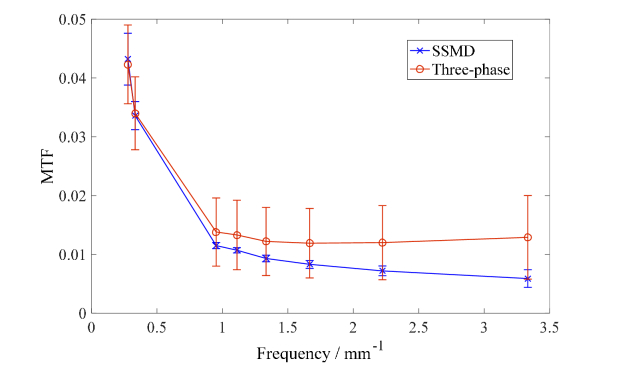
Traditional SFDI suffers from the deterioration in SNR at higher modulation frequencies. Single Snapshot Multiple frequency Demodulation (SSMD) [25] is used in HSFDI which significantly improves the SNR and allows the high-fidelity imaging at a spatial frequency much higher than 1mm−1. Figure 2 exhibits the recovered MTF and their standard deviations of light reflectance of one typical mixed suspension (mixing with 0.50ml diameter 0.1μm polystyrene spheres) by the standard three-phase demodulation method and SSMD method. SSMD shows much smaller standard deviations than the standard three-phase method and, in particular, SSMD performs well at higher frequencies whereas the standard three-phase demodulation fails (MTF should decrease with the modulation frequency).
Fig. 2.
The MTF and standard deviation of light reflectance of one typical mixed suspension with 0.50ml diameter 0.1μm polystyrene spheres retrieved by the standard three-phase method and SSMD method.
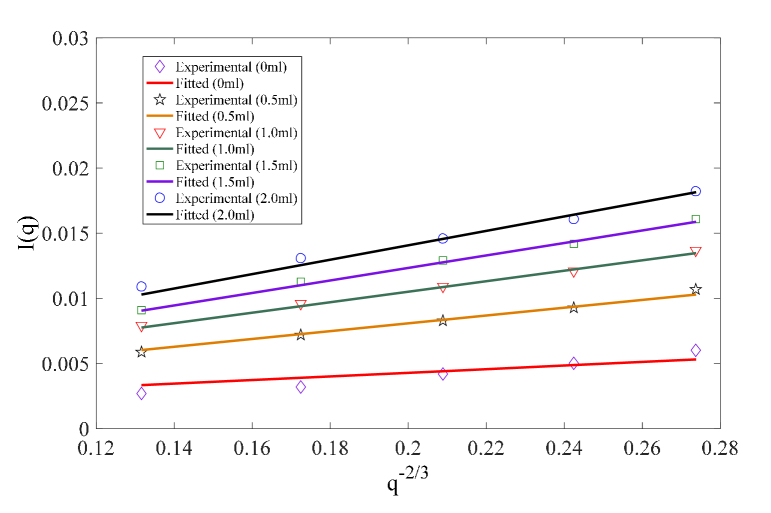
The sub-diffusive light reflectance Eq. (1) agrees well with the experimental measurement (see Fig. 3). The retrieved and phase function parameters pπ and lΘ for various mixed polystyrene sphere suspensions are displayed in Fig. 4. The theoretical curves are computed from the weighted average of large and small polystyrene spheres. In particular, the backscattering probability pπ of 0.1μm polystyrene sphere and 1.5μm polystyrene sphere is 1/4π and 0.0011, respectively. The theoretical value of pπ for the mixed suspension is given by:
| (4) |
where subscripts 1 and 2 represent 1.5μm polystyrene sphere and 0.1μm polystyrene sphere, respectively. We observe overall excellent agreement between the experimentally retrieved parameters and the theoretical values. Both pπ and increases progressively as more suspension of polystyrene sphere of diameter 0.1μm was added. Furthermore, lΘ remains steady overall until the added volume of 0.1μm polystyrene sphere suspension reached 2.0ml, jumping from 0.030mm to 0.042mm. This indicates that the large amount of 0.1μm polystyrene sphere has elevated the isotropic scattering background above a threshold that the mean squared root scattering angle Θ no longer depends on the large scatterer alone.
Fig. 3.
Sub-diffusive light reflectance Eq. (1) provides an excellent fitting to the measured light reflectance for various mixed polystyrene sphere suspensions of diameter 1.5μm and 0.1μm.
Fig. 4.
Comparison between extracted and theoretical and phase function parameters for various mixed polystyrene sphere suspensions of diameter 1.5μm and 0.1μm.
3.2 Tissue type discrimination
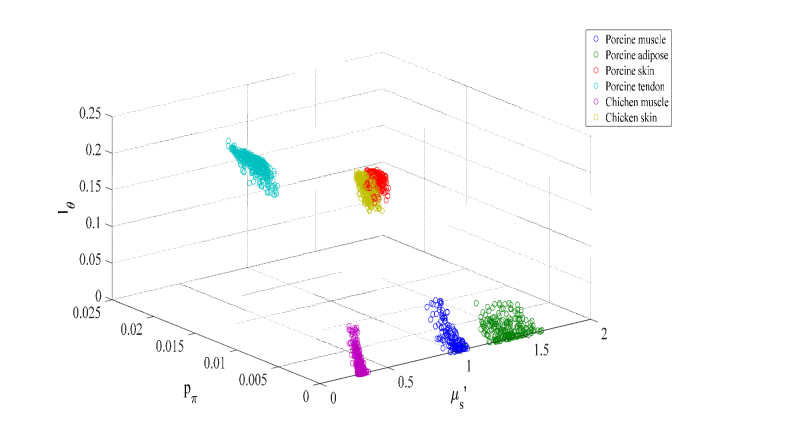
The advantage of HSFDI technique to discriminate tissue microstructure was then demonstrated by imaging porcine and chicken tissue specimens over an area of size 10mm × 10mm at high modulation frequencies [1/0.9, 1/0.75, 1/0.6, 1/0.45, and 1/0.3] mm−1. The absorption coefficient μa and the reduced scattering coefficient were also imaged from measurement at a lower spatial frequency fx = 1/3.6 mm−1. The phase function contrast is from the ultrastructural differences in muscle, adipose, skin and tendon tissue. Table 1 summarizes μa, and phase function parameters pπ, lΘ for porcine (muscle, adipose, skin, and tendon) and chicken (muscle and skin) specimens. The extracted absorption and reduced scattering coefficients (μa, ) of porcine muscle and skin agree with the values reported in the literature [28]. The phase function parameters pπ and lΘ exhibit much improved structural contrast comparing to the reduced scattering coefficient . Different tissue types are all well separated except between porcine and chicken skins (see Fig. 5).
Table 1. The absorption and reduced scattering coefficients μa, and phase function parameters pπ, lΘ for various porcine and chicken tissue types. The standard deviation is computed for the values over the imaged region.
| Tissue type | μa (mm−1) | (mm−1) | pπ | lΘ (mm) |
|---|---|---|---|---|
| Porcine muscle | 0.1846 ± 0.0071 | 0.9187 ± 0.0354 | 0.0049 ± 0.0029 | 0.0131 ± 0.0102 |
| Porcine adipose | 0.0237 ± 0.0036 | 1.4528 ± 0.0863 | 0.0049 ± 0.0030 | 0.0076 ± 0.0052 |
| Porcine skin | 0.0697 ± 0.0046 | 0.9682 ± 0.0354 | 0.0091 ± 0.0006 | 0.1915 ± 0.0069 |
| Porcine tendon | 0.0224 ± 0.0019 | 0.6045 ± 0.0224 | 0.0175 ± 0.0016 | 0.1880 ± 0.0089 |
| Chicken muscle | 0.0143 ± 0.0011 | 0.3168 ± 0.0128 | 0.0003 ± 0.0001 | 0.0110 ± 0.0067 |
| Chicken skin | 0.0239 ± 0.0024 | 0.8980 ± 0.0333 | 0.0082 ± 0.0018 | 0.1660 ± 0.0107 |
Fig. 5.
The triple (the reduced scattering coefficient , and the phase function parameters pπ, lΘ) for various porcine and chicken tissue types is well separated except between porcine and chicken skins.
3.3 Ex vivo cervical carcinoma tissue imaging
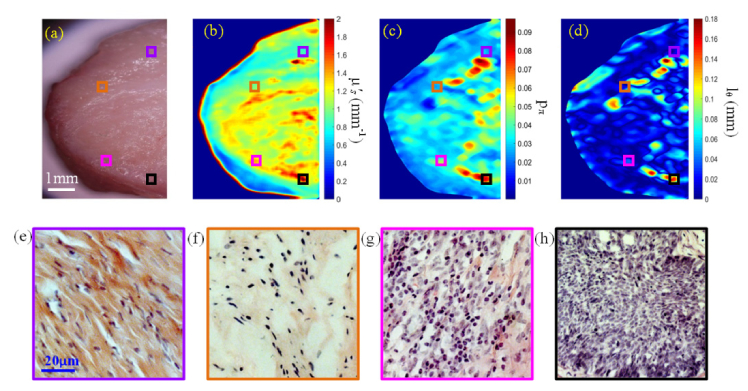
HSFDI was then used to image surgically excised human cervix tissue and evaluated against co-registered histopathological analysis a pilot study. A fresh surgically excised human cervix tissue was cut to a size of approximately 6mm × 12mm × 3mm. After HSFDI imaging, the standard procedure was followed to prepare a frozen section of the top layer of the tissue sample through formaldehyde fixation and H&E staining. The surface section matched the HSFDI maps well in shape other than slight distortions caused by histological processing.
White light photograph of the cervical tissue specimen and the retrieved maps of , pπ and lΘ are displayed in Fig. 6(a-d) together with the H&E stained histological images for four highlighted representative regions including normal cervical tissue, slight inflammation, severe inflammation, and invasive squamous-cell carcinoma in Fig. 6(e-h). Please note that a trained pathologist provided detailed pathological evaluations of tissue section based on morphological features such as cell differentiation, nuclear to cytoplasmic ratio, and production of extra-cellular collagen. Besides the four regions shown in Fig. 6, we have also analyzed other randomly selected regions on the sample, comparing their optical parameters and the pathological evaluations. The absorption and reduced scattering coefficients μa, , phase function parameters pπ, lΘ, and the morphology indicator Θ(1-g) for these regions of different disease states are summarized in Table 2.
Fig. 6.
(a) Photograph of cervical carcinoma tissue specimen; (b) The retrieved map; (c) The retrieved pπ map; (d) The retrieved lΘ map; (e-h) H&E stained histological images for the four highlighted regions in (a-d) including normal cervical tissue (violet), slight inflammation (orange), severe inflammation (pink), and invasive squamous-cell carcinoma (black).
Table 2. The absorption and reduced scattering coefficients μa, , phase function parameters pπ, lΘ, and the morphology indicator Θ(1-g) = lΘ· for different disease states of the human cervix tissue. The standard deviation is computed for the values over the highlighted region.
| μa (mm−1) | (mm−1) | pπ | lΘ (mm) | Θ(1-g) | |
|---|---|---|---|---|---|
| Normal cervical tissue | 0.0176 ± 0.0013 | 0.8995 ± 0.0617 | 0.0034 ± 0.0015 | 0.0183 ± 0.0081 | 0.0163 ± 0.0077 |
| Slight inflammation | 0.0253 ± 0.0026 | 1.1541 ± 0.1378 | 0.0056 ± 0.0047 | 0.0227 ± 0.0140 | 0.0297 ± 0.0188 |
| Severe inflammation | 0.0474 ± 0.0075 | 1.2563 ± 0.0880 | 0.0186 ± 0.0063 | 0.0382 ± 0.0158 | 0.0432 ± 0.0162 |
| Invasive carcinoma | 0.0401 ± 0.0036 | 1.4121 ± 0.2447 | 0.0457 ± 0.0133 | 0.1007 ± 0.0407 | 0.1608 ± 0.0825 |
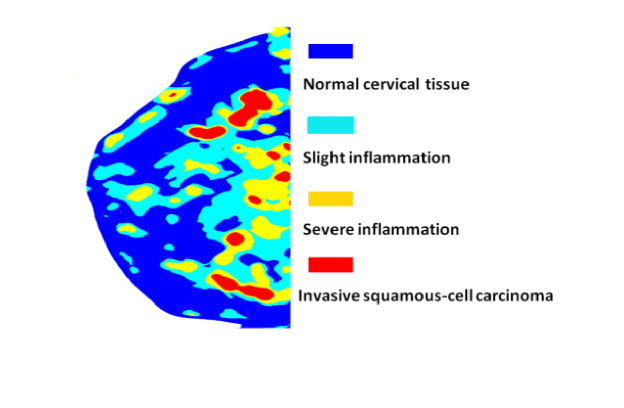
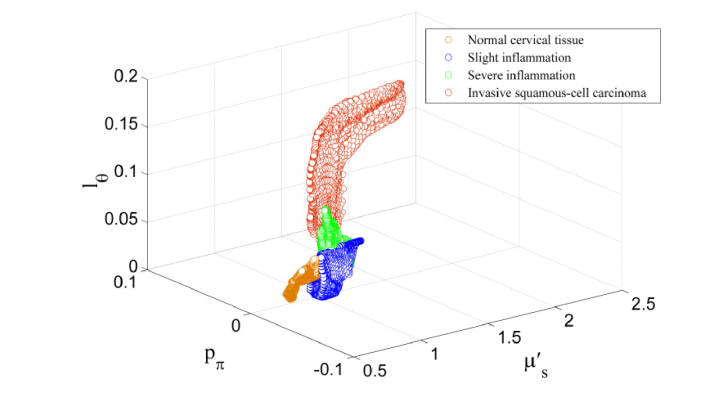
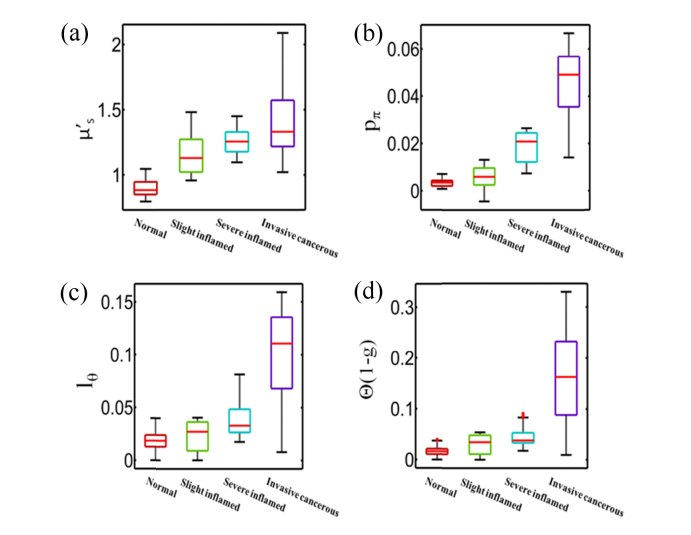
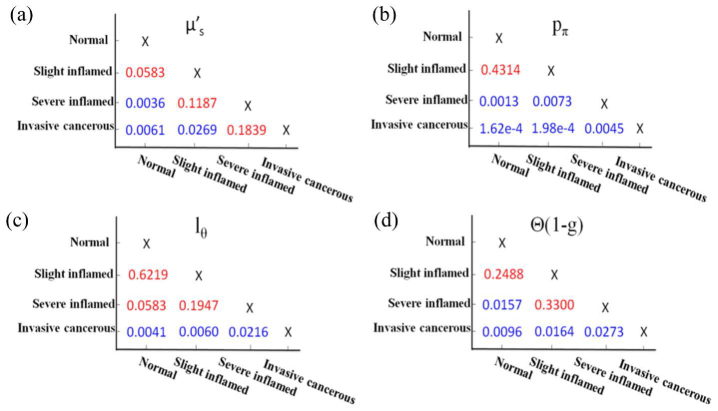
Significant contrast is observed in pπ, lΘ between the different disease states. The steady increase of pπ, lΘ from normal cervical tissue, slight inflammation, severe inflammation, to invasive squamous-cell carcinoma quantifies the enhancement in the background refractive index fluctuation (pudding) and the shrinkage of the size of the prominent scattering centers (plum) [26]. The morphology indicator Θ(1-g) computed by the product of and lΘ captures the pure microstructural characteristics (and is independent on the densities of the scatterers), demonstrating a dramatic contrast and differentiation between normal, inflammatory, and cancerous tissue. Different disease states of human cervix tissue are all well separated with HSFDI imaging (see Figs. 7-8). As one illustration of the potential application of HSFDI, the entire specimen could be classified according to the value of Θ(1-g) into different disease states based on Table 2 (see Fig. 7). The normal, slightly inflammatory, severely inflammatory, and cancerous regions are identified by the increasing morphology indicator. To quantitatively assess disease state discrimination on cervix tissue, box and whisker plots have been given in Fig. 9 for each optical scatter parameter. The two-sample t-tests have also been performed between each pair of tissue types. The resulting p-values are tabulated in Fig. 10 for all three scatter parameters, pπ, lΘ, and the morphology indicator Θ(1-g), with a blue color indicating a significant p-value at the p < 0.05 level. A smaller p-value suggests a more significant discrimination power between two different disease states of tissues. It is remarkable that the new phase function parameters (pπ, lΘ) and Θ(1-g) unlike the reduced scattering coefficient can distinguish cancer, severely inflammatory and other disease states (see Fig. 10).
Fig. 7.
Classification of different disease states (normal, slightly inflammatory, severely inflammatory, and cancerous) of cervical tissue specimen according to the value of the morphology indicator Θ(1-g) .
Fig. 8.
The triple (the reduced scattering coefficient , and the phase function parameters pπ, lΘ) differentiates well the various disease states of human cervix tissue.
Fig. 9.
Box and whisker plots for all points used in the cluster analysis for (a) , (b) pπ, (c) lΘ and (d) Θ(1-g).
Fig. 10.
The two-sample t-test p-values for each pairwise combination of tissue diagnoses with each scatter parameter (a) , (b) pπ,(c) lΘ and (d) Θ(1-g). The blue color indicates a significant p-value at the p < 0.05 level. A smaller p-value suggests a more significant discrimination power between two different disease states of tissues.
These data demonstrate the ability of HSFDI to rapidly assess whole-tissue specimen where point-source or microscopic-based tissue interrogation methods would have to randomly sample a large number of locations to achieve similar robustness. Moreover, the phase function parameters pπ, lΘ and the morphology indicator Θ(1-g) recovered by HSFDI is highly sensitive to microstructural alterations. The backscattering probability (pπ) reflects the strength of the background refractive index fluctuation (pudding), the spreading length (lΘ) is associated with the morphology of the prominent scattering centers (plum), and the morphology indicator captures the pure density-independent characteristics of the microstructure. These microstructural biomarkers exhibit significant contrast and differentiation between normal, inflammatory, and cancerous tissue. For example, the morphology indicator was observed to have a contrast of 4:1 or above between cancerous and noncancerous human cervix tissue (see Table 2). Such a contrast and differentiation is significantly stronger than those obtained in earlier efforts in sub-diffusive SFDI (<1mm−1) [20] whose γ parameter varied between 1.5 and 1.8 for different breast tissue (fibroglandular, benign fibroadenoma, and invasive carcinoma). This can be attributed to the significantly enhanced sensitivity to the microstructure for HSFDI operating at much higher spatial modulation frequencies (>1mm−1) through innovations in both theoretical modeling and demodulation techniques. Although the number of specimens studied here is limited, the promising results suggest HSFDI may provide wide-field images of microscopic structural biomarkers unobtainable with either diffuse light imaging or point-based optical sampling. We envision that HSFDI may be applied in various clinical applications including rapid screening of excised tissue and noninvasive examination of suspicious lesions during operation.
4. Conclusions
We have presented High Spatial Frequency Domain Imaging (HSFDI)–a non-contact imaging modality that spatially maps the tissue microscopic scattering structures over a large field of view (>1cm2). HSFDI quantifies the spatially-resolved microstructural parameters of the medium from the reflectance of structured light modulated at high spatial frequencies. The variations in tissue microstructures including the strength of the background (pudding) refractive index fluctuation and the prominent scattering structure (plum) morphology are then inferred by the recovered light backscattering probability, the spreading length, and the morphology indicator. After validation with optical phantoms, measurements of fresh ex vivo tissue samples have revealed significant contrast and differentiation of the microstructural parameters between different types and disease states of tissue whereas tissue absorption and reduced scattering coefficients only show modest change. HSFDI may emerge as one promising rapid wide-field modality imaging tissue microstructure with potential clinical applications in rapid screening of excised tissue and noninvasive examination of suspicious lesions during operation.
Acknowledgments
We thank Xue J for clinical support.
Funding
Natural Science Foundation of Zhejiang Province (LZ16H180002); National Natural Science Foundation of China (81470081); Wenzhou Municipal Science and Technology Bureau (ZS2017022); Wenzhou Municipal Science and Technology Bureau (Y20170219); National Science Foundation, USA (1607664).
Disclosures
We report a patent application related to the technology and analysis methods described in this study. The authors declare that there are no other conflicts of interest related to this article.
References and links
- 1.Chance B., “Optical method,” Annu. Rev. Biophys. Biophys. Chem. 20(1), 1–30 (1991). 10.1146/annurev.bb.20.060191.000245 [DOI] [PubMed] [Google Scholar]
- 2.Yodh A., Tromberg B., Sevick Muraca E., Pine D.,“Diffusing photons in turbid media,” J. Opt. Soc. Am. A 14, 136–342 (1997). [DOI] [PubMed] [Google Scholar]
- 3.Wilson B. C., “Detection and treatment of dysplasia in Barrett’s esophagus: a pivotal challenge in translating biophotonics from bench to bedside,” J. Biomed. Opt. 12(5), 051401 (2007). 10.1117/1.2795688 [DOI] [PubMed] [Google Scholar]
- 4.Austwick M. R., Clark B., Mosse C. A., Johnson K., Chicken D. W., Somasundaram S. K., Calabro K. W., Zhu Y., Falzon M., Kocjan G., Fearn T., Bown S. G., Bigio I. J., Keshtgar M. R., “Scanning elastic scattering spectroscopy detects metastatic breast cancer in sentinel lymph nodes,” J. Biomed. Opt. 15(4), 047001 (2010). 10.1117/1.3463005 [DOI] [PMC free article] [PubMed] [Google Scholar]
- 5.Itzkan I., Qiu L., Fang H., Zaman M. M., Vitkin E., Ghiran I. C., Salahuddin S., Modell M., Andersson C., Kimerer L. M., Cipolloni P. B., Lim K. H., Freedman S. D., Bigio I., Sachs B. P., Hanlon E. B., Perelman L. T., “Confocal light absorption and scattering spectroscopic microscopy monitors organelles in live cells with no exogenous labels,” Proc. Natl. Acad. Sci. U.S.A. 104(44), 17255–17260 (2007). 10.1073/pnas.0708669104 [DOI] [PMC free article] [PubMed] [Google Scholar]
- 6.Backman V., Roy H. K., “Light-scattering technologies for field carcinogenesis detection: a modality for endoscopic prescreening,” Gastroenterology 140(1), 35–41 (2011). 10.1053/j.gastro.2010.11.023 [DOI] [PMC free article] [PubMed] [Google Scholar]
- 7.Cherkezyan L., Capoglu I., Subramanian H., Rogers J. D., Damania D., Taflove A., Backman V., “Interferometric spectroscopy of scattered light can quantify the statistics of subdiffractional refractive-index fluctuations,” Phys. Rev. Lett. 111(3), 033903 (2013). 10.1103/PhysRevLett.111.033903 [DOI] [PMC free article] [PubMed] [Google Scholar]
- 8.Konecky S. D., Mazhar A., Cuccia D., Durkin A. J., Schotland J. C., Tromberg B. J., “Quantitative optical tomography of sub-surface heterogeneities using spatially modulated structured light,” Opt. Express 17(17), 14780–14790 (2009). 10.1364/OE.17.014780 [DOI] [PMC free article] [PubMed] [Google Scholar]
- 9.Vervandier J., Gioux S., “Single snapshot imaging of optical properties,” Biomed. Opt. Express 4(12), 2938–2944 (2013). 10.1364/BOE.4.002938 [DOI] [PMC free article] [PubMed] [Google Scholar]
- 10.O’Sullivan T. D., Cerussi A. E., Cuccia D. J., Tromberg B. J., “Diffuse optical imaging using spatially and temporally modulated light,” J. Biomed. Opt. 17(7), 071311 (2012). [DOI] [PMC free article] [PubMed] [Google Scholar]
- 11.Kanick S. C., McClatchy D. M., Krishnaswamy V., Elliott J. T., Paulsen K. D., Pogue B. W., “Sub-diffusive scattering parameter maps recovered using wide-field high-frequency structured light imaging,” Biomed. Opt. Express 5(10), 3376–3390 (2014). 10.1364/BOE.5.003376 [DOI] [PMC free article] [PubMed] [Google Scholar]
- 12.Lin A. J., Koike M. A., Green K. N., Kim J. G., Mazhar A., Rice T. B., LaFerla F. M., Tromberg B. J., “Spatial frequency domain imaging of intrinsic optical property contrast in a mouse model of Alzheimer’s disease,” Ann. Biomed. Eng. 39(4), 1349–1357 (2011). 10.1007/s10439-011-0269-6 [DOI] [PMC free article] [PubMed] [Google Scholar]
- 13.Laughney A. M., Krishnaswamy V., Rizzo E. J., Schwab M. C., Barth R. J., Cuccia D. J., Tromberg B. J., Paulsen K. D., Pogue B. W., Wells W. A., “Spectral discrimination of breast pathologies in situ using spatial frequency domain imaging,” Breast Cancer Res. 15(4), R61 (2013). 10.1186/bcr3455 [DOI] [PMC free article] [PubMed] [Google Scholar]
- 14.Chen X., Lin W., Wang C., Chen S., Sheng J., Zeng B., Xu M., “In vivo real-time imaging of cutaneous hemoglobin concentration, oxygen saturation, scattering properties, melanin content, and epidermal thickness with visible spatially modulated light,” Biomed. Opt. Express 8(12), 5468–5482 (2017). 10.1364/BOE.8.005468 [DOI] [PMC free article] [PubMed] [Google Scholar]
- 15.Mourant J. R., Boyer J., Hielscher A. H., Bigio I. J., “Influence of the scattering phase function on light transport measurements in turbid media performed with small source-detector separations,” Opt. Lett. 21(7), 546–548 (1996). 10.1364/OL.21.000546 [DOI] [PubMed] [Google Scholar]
- 16.Bevilacqua F., Depeursinge C., “Monte Carlo study of diffuse reflectance at source–detector separations close to one transport mean free path,” JOSA A 16(12), 2935–2945 (1999). 10.1364/JOSAA.16.002935 [DOI] [Google Scholar]
- 17.Calabro K. W., Bigio I. J., “Influence of the phase function in generalized diffuse reflectance models: review of current formalisms and novel observations,” J. Biomed. Opt. 19(7), 075005 (2014). 10.1117/1.JBO.19.7.075005 [DOI] [PMC free article] [PubMed] [Google Scholar]
- 18.Neil M. A., Juškaitis R., Wilson T., “Method of obtaining optical sectioning by using structured light in a conventional microscope,” Opt. Lett. 22(24), 1905–1907 (1997). 10.1364/OL.22.001905 [DOI] [PubMed] [Google Scholar]
- 19.Krishnaswamy V., Elliott J. T., McClatchy D. M., Barth R. J., Jr, Wells W. A., Pogue B. W., Paulsen K. D., “Structured light scatteroscopy,” J. Biomed. Opt. 19(7), 070504 (2014). 10.1117/1.JBO.19.7.070504 [DOI] [PubMed] [Google Scholar]
- 20.McClatchy D. M., Rizzo E. J., Wells W. A., Cheney P. P., Hwang J. C., Paulsen K. D., Pogue B. W., Kanick S. C., “Wide-field quantitative imaging of tissue microstructure using sub-diffuse spatial frequency domain imaging,” Optica 3(6), 613–621 (2016). 10.1364/OPTICA.3.000613 [DOI] [PMC free article] [PubMed] [Google Scholar]
- 21.Schmitt J. M., Kumar G., “Optical scattering properties of soft tissue: a discrete particle model,” Appl. Opt. 37(13), 2788–2797 (1998). 10.1364/AO.37.002788 [DOI] [PubMed] [Google Scholar]
- 22.Xu M., Wu T. T., Qu J. Y., “Unified Mie and fractal scattering by cells and experimental study on application in optical characterization of cellular and subcellular structures,” J. Biomed. Opt. 13(2), 024015 (2008). 10.1117/1.2907790 [DOI] [PubMed] [Google Scholar]
- 23.Xu M., Alfano R. R., “Fractal mechanisms of light scattering in biological tissue and cells,” Opt. Lett. 30(22), 3051–3053 (2005). 10.1364/OL.30.003051 [DOI] [PubMed] [Google Scholar]
- 24.Xu M., “Diagnosis of the phase function of random media from light reflectance,” Sci. Rep. 6(1), 22535 (2016). 10.1038/srep22535 [DOI] [PMC free article] [PubMed] [Google Scholar]
- 25.Xu M., Cao Z., Lin W., Chen X., Zheng L., Zeng B., “Single snapshot multiple frequency modulated imaging of subsurface optical properties of turbid media with structured light,” AIP Adv. 6(12), 125208 (2016). 10.1063/1.4971428 [DOI] [Google Scholar]
- 26.Xu M., “Plum pudding random medium model of biological tissue toward remote microscopy from spectroscopic light scattering,” Biomed. Opt. Express 8(6), 2879–2895 (2017). 10.1364/BOE.8.002879 [DOI] [PMC free article] [PubMed] [Google Scholar]
- 27.Lin W., Cao Z., Zeng B., Xu M., “Quantitative modulated imaging of turbid media in the high spatial frequency domain,” Proc. SPIE 9701, 97010Y (2016). 10.1117/12.2212097 [DOI] [Google Scholar]
- 28.Bashkatov A. N., Genina E. A., Tuchin V. V., “Optical properties of skin, subcutaneous, and muscle tissues: a review,” J. Innov. Opt. Health Sci. 4(1), 9–38 (2011). 10.1142/S1793545811001319 [DOI] [Google Scholar]


