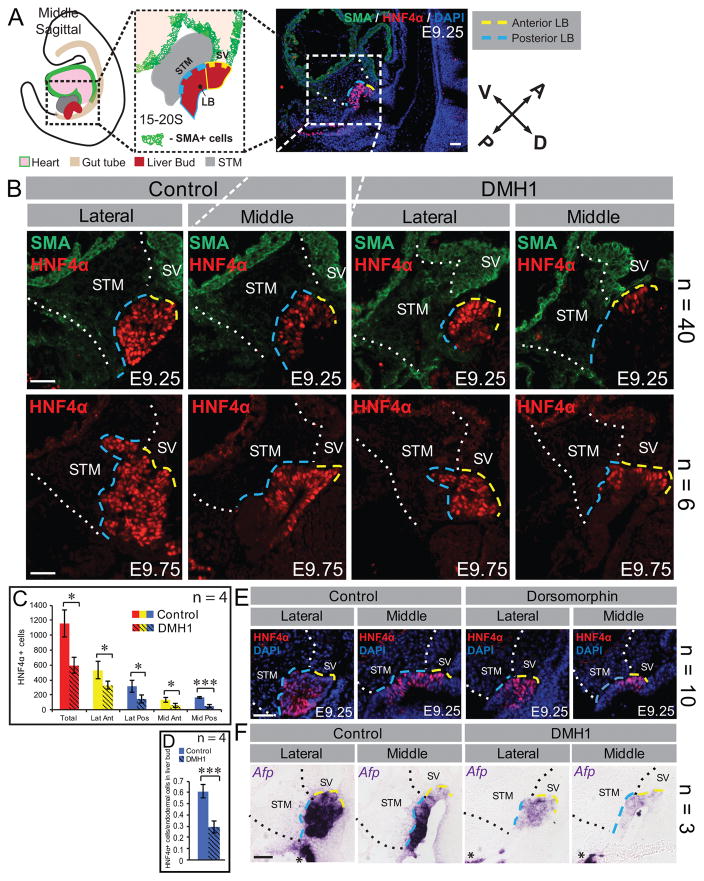
Figure 1. Loss of posterior liver bud upon BMP inhibition.
A) An illustrated sagittal view of an embryo depicting the orientation of the liver with respect to the whole embryo. Encased in the black dashed box is an illustration of sagittal section through the middle plane of the liver bud (LB) and highlights the anterior liver bud (yellow dashes), the posterior liver bud (blue dashes) and their surrounding mesoderm derivatives: the sinus venosus (SV) and the septum transversum mesenchyme (STM, gray). The SV walls and cardiac tissue (ventral to the STM) are smooth muscle actin (SMA) positive (+). A lower magnification of a sagittal section depicted in (B), but representative of most presented herein demonstrates that the anterior liver bud is bounded by the SMA+ sinus venosus (SV) while the posterior liver bud is bounded by the STM. The white dotted lines demarcate the anterior and posterior boundaries of the STM. The orientation of the anterior/posterior (A/P) and dorsal/ventral (D/V) axis of the embryo is represented by the compass. All sections are similarly oriented and illustrated unless otherwise specified. (B) Immunofluorescence with the indicated markers, performed on sagittal sections from control and DMH1 treated embryos. DMH1 treatment causes a reduction in liver bud size compared with control whether cultured to E9.25 (upper panels) or E9.75 (lower panels). In drug treated embryos, the most dramatic loss of HNF4α is in the posterior liver bud in the middle sections. (C, D) Quantification of HNF4α+ cells in the indicated liver bud regions of similarly staged control and DMH1-treated embryos reveals a significant reduction of HNF4α+ cells throughout the liver bud of the latter. The most dramatic reduction occurs in the middle posterior. Lat = lateral; Ant = anterior; Pos = posterior; Mid = Middle. (E) HNF4α immunofluorescence on sagittal sections from control and Dorsomorphin treated embryos. Like DMH1, Dorsomorphin treated embryos show a reduced liver bud with the most dramatic loss of HNF4α in the middle of the posterior liver bud. (F) In situ hybridization with an Afp antisense probe reveals a profound reduction of this marker throughout the posterior liver bud of DMH1 treated embryos. The black asterisks indicate Afp expression in the visceral endoderm of the yolk sac. The boundaries of the STM are marked with black dotted lines in this panel for clarity. The number of embryos (n) analyzed in each group is indicated on the right side of panel. * = p<0.05, *** = p<0.001. Error bars represent standard deviation. Each scale bar = 50 μM.

