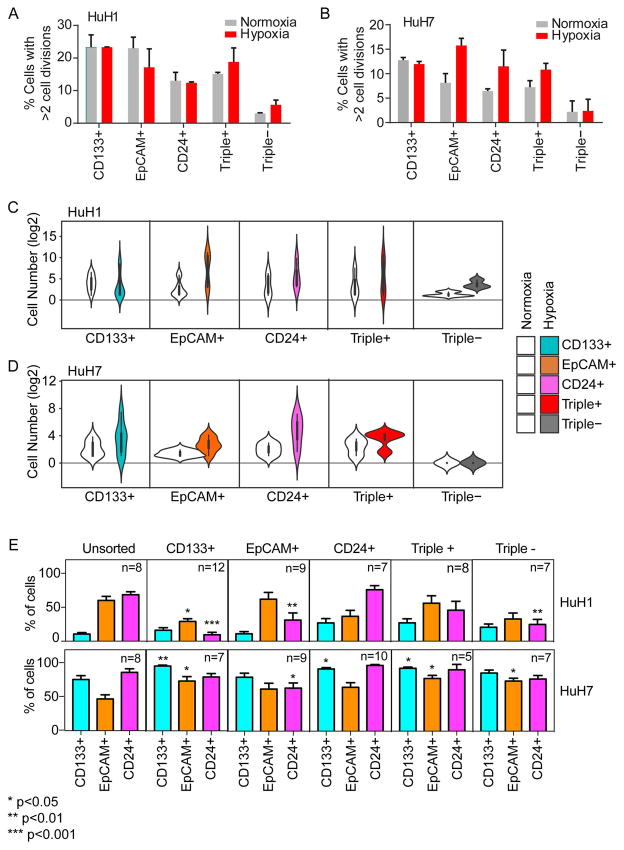
Figure 2. Single-cell functional analysis reveals distinct self-renewal and differentiation capacities of HCC cells defined by hepatic CSC surface markers.
(A and B) Barplots showing the percent of single cells with >2 cell divisions during 2-week culture after flow sorting. Single cells from HuH1 (A) or HuH7 (B) were stained and cells were sorted based on surface marker (CD133, CD24 and EpCAM) status, and further cultured individually in normoxia or hypoxia conditions for 2 weeks. Experiments were performed in triplicate and data are shown as mean ± SEM. (C and D) Violin plots showing the cell number (log2) of single cell-derived clones. The single cells from HuH1 (C) and HuH7 (D) were sorted and cultured as in (A and B), and the surface marker status is shown as indicated. (E) Barplots showing the percentage of CSC surface marker positive cells (CD133+, EpCAM+ and CD24+; bottom) within the single-cell derived cell populations. The single cells from HuH1 and HuH7 were defined and sorted as in (A and B) and cultured for one month. The derived cell population was analyzed by flow cytometry. The surface marker status of the original single cells is shown on the top panel as CD133+, EpCAM+ CD24+, Triple+ and Triple−. “n” indicates the number of the original cultured single cells. Unsorted cells were used as a control and in this instance, “n” indicates replicate analyses.

