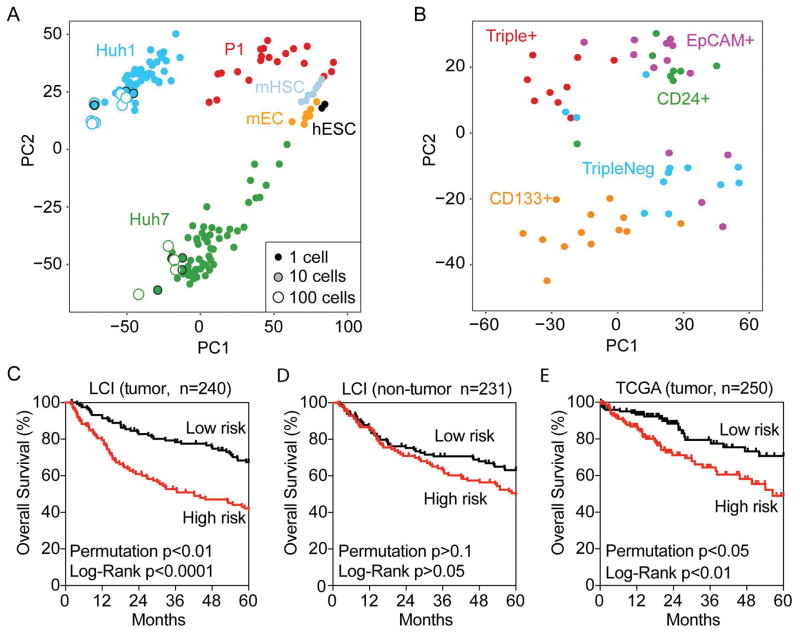
Figure 3. Single-Cell transcriptomic analysis reveals heterogeneity of marker-defined CSCs.
(A) Multidimensional scaling analysis illustrates the relative similarity between all 118 single HCC cells, cell pools (10cell [n=8], 100cells [n=12]) and population controls. The small-size solid circles represent single cells, the medium-size shaded circles with a black outline represent 10 cells while the large-size open circles represent 100 cells. The distance between any two cells reflects the similarity of their transcriptomic profiles. Cells group mainly by their origin (color code) as indicated, i.e., HuH1, HuH7 cells, one primary HCC fresh tissue (P1 [n=20]), mouse hematopoietic stem cell (mHSC [n=7]), mouse embryonic cell (mEC [n=7]) and human embryonic stem cell (hESC [n=2]). All data were median normalized. (B) Multidimensional scaling illustrates the relative similarity between all 55 single cells from the HuH7 cell line with defined surface marker status. Cell cluster by marker expression status as indicated, but each subpopulation also contains outliers that are more similar to cells in other subpopulations. (C, D and E) Survival Risk Predictions of 240 tumor cases (C) and 231 non-tumor cases (D) in the LCI cohort, and 250 cases of tumor in TCGA with available survival data were performed using the Triple+ vs Triple− differential expressed gene set from HuH7 cells. The corresponding Kaplan-Meier survival curves are shown for high-risk and low-risk survival groups with the log-rank p value and the permuted p value.

