Abstract
We present a quantitative statistical analysis of pairwise crossings for all fibers obtained from whole brain tractography that confirms with high confidence that the “brain grid theory” (Wedeen et al., Science, 30 March 2012, p. 1628) is not supported by the evidence. The overall fiber tracts structure appears to be more consistent with small angle tree-like branching of tracts rather than with near orthogonal grid-like crossing of fiber sheets. The analysis uses our new method for high resolution whole brain tractography that is capable of resolving fibers crossing of less than 10° and correctly following a continuous angular distribution of fibers even when the individual fiber directions are not resolved. This analysis also allows us to demonstrate that the whole brain fiber pathway system is very well approximated by a lamellar vector field, providing a concise and quantitative mathematical characterization of the structural connectivity of the human brain.
Keywords: Brain fiber pathways, diffusion weighted magnetic resonance imaging, fiber tractography, brain fiber crossing
1 Introduction
Advances in modern digital imaging methods are revolutionizing a wide range of scientific disciplines. One of these truly revolutionary approaches that has become ubiquitous in basic neuroscience research and has the potential to significantly impact a wide range of clinical applications is the non-invasive reconstruction of neural tissue fiber pathways from volumetric diffusion tensor magnetic resonance imaging (DTI) data. The basic DTI procedure is to collect multiple image volumes (a Cartesian sampling of image space), each with a different combination of the magnitude and direction of the diffusion sensitivity. The standard procedure for analyzing this data is to reconstruct the local (i.e, voxel) diffusion profile from this sampling of diffusion sensitivity, or q, space, then estimate global measures of connectivity (tracts) by constructing relationships between the diffusion profiles in each voxel in the Cartesian image space, typically by generating streamlines through the angular maxima of the voxel-derived diffusion profiles, or probability density functions (PDFs).
Wedeen et al. (2012a) used a variant of the DTI protocol called diffusion spectrum imaging (DSI) to develop a theory that white matter fibers form a regular grid by crossing almost orthogonally and uniformly in the entire brain. The DSI protocol performs a Cartesian sampling of q-space, then estimates the average diffusion propagator locally (in each voxel), and finally extracts the orientation distribution function (ODF), the radial average PDF (Tuch et al., 2002), again in each voxel. This locally estimated ODF is used to guide the global fiber tractography (Conturo et al., 1999; Basser et al., 2000; Mori & van Zijl, 2002; Jbabdi & Johansen-Berg, 2011) which implicitly assumes that all the information about the crossing of fibers can be extracted from this local ODF. A significant and overly simplistic assumption that is made is that an ODF with a single lobe describes a unidirectional set of fibers whereas an ODF with multiple lobes possessing relatively similar amplitudes is assumed to represent multiple fiber orientations.
The grid theory was criticized by Catani et al. (2012) who used whole brain streamline tractography based on a different local diffusion profile estimation technique, the spherical deconvolution (SD), which has been demonstrated to consistently resolve fiber crossings above at least 45° (Tournier et al., 2007). Their results show the distribution of the angles of fiber crossing in a sample of 10 healthy human brains and demonstrate the high probability of nonorthogonal fiber crossings in the human brain, with nonorthogonal crossings at least as likely (and probably more likely) as orthogonal crossings, which were shown to account for less than 12% of the total crossings in the human white matter. Their conclusion is thus that the grid pattern observed by Wedeen is most likely an artifact attributable to the limitations of the DSI approach, which has low angular resolution and thus preferentially detects orthogonal crossings since streamlines through non-orthogonal fibers stop in the deep white matter. This is probably due to a limitation of the majority of deterministic tracking approaches that not only prohibit sharp fiber turns but typically impose explicit or implicit stopping criteria to avoid tracking through low anisotropy regions. The result is that the appearance of the vast majority of fiber crossing appear to be orthogonal.
In the response to Catani’s criticism, Wedeen et al. (2012b) claim that their DSI acquisition has higher spatial and/or diffusion resolution and therefore is able to detect many areas where the fiber tracts exhibit very sharp change of direction. Hence, the current MRI tractography that relies on orientation continuity (i.e., requires path curvature of ≲ 1 rad/voxel) (Wedeen et al., 2008) is the culprit of those artifactual trajectories, as it is unable to continue paths through those areas and instead just shows terminations of corticospinal paths where they should be turning sharply. Moreover, it is claimed that the Cartesian q-space sampling used in their implementation of DSI presents a lower risk of bias and is thus a more conservative choice of methods when microstructure is uncertain (Wedeen et al., 2012b). More recently, in a sequence of workshop presentations (Tax et al., 2013, 2014, 2015; Tax, Haije, et al., 2016; Tax, Westin, et al., 2016) several quantitative techniques were attempted to evaluate the existence of sheet structure, but no convincing arguments were provided.
In this paper we present a quantitative statistical analysis of pairwise crossings for all fibers obtained from whole brain tractography that confirms with high confidence that the “brain grid theory” is not supported by the evidence. The analysis uses our new method for high resolution whole brain tractography that is capable of resolving fibers crossing of less than 10°. This analysis also allows us to demonstrate that the whole brain fiber pathway system is very well approximated by a lamellar vector field, providing a concise and quantitative mathematical characterization of the structural connectivity of the human brain.
2 Method
In an attempt to resolve the “brain grid theory” controversy, we conducted a high resolution tractography study using our recently developed (Frank & Galinsky, 2014; Galinsky & Frank, 2015) Geometrical Optics guided Entropy Spectrum Pathways (GO-ESP) fiber tracking method (the details of our tracking approach can be found in (Galinsky & Frank, 2015). The GO-ESP method performs a simultaneous estimation of the local diffusion profile and the global structure of the fiber pathways by the use of prior information on local coupling within a fully Bayesian probabilistic framework. Thus in a formal probabilistic sense it is the most conservative approach to the inverse problem of determining fiber pathways from diffusion weighted MRI signals. Moreover, because the GO-ESP tracking approach is based on geometrical optics, it does not introduce limits on paths curvature, and in certain circumstances should theoretically be able to detect nearly complete path reversals (~ 180°), in a manner similar to those found in optical reflection. Hence it is able to detect and proceed though the sharp turns reported by Wedeen et al. (2012b). More importantly, the GO-ESP approach does not rely on the locally inferred ODF and does not make any assumptions about number of crossing fibers present in each voxel. Instead, we assume a continuous distribution of fiber directions and derive an equation to update the fiber orientation at each tracking step in a globally consistent way. Hence, we trace both fiber position r and fiber orientation k simultaneously by solving two equations of Hamilton-Jacobi type at each step (Galinsky & Frank, 2015)
| (1) |
where ℋ is the Hamiltonian that can be expressed through equilibrium and transitional probabilities using the Entropy Spectrum Pathways procedure (Frank & Galinsky, 2014). The traditional fiber tracking approach defines tracts by integration of position–only function ψ, that assigns the tangential direction of tracts to each location r. For our geometrical optics GO-ESP approach, the integration takes into account both the orientation and multiple scales, through the dependence of ψ on directional angle k/|k| and magnitude |k|. The details about functions ψ and ξ can be found in Galinsky & Frank (2015).
For the whole brain tractography we used one of the publicly accessible diffusion imaging datasets (MGH 1010) available from the Human Connectome Project (Van Essen et al., 2012; Sotiropoulos et al., 2013), as well as several diffusion imaging datasets collected locally.
The HCP MGH 1010 dataset was collected on the customized Siemens 3T Connectom scanner, which is a modified 3T Skyra system (MAGNETOM Skyra Siemens Healthcare), housed at the MGH/HST Athinoula A. Martinos Center for Biomedical Imaging (see Setsompop et al. (2013) for details of the scanner design and implementation). A 64-channel, tight-fitting brain array coil (Keil et al., 2013) was used for data acquisition. The dataset contains 96 slices of 140×140 matrix (1.5 mm linear voxel size) at four levels of diffusion sensitizations (b-values b=1k, 3k, 5k and 10k s/mm2) distributed over 552 total q-vectors.
The local data were collected by the UCSD Center for Functional MRI (CFMRI) using 3T GE Discovery MR750 whole body system. The anatomical T1 volumes have 168×256×256 voxel size with 1.2×0.9375×0.9375mm3 resolution. A multiband DTI EPI acquisition (Setsompop et al., 2011) using three simultaneous slice excitations was used to acquire data with three diffusion sensitizations (at b-values b=1000/2000/3000 s/mm2) for 30, 45 and 65 different diffusion gradients (respectively) uniformly distributed over a unit sphere. Several baseline (b=0) images were also recorded. The data were reconstructed offline using the CFMRI’s multiband reconstruction routines. The DWI datasets have 100×100×72 voxel size with 2×2×2mm3 resolution.
The spherical multishell encoding is different from the DSI Cartesian q-space sampling of Wedeen et al. (2012a), but with 552 q-vectors it provides better angular (diffusion) resolution then DSI sampling with 515 q-vectors distributed inside the sphere of radius 5. Both acquisition schemes have a comparable number of diffusion sampling directions but in our acquisition the diffusion sensitization weighted distribution of q-vector directions (i.e. the distribution with different number of points more or less uniformly distributed at each diffusion sensitization level) is optimized to provide a more accurate sampling of the angular diffusion variations than an equidistant Cartesian grid. Indeed, the DSI Cartesian q-space sampling roughly has similar number of points at the highest sensitization levels (256 for multishell vs 258 for DSI) providing 0.0487 steradian resolution (vs 0.0491 sr for multishell), but at the lowest sensitizations multi shell sampling with 64 points still has resonably accurate 0.196 sr resolution whereas the DSI sampling falls to 2.09 sr resolution, that is only is able to resolve directions that are fairly close to orthogonal. A simple estimate for mean angular resolution of DSI sampling with 515 grid points distributed inside of the sphere of radius 5 is
| (2) |
whereas for 64, 64, 128, and 256 points multishell aquisition it is
| (3) |
that is more than twice as better.
It is important to point out at this juncture that a key result of our analysis leading to the GO-ESP method (Galinsky & Frank, 2015) is that the generally accepted view that the diffusion PDF is the fundamental quantity in diffusion MRI methods is predicated on the assumption that voxel diffusion profiles are independent. Although there are currently methods that introduce bridging for the local and global scales, i.e. through spatially regularized ODF reconstruction (Goh et al., 2009; Reisert et al., 2011), or by augmenting streamline tractography with some pseudo global looking schemes (Kreher et al., 2008; Fillard et al., 2009; Reisert et al., 2014; Christiaens et al., 2015), the majority of these methods perform diffusion estimation and tractography independently. The fact that voxel diffusion profiles measured in diffusion weighted images of continuous underlying white matter structures are clearly not independent leads to the logically inconsistent procedures whereby local diffusion is estimated based upon this assumption of independence whereas tractography is constructed based upon the implicit assumption of dependence. Our probabilistic approach incorporates additional prior information about nearest neighbor coupling and in this case the result is that the fundamental quantity is not the PDF, but the transition probability for information flow between different voxels. Consequently, methods that hold to the view that the PDF is the fundamental quantity are thus limited, not by the acquisition, but by the problem formulation used in the analysis. Conversely, the GO-ESP method is capable of resolving a huge number of fiber crossings at very small angular difference from multi-shell diffusion acquisitions now easily attainable on state-of-the-art scanners (Galinsky & Frank, 2015).
We would like to emphasize that the use of the term ”fiber” is a primary source of confusion in DTI. Current MRI technology is not able to resolve individual fibers and only sample them statistically. Typical neural fibers can differ in diameter by nearly 100-fold (~ 0.1−10μm), hence one would need between 105 and 109 total fibers to fill the cross-sectional area of a single voxel. Computationally, it is not possible to trace that many fibers. However, GO-ESP fiber tractography allows us to statistically represent the overall fiber distribution using unbiased sampling. To provide this unbiased sampling, GO-ESP generates the starting fiber positions r0 using the equilibrium probability and the starting fiber orientations k0 using the transition probability, and then produces an ensemble of fibers by integrating Eqn 1 with those initial conditions.
For each individual fiber traversing through any given voxel an average fiber direction is estimated. Then the whole ensemble of fibers is used to calculate a total number of fibers and a mean direction of all fibers in every voxel. To construct a pairwise fiber crossing angle distribution in every voxel, we divide the range of all possible angles (from 0° to Θ = 90°) into n bins and count the number of crossings Nθi falling in each bin i. Then we introduce a pairwise fiber crossing angle distribution density by normalizing it as
| (4) |
where Nc is a total number of crossings. This normalization ensures that
| (5) |
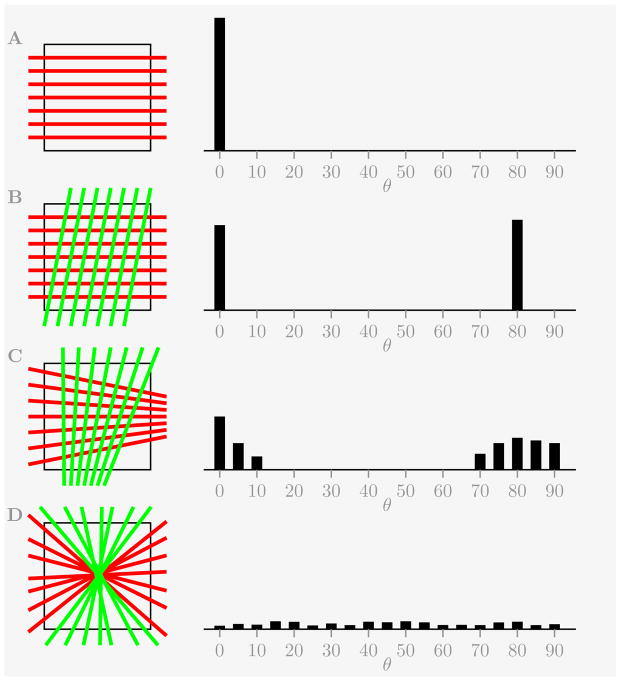
To illustrate the utility of this pairwise angle distribution we provide first several simple examples showing how the density may look for simple geometric systems such as grid-like crossing of avenues and streets of Manhattan, or curved streets of Victorian London.
Assuming that there are a family of Nf parallel fibers going through a single voxel gives us Nc = Nf (Nf − 1)/2 total crossings all located at 0° bin such that f(0) = n/Θ as shown in Fig 1A.
Figure 1.
Several examples of idealized fiber distribution inside a voxel and an expected pairwise crossing fiber distribution density, including a single family of parallel fibers (A), two families of crossing parallel fibers (B), two families of crossing diverging fibers (C), and a random fiber distribution (D).
For two crossing families of parallel fibers (no necessarily orthogonal) with the same number of fibers Nf in each family it will give Nf (Nf − 1) counts at 0° bin and counts at the crossing angle θc bin (that is with f(0) ≈ f(θc) ≈ 0.5n/Θ) as shown in Fig 1B.
If both families of fibers are not strictly parallel but either diverging or converging (or just have some angular spread δθ) then their crossings will not be confined to two bins anymore, but instead will be spread out across the number of bins located in stripes with ~ δθ half width adjacent to 0° and θc bins. The crossing angle distribution density will roughly satisfy
as shown in Fig 1C.
And finally, if there is no directional distinction between families of fibers or if some fiber directions are produced due to noise, then the number of crossings in each bin will follow the binomial distribution
| (6) |
where p = 1/n, giving
| (7) |
for the mean μf and the standard deviation σf of the crossing angle distribution density f(θ).
It is no surprise that the standard deviation σf is decreasing with the increase of number of crossings Nc as , as this is simply the restatement of the fact from elementary statistics that an error decreases as a square root of a number of trials. But this obvious fact allows us to show in the next section that the data with high statistical evidence proves that “the thesis that brain pathways adhere to a simple geometric system best accounts for the available evidence—not like London, but Manhattan” (Wedeen et al., 2012b) is is not supported in any way by the evidence provided by the data.
The main claim made in Wedeen et al. (2012a) is that the white matter has a grid-like organization formed by crossing of quasi orthogonal sheets of fibers. Though the crossing angles are not necessarily 90°, they are nevertheless assumed to show some distinction between directions, that would translate into a pairwise crossing angle distribution containing peaks at both small and large angles. Our results do not find any quantitative statistical evidence that this is the case.
3 Results
3.1 Pairwise crossing fiber angle distributions
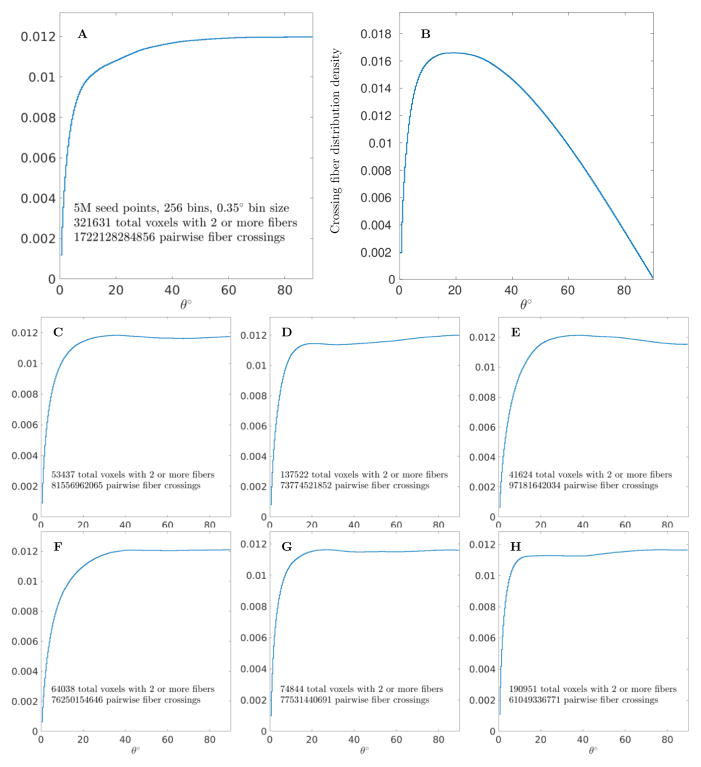
To obtain the statistically relevant results, we generated up to 5 millions seeds sampled from the unbiased equilibrium probability distribution generated by the ESP approach (Frank & Galinsky, 2014; Galinsky & Frank, 2015). Selecting ~ 2.5 million tracts of 60mm length or longer and binning angles of all pairwise crossings of fibers in each voxel in the 0–90° range with 0.35° bin size produced the whole brain distribution shown as a stairstep graph in Fig 2A. The distribution includes more than 320,000 voxels where crossing of at least 2 fibers has been detected, with 1,722,128,284,856 fiber crossings total. It shows relatively flat spread of crossing angles from rather low angles of about 10° to the orthogonal crossing at 90°. The number of crossings in the range from 80° to 90° corresponds to about 12% of all crossings, hence shows the same trend as the significantly more coarse results presented in the comment by Catani et al. (2012). The error bars in the stairstep graph of Fig 2A are not shown as the total number of fiber crossings used for the binning of the whole brain pairwise angle distribution (~ 1.7 trillion) provides an upper estimate for the error in the extremely low range of 10−6.
Figure 2.
Pairwise crossing fiber angle distributions for the whole human brain. (A) Stairstep plot of distribution for 1,722,128,284,856 fiber crossings of MGH 1010 subject from the Human Connectome Project. Plot was obtained by selecting 2,494,224 fibers with 60mm or more total length from the total of 5 million seed points and binning all pairwise angles θ from 321,631 voxels with 2 or more fibers in 256 bins of 0.35° angular size. A fraction of fibers collected in each bin is shown on the ordinate axis. (B) Angle distribution rescaled by cos θ which takes into account the difference in solid angle measures of each bin. Pairwise fiber angle distributions of 6 different subjects (C–H) scanned on different hardware (GE or Siemens) and processed with different parameters (including removing restriction on fiber length, changing the threshold to select different ranges of deep white matter, etc.) all show similar and repeatable whole brain pairwise crossing distributions.
If a random distribution of crossing angles in the azimuthal plane is assumed then the difference in solid angle measure of bin sizes should be taken into account and used to scale the distribution with the cosine of the crossing angle θ. This distribution is shown in Fig 2B and provides the most likely angle for crossing fibers at only around ~ 18°.
Whole brain pairwise crossing fiber distributions for several additional subjects are shown in Fig 2C–H. These distributions were obtained using half a million seed points and varying parameters of GO-ESP tracking but keeping both initial seeding and all the tracking points in the deep white matter and the major tracts. It is believed that the deep white matter tracts is the primary focus of the Wedeen’s paper, and it is at the crossings of the major white matter tracts where the so called “grid” appears predominately. For all six additional subjects in Fig 2C–H no large angle crossing peak was found and all whole brain pairwise crossing distributions show a similar and rather repeatable form.
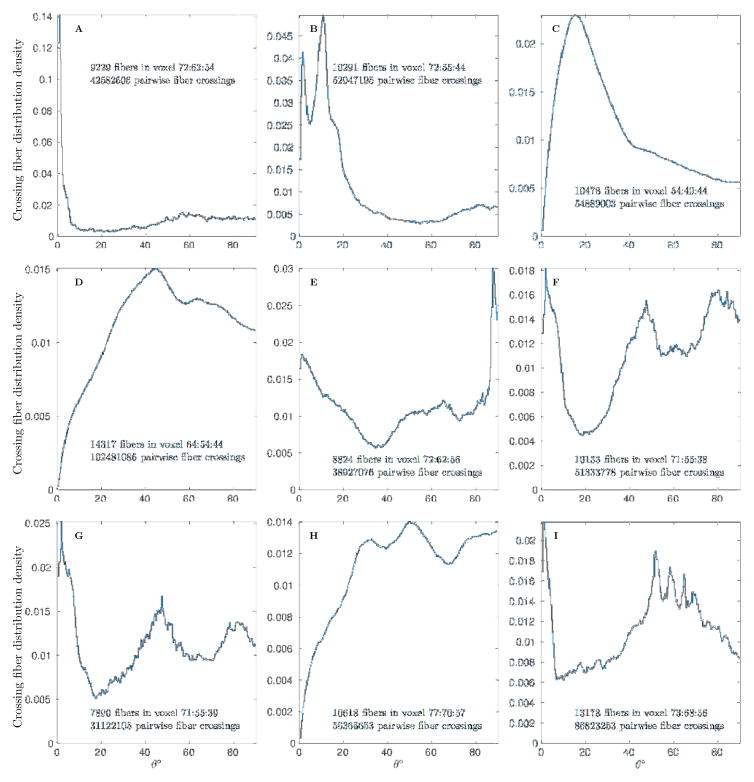
Several individual pairwise crossing angle distributions in selected voxels are shown in Fig 3. These distributions include statistically evident single fiber, two crossing fibers, and multiple crossing fiber cases. All of these distributions use from ~8000 to 15000 fibers to generate crossing angle distribution. The 104 count of voxel fibers is of course nowhere close to ≈ 109 count of physical fibers, but nevertheless is high enough to provide sufficiently accurate and statistically significant results sampled from unbiased distribution with density represented by the equilibrium probability (Frank & Galinsky, 2014; Galinsky & Frank, 2015). These distributions also provide rather detailed information on the accuracy and resolution of our approach. For example, the single fiber distribution (Fig 3A) shows an angular spread of only several degrees in a set of fibers bundled together. The two fibers crossing distribution (Fig 3B) shows that our approach is capable of resolving fibers that cross with only around 8° angle. Overall, the multitude of different crossing angle distributions can be spotted in different locations, examples of different crossings with ~ 20°, 45° and 90° angles are shown in (Fig 3C,D and E). Distributions with crossing of at least three sets of fibers are shown in (Fig 3F and G), with evident peaks at both 45° and 80° angles. Even more complex distributions with multiple fibers are shown in the last two panels of Fig 3, where the last (Fig 3I) again confirms that even for multiple fibers our method is capable of finding fibers crossing with angles as small as only about 8°.
Figure 3.
Pairwise crossing fiber angle distributions in several individual voxels showing examples of single fiber (A), ~ 10°, 20°, 45° and 90° crossing of two fibers (B, C, D and E), and crossing of multiple fibers (F, G, H and I).
3.2 Statistical validation of crossing resolution
We would like to emphasize that our claim of 8° resolution is very sound statistically. For example, with Nf ~ 104 fibers in Fig 3B Nc = Nf (Nf − 1)/2 and about ~ 5 · 107 total fiber crossings were used to generate the histogram. The 0.015 difference between the peak that represents the first family of fibers and the minimum that separates it from the second peak roughly corresponds to 600σ (σ is ~ 2.4 · 10−5 from Eqn 7). Even several peaks in the 50° – 70° range of Fig 3I (with as small as 0.001 height of the smallest peak) correspond to a range from 50σ to 150σ. While a more accurate significance estimate could be easily constructed from P-value bounds based on tail estimates for the binomial distribution itself, the normal approximation based estimates used here are more than sufficient to demonstrate the significance of the results.
The cumulative conditional probability of the hypothesis that the noise is responsible for formation of a peak Nθ1 relatively to a valley Nθ2 can be expressed as (Arratia & Gordon, 1989):
| (8) |
where
| (9) |
| (10) |
For the peaks parameters of both Fig 3B and Fig 3I this expression results in extremely low P-values, as H1−H2 ~ 0.01 and hence exp (−0.01Nc) dominates giving the values that are slightly larger that erfc(600) for B or erfc(50) for I, but nevertheless well below the values considered reasonable by all current standards for successful statistical trials. This is clearly sufficient for validation of ~ 8° as the resolution of our approach.
3.3 Crossing examples with locations and directional maps
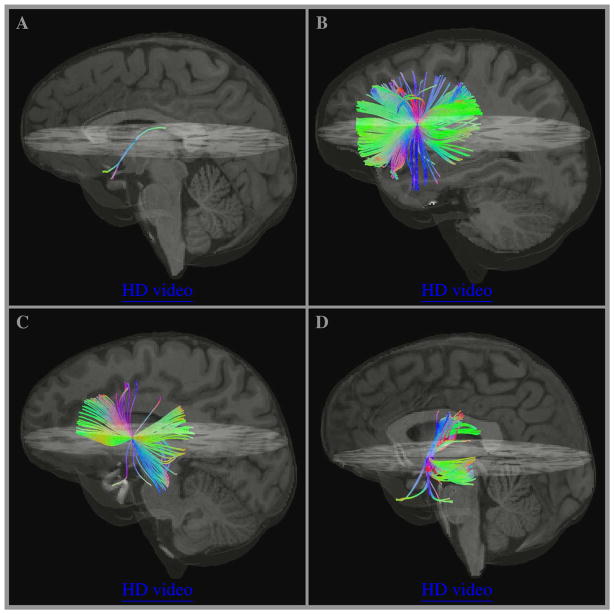
Fig 4 shows 3D views of a subset of randomly selected fibers for voxels from panels B, C, D, and F of Fig 3. Low resolution videos are embedded in the figure and can be activated by clicking anywhere inside the panels (using supported viewers only, i.e. Adobe Acrobat or Reader) and high resolution videos can be accessed through “HD video” links.
Figure 4.
Examples of fiber crossing complexity shown for several individual voxels with pairwise crossing fiber angle distributions in Fig 3. Panels A, B, C, and D correspond to panels B, C, D, and F respectively showing a subset of 201, 268, 487, and 157 randomly selected fibers (out of 10291, 10478, 14317, and 10133 total fibers used in Fig 3). Low resolution videos are embedded and can be activated by clicking anywhere inside the panels (using supported viewers only, i.e. Adobe Acrobat or Reader), high resolution videos can be accessed through “HD video” links.
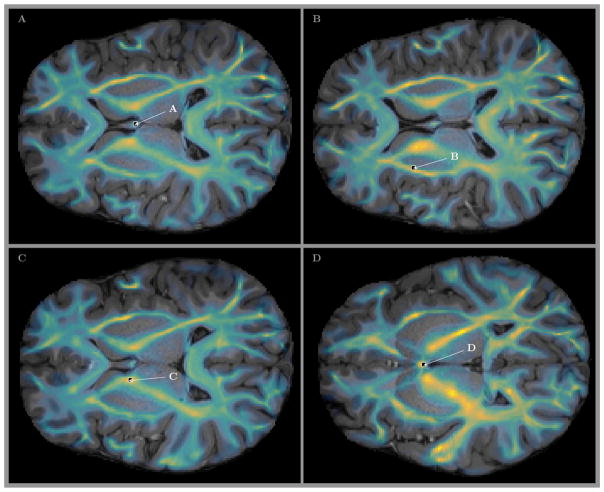
Locations of the voxels on two dimensional slices of the MGH 1010 T1 volume are shown in Fig 5. The parula colored overlay shows the map of fiber counts in every voxel of the slice. It can be clearly seen that the fibers used for our analysis are located in the areas of deep white matter and major tracts, hence directly correspond to the area which is the primary focus of Wedeen et al. (2012a).
Figure 5.
Locations of the voxels shown in A, B, C, and D of Fig 4 (and in B, C, D, and F panels of Fig 3. The parula colored overlay shows the map of fiber counts across the slices. It can be clearly seen that the fibers used for our analysis are located in the areas of deep white matter and major tracts, which is the primary focus of Wedeen et al. (2012a).
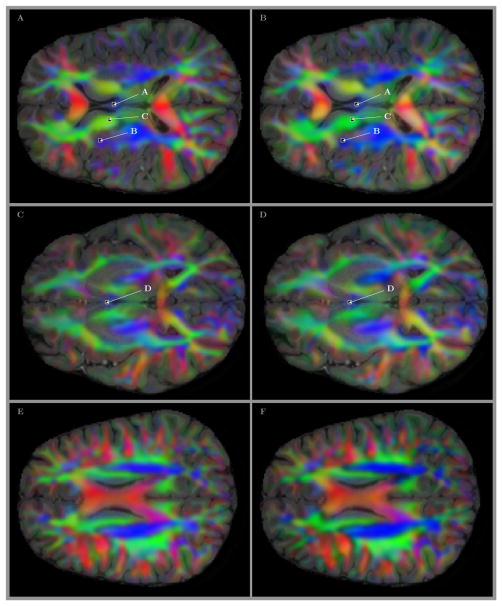
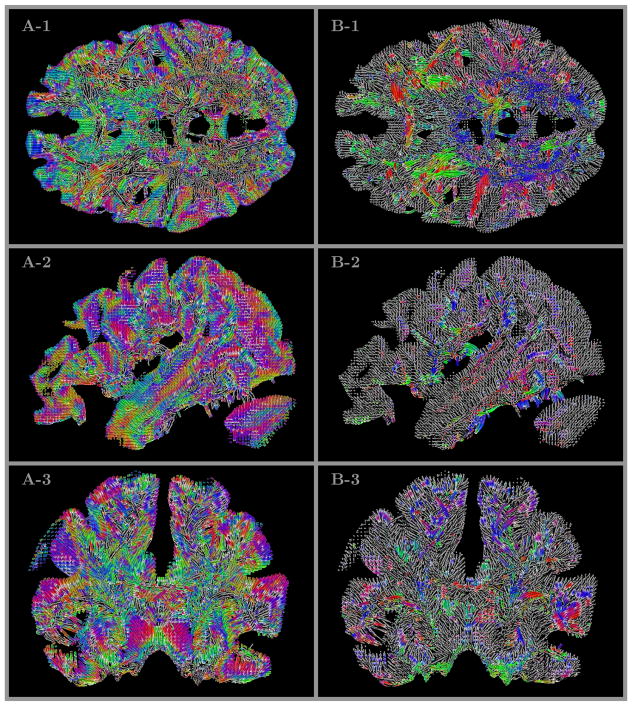
The directional information for several selected slices is shown in Fig 6. The figure includes panels A, C, and E with two dimensional slices of MGH 1010 T1 volume overlayed by an RGB map of the major eigenvector of the transition probabilities (Galinsky & Frank, 2015) calculated from volumetric diffusion data and used as priors in seeding of the tracts. The second set of panels B,D and F look only slightly different visually, but it is based on conceptually different analysis – RGB directional maps are produced from an ensemble of curved line tracts obtained by our GO-ESP approach and postprocessed to generate the mean fiber directions for each voxel using the procedure describe above in section 2.
Figure 6.
Locations of the voxels shown in A, B, C, and D of Figs 4 and 5 (and in B, C, D, and F panels of Fig 3. The RGB colored overlays show the directional information for the transition probabilities (Galinsky & Frank, 2015) used in seeding (panels A, C, and E) and for the mean fiber directions obtained by our analysis as a result of processing an ensemble of tracts in every voxel (panels B, D, and F). All four voxels marked by labels inside the panels show rather complicated crossing structures, even those that located deep in areas of predominantly common colors, i.e. with the same major directions of transitional probabilities or mean fiber directions (i.e. voxels labeled as A and C).
The panels A, B, C, and D of Fig 6 also include the location of the same four voxels marked by labels in Fig 5. It should be noted that even those voxels that seem to be located deep inside the areas of predominantly single color, that is with the same major directions of transitional probabilities or the same averaged direction of all fibers (i.e. voxels labeled as A and C) correspond to rather complicated crossing structures, as it can be seen from 3D views and videos of Fig 4.
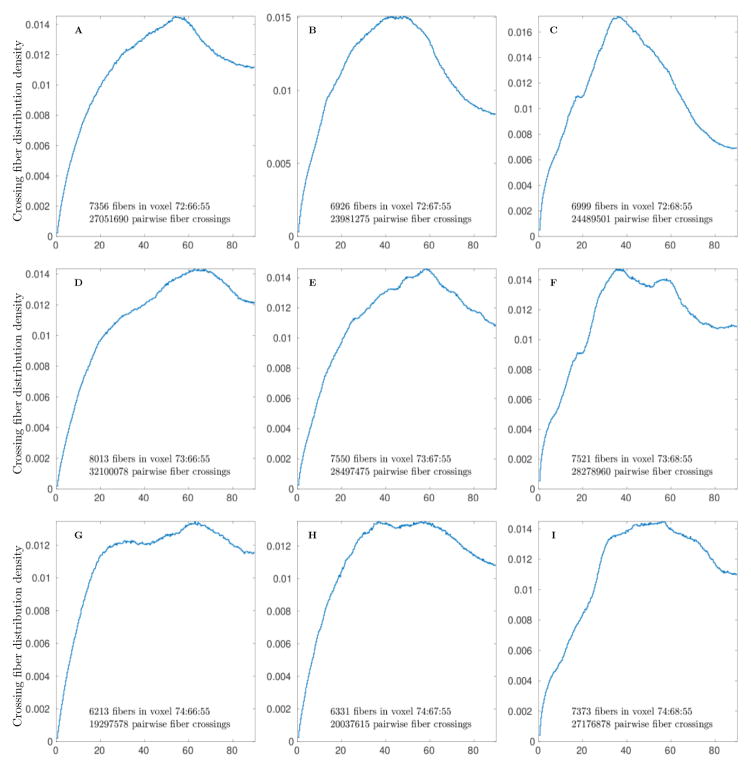
Another set of individual pairwise crossing angle distributions from a contiguous block of 3×3 voxels is shown in Fig 7. The set clearly indicates continuity of the distribution across voxel boundaries with small consistent changes from voxel to voxel. An abundance of various angles of crossing fibers from ≲ 20° to 90° is also evident in each of these adjacent voxels.
Figure 7.
Pairwise crossing fiber angle distributions in a 3×3 block of adjacent voxels showing the continuity of distributions across voxel boundaries. The fraction of fiber crossings in the voxel is shown on the ordinate axis.
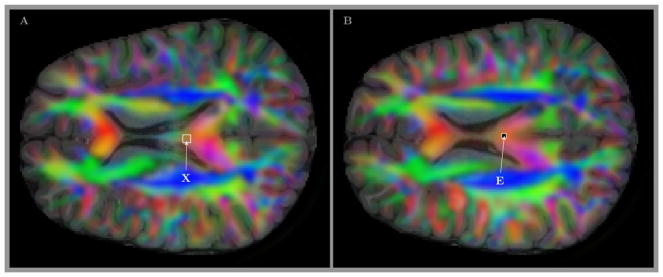
The position of this block of 3×3 voxels is shown in panel A of Fig 8. For comparison panel B shows (by the label E) the location of relatively neighboring voxel where the only histogram has been spotted (Fig 3E) that resembles the crossing sheet structure expected to be common in the deep white matter and major tracts area according to the claims by Wedeen et al. (2012a).
Figure 8.
T1 images with the RGB colored directional information for the mean fiber direction used to show the position of 3×3 block of voxels from Fig 7 (small rectangle X in panel A), and the location of relatively neighboring voxel where the only histogram was identified (Fig 3E) that resembles the crossing sheet structure expected to be common in the deep white matter and major tracts area according to the claims by Wedeen et al. (2012a) (label E in panel B).
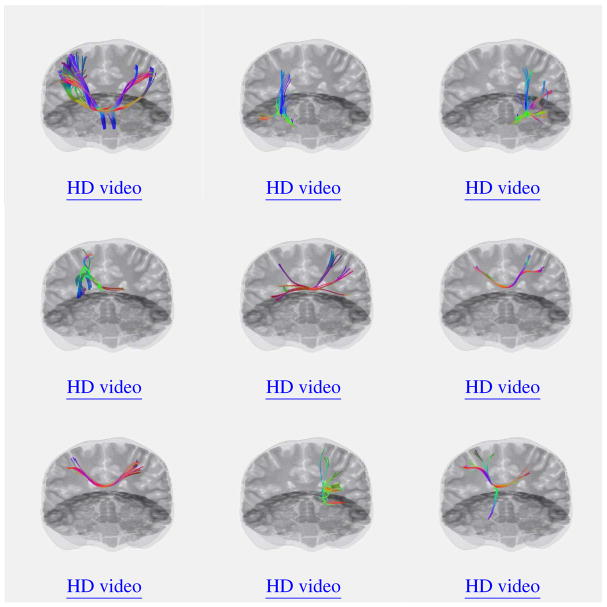
Several more examples of fiber tracts crossing in different areas of different subjects are shown in appendix Fig 11 again with the low resolution videos embedded and links to the high definition videos referenced. The overall fiber tracts structure seems to be more consistent with small angle tree-like branching of tracts rather than with near orthogonal grid-like crossing of fiber sheets. Tree-like branching structures are well known in neuronal growth and their existence has been posited on a range of evolutionary factors (Mitchison, 1991; Laughlin & Sejnowski, 2003; Sugimura et al., 2007; Wen et al., 2009; Jan & Jan, 2010; Gibson & Ma, 2011). Our finding of this structure on the macro (brain) scale, while remarkable, is thus perhaps not surprising in light of this similarity to the microscale (neuronal) geometry as well as the proliferation of such structures in complex biological systems (Ochoa-Espinosa & Affolter, 2012).
3.4 The lamellar structure of fiber pathways
The capabilities of our GO-ESP method for constructing accurate quantitative measures of complex fiber distributions, as demonstrated above, provides a unique opportunity to investigate the possibility of a quantitative measure of the geometrical structure of brain fibers. One such measure became apparent in our recent investigations and is shown in Fig 9, where we have plotted fiber pathways colored by the direction of the local vorticity ω = ∇ × v ≡ rot(v). For the v field we use ψ(r,k) (Eqn 1, see Galinsky & Frank (2015) for details) with k fixed for a given family of fibers at location r. It is well known from vector calculus that the extreme case of a vector field orthogonal to its own vorticity (i.e. when v·∇ × v = 0) is called a lamellar vector field. The opposite extreme case of vorticity parallel to the field, (i.e when v × ∇ × v = 0), is known as helical vector field. Since no experimentally measured fiber vorticity fields would be expected to satisfy either of these cases identically, it nevertheless make sense to consider approximate lamellar and helical conditions. In Fig 9A only those parts of fibers have been colored that satisfy the approximately lamellar condition and the approximately helical condition is used in Fig 9B. The same coloring is used for several cuts through the brain with horizontal, coronal, and sagittal planes in Fig 10. Comparing Fig 9A with Fig 9B (and Fig 10A with Fig 10B) it is strikingly obvious that the brain fiber pathways, although neither strictly lamellar nor strictly helical, show very significant prevalence of lamellarity over helicity. An important mathematical property of lamellar field is the existence of Monge decomposition of vector field v = λ∇μ, such that there exists a set of equipotential surfaces μ = const orthogonal to vector field lines (fiber tracts) everywhere (Lamb, 1932; Serrin, 1959). This propensity for lamellarity in human brain fiber pathways is a very interesting fact that clearly warrants a more in-depth investigation. However, the strong prevalence for global lamellarity in the brain fiber pathways demonstrated in this paper at least suggests a plausible quantitative connection between structure and evolution that is consistent with the ubiquity of lamellar structures in biological systems (Fernández-Morán, 1959; Weiner et al., 2000).
Figure 9.
Lamellar (A) and helical (B) parts of the brain fiber pathways colored with the unit vector of the local vorticity ω/|ω| (C).
Figure 10.
Lamellar (A) and helical (B) parts of the brain fiber pathways colored with the unit vector of the local vorticity ω/|ω| and shown using horizontal (1), coronal (2) and sagittal (3) cuts of the brain.
4 Discussion and Conclusion
The identification of sheet structures in the brain from DTI data requires two quantitative steps. The first is the ability to accurately estimate intravoxel fiber distributions from DTI data. The second is the development of a quantitative characterization of sheet structures. However, the ability to perform the second step is predicated on being able to perform the first. Without an accurate estimation of the intravoxel fiber distribution, any statements about sheet structure - however they are formulated, will be relatively meaningless.
This major limitation of current DTI analysis methods motivated our development of the GO-ESP method used in this paper which has been demonstrated to overcome many of these limitations and provides a robust method for the accurate (to within image resolution) estimation of the local diffusion profile (Galinsky & Frank, 2015). This is the first novel aspect of the current study. In addition, we have developed a robust statistical assessment of the existence of sheet structures based upon intravoxel pairwise fiber crossing distributions. The original conclusions of Wedeen et al. (2012a) were based a non-quantitative visual assessment of intervoxel fiber relationships. In a recent series of abstracts, Tax and colleagues entered this debate by aiming to more quantitatively describe sheet structures from intervoxel structure using well-known differential geometric methods (Tax et al., 2013, 2014, 2015; Tax, Haije, et al., 2016; Tax, Westin, et al., 2016). Unfortunately, their approach is incapacitated by their reliance on standard DTI analysis methods which are incapable of accurately discerning intravoxel distributions, thus requiring, for example, the invocation of artificial methods to account for the missing peaks in their characterization of the local diffusion by an fiber orientation distribution function (fODF) (Tax, Westin, et al., 2016).
On the contrary, our approach is more in the spirit of the fiber angle distributions of Catani et al. (2012), with the significant improvements that we employ a method that can robustly estimate intravoxel fiber orientation probabilities (Galinsky & Frank, 2015), from which we then construct quantitative statistical assessments of the relationship of intravoxel fiber distributions to sheet structures,. These assessments are not based on any assumption of orthogonality (c.f. Fig 1C) but rather on the statistical distributions expected from sheet structures. Within the spatial resolution limits, our assumption of non-curved fibers within a single voxel implicit in our formulation of the intravoxel sheet distributions is sufficiently accurate and there is no need to invoke any differential geometric machinery that might be required for considering intervoxel fiber architectures. In addition, we have demonstrated that there is, in fact, a concise global (i.e., intervoxel) mathematical characterization of the brain fiber architecture as a lamellar vector field.
The general conclusion of our study is that our results provide no quantitative statistical evidence for the model of brain fiber architecture as crossing sheets of fibers postulated by Wedeen et al. (2012a) both locally, in many of the individual voxels, and globally, statistically averaging all crossings of fibers in the whole brain. Nevertheless, the question of whether there is a quantitative measure of the geometrical structure of brain fibers is very important for the understanding of the development and function of the human brain. Our findings provide an interesting insight into a possible approach to the development of such a quantitative measure by showing very significant prevalence of lamellarity over helicity across the whole ensemble of brain fibers.
It is useful here to summarize our approach and the major results of this study. We analyzed whole brain tractography results for several subjects and introduced a pairwise fiber crossing angle distribution with small angular bin (as small as only 0.35°). Using a large number of tracks allowed us to draw statistically significant conclusions from those distributions even on the scale of a single voxel. We showed that our method is capable of capturing with high statistical certainty crossing of bundles or sheets or planes at angles below 10°. We showed that crossing of two bundles or sheets of divergent fibers would be expected to produce two peaks in the distribution. Similarly, for fibers confined to three crossing planes in 3D volume the expectation would be to find either three or two clearly defined peaks. However, our results demonstrate a much wider range of possible crossing configurations, from just a single divergent bundle of fibers to crossing of fibers coming from more than three clearly defined directions (i.e. crossing of more than three planes in a single voxel) and thus suggest a much more complex overall picture of the brain fiber architecture. A significant finding of our study is that there does, indeed, appear to be evidence for an underlying structure of the brain fibers – that they form a lamellar vector field. This property is much more complex than the simple crossing of three curved coordinate planes (either orthogonal or not) as was claimed by Wedeen et al. (2012a,b). And yet it is expressible in a concise and unambiguous mathematical form and is numerically demonstrable on real data, as we have done by showing the significant prevalence of lamellarity over helicity.
Supplementary Material
Acknowledgments
LRF and VLG were supported by NSF grants DBI-1143389, DBI-1147260, EF-0850369, PHY-1201238 and NIH grant R01 MH096100. The authors thank Dr AlecWong and Dr Tom Liu at the UCSD CFMRI and Dr Scott Sorg at the VA San Diego Health Care System for providing the diffusion weighted imaging data. Data were provided [in part] by the Human Connectome Project, WU-Minn Consortium (Principal Investigators: David Van Essen and Kamil Ugurbil; 1U54MH091657) funded by the 16 NIH Institutes and Centers that support the NIH Blueprint for Neuroscience Research; and by the McDonnell Center for Systems Neuroscience at Washington University. Data collection and sharing for this project was provided by the Human Connectome Project (HCP; Principal Investigators: Bruce Rosen, M.D., Ph.D., Arthur W. Toga, Ph.D., Van J. Weeden, MD). HCP funding was provided by the National Institute of Dental and Craniofacial Research (NIDCR), the National Institute of Mental Health (NIMH), and the National Institute of Neurological Disorders and Stroke (NINDS). HCP data are disseminated by the Laboratory of Neuro Imaging at the University of Southern California.
A Fiber crossing examples
Figure 11.
Examples of crossing fibers. Click on each figure to activate embedded video or use link under the figure for high definition (HD).
More examples of fiber crossings from different subjects are provided in Fig 11. Low resolution videos are embedded and can be activated by clicking anywhere inside the panels (using supported viewers only), high resolution videos can be accessed through “HD video” links.
References
- Arratia R, Gordon L. Tutorial on large deviations for the binomial distribution. Bull Math Biol. 1989;51(1):125–131. doi: 10.1007/BF02458840. [DOI] [PubMed] [Google Scholar]
- Basser PJ, Pajevic S, Pierpaoli C, Duda J, Aldroubi A. In vivo fiber tractography using DT-MRI data. Magn Reson Med. 2000 Oct;44(4):625–632. doi: 10.1002/1522-2594(200010)44:4<625::aid-mrm17>3.0.co;2-o. [DOI] [PubMed] [Google Scholar]
- Catani M, Bodi I, Dell’Acqua F. Comment on “The Geometric Structure of the Brain Fiber Pathways”. Science. 2012 Sep;337:1605. doi: 10.1126/science.1223425. [DOI] [PubMed] [Google Scholar]
- Christiaens D, Reisert M, Dhollander T, Sunaert S, Suetens P, Maes F. Global tractography of multi-shell diffusion-weighted imaging data using a multi-tissue model. Neuroimage. 2015 Dec;123:89–101. doi: 10.1016/j.neuroimage.2015.08.008. [DOI] [PubMed] [Google Scholar]
- Conturo TE, Lori NF, Cull TS, Akbudak E, Snyder AZ, Shimony JS, … Raichle ME. Tracking neuronal fiber pathways in the living human brain. Proc Natl Acad Sci USA. 1999 Aug;96(18):10422–10427. doi: 10.1073/pnas.96.18.10422. [DOI] [PMC free article] [PubMed] [Google Scholar]
- Fernández-Morán H. Fine Structure of Biological Lamellar Systems. Reviews of Modern Physics. 1959 Apr;31(2):319–330. [Google Scholar]
- Fillard P, Poupon C, Mangin JF. A novel global tractography algorithm based on an adaptive spin glass model. Med Image Comput Comput Assist Interv. 2009;12(Pt 1):927–934. doi: 10.1007/978-3-642-04268-3_114. [DOI] [PubMed] [Google Scholar]
- Frank LR, Galinsky VL. Information pathways in a disordered lattice. Phys Rev E. 2014 Mar;89:032142. doi: 10.1103/PhysRevE.89.032142. [DOI] [PMC free article] [PubMed] [Google Scholar]
- Galinsky VL, Frank LR. Simultaneous multi-scale diffusion estimation and tractography guided by entropy spectrum pathways. IEEE Trans Med Imaging. 2015 May;34(5):1177–1193. doi: 10.1109/TMI.2014.2380812. [DOI] [PMC free article] [PubMed] [Google Scholar]
- Gibson DA, Ma L. Developmental regulation of axon branching in the vertebrate nervous system. Development. 2011 Jan;138(2):183–195. doi: 10.1242/dev.046441. [DOI] [PMC free article] [PubMed] [Google Scholar]
- Goh A, Lenglet C, Thompson PM, Vidal R. Estimating orientation distribution functions with probability density constraints and spatial regularity. Med Image Comput Comput Assist Interv. 2009;12(Pt 1):877–885. doi: 10.1007/978-3-642-04268-3_108. [DOI] [PubMed] [Google Scholar]
- Jan YN, Jan LY. Branching out: mechanisms of dendritic arborization. Nature Reviews Neuroscience. 2010 May;11(5):316–328. doi: 10.1038/nrn2836. [DOI] [PMC free article] [PubMed] [Google Scholar]
- Jbabdi S, Johansen-Berg H. Tractography: where do we go from here? Brain Connect. 2011;1(3):169–183. doi: 10.1089/brain.2011.0033. [DOI] [PMC free article] [PubMed] [Google Scholar]
- Keil B, Blau JN, Biber S, Hoecht P, Tountcheva V, Setsompop K, … Wald LL. A 64-channel 3t array coil for accelerated brain mri. Magnetic Resonance in Medicine. 2013;70(1):248–258. doi: 10.1002/mrm.24427. doi: 10.1002/mrm.24427. Retrieved from . [DOI] [PMC free article] [PubMed] [Google Scholar]
- Kreher BW, Schnell S, Mader I, Il’yasov KA, Hennig J, Kiselev VG, Saur D. Connecting and merging fibres: pathway extraction by combining probability maps. Neuroimage. 2008 Oct;43(1):81–89. doi: 10.1016/j.neuroimage.2008.06.023. [DOI] [PubMed] [Google Scholar]
- Lamb H. Hydrodynamics 1932 [Google Scholar]
- Laughlin SB, Sejnowski TJ. Communication in Neuronal Networks. Science. 2003 Sep;301(5641):1870–1874. doi: 10.1126/science.1089662. [DOI] [PMC free article] [PubMed] [Google Scholar]
- Mitchison G. Neuronal Branching Patterns and the Economy of Cortical Wiring. Proceedings of the Royal Society of London B: Biological Sciences. 1991 Aug;245(1313):151–158. doi: 10.1098/rspb.1991.0102. [DOI] [PubMed] [Google Scholar]
- Mori S, van Zijl PC. Fiber tracking: principles and strategies - a technical review. NMR Biomed. 2002;15(7–8):468–480. doi: 10.1002/nbm.781. [DOI] [PubMed] [Google Scholar]
- Ochoa-Espinosa A, Affolter M. Branching Morphogenesis: From Cells to Organs and Back. Cold Spring Harbor Perspectives in Biology. 2012 Oct;4(10) doi: 10.1101/cshperspect.a008243. [DOI] [PMC free article] [PubMed] [Google Scholar]
- Reisert M, Kiselev VG, Dihtal B, Kellner E, Novikov DS. MesoFT: unifying diffusion modelling and fiber tracking. Med Image Comput Comput Assist Interv. 2014;17(Pt 3):201–208. doi: 10.1007/978-3-319-10443-0_26. [DOI] [PMC free article] [PubMed] [Google Scholar]
- Reisert M, Mader I, Anastasopoulos C, Weigel M, Schnell S, Kiselev V. Global fiber reconstruction becomes practical. Neuroimage. 2011 Jan;54(2):955–962. doi: 10.1016/j.neuroimage.2010.09.016. [DOI] [PubMed] [Google Scholar]
- Serrin J. Mathematical Principles of Classical Fluid Mechanics. Handbuch der Physik. 1959;8:125–263. doi: 10.1007/978-3-642-45914-6_2. [DOI] [Google Scholar]
- Setsompop K, Gagoski BA, Polimeni JR, Witzel T, Wedeen VJ, Wald LL. Blipped-controlled aliasing in parallel imaging for simultaneous multislice echo planar imaging with reduced g-factor penalty. Magn Res Med. 2011 Aug;67(5):1210–1224. doi: 10.1002/mrm.23097. [DOI] [PMC free article] [PubMed] [Google Scholar]
- Setsompop K, Kimmlingen R, Eberlein E, Witzel T, Cohen-Adad J, Mc-Nab J, … Wald L. Pushing the limits of in vivo diffusion {MRI} for the human connectome project. NeuroImage. 2013;80(0):220– 233. doi: 10.1016/j.neuroimage.2013.05.078. [DOI] [PMC free article] [PubMed] [Google Scholar]
- Sotiropoulos SN, Moeller S, Jbabdi S, Xu J, Andersson JL, Auerbach EJ, … Lenglet C. Effects of image reconstruction on fiber orientation mapping from multichannel diffusion mri: Reducing the noise floor using sense. Magnetic Resonance in Medicine. 2013;70(6):1682–1689. doi: 10.1002/mrm.24623. doi: 10.1002/mrm.24623. Retrieved from . [DOI] [PMC free article] [PubMed] [Google Scholar]
- Sugimura K, Shimono K, Uemura T, Mochizuki A. Self-organizing Mechanism for Development of Space-filling Neuronal Dendrites. PLoS Comput Biol. 2007 Nov;3(11):e212. doi: 10.1371/journal.pcbi.0030212. [DOI] [PMC free article] [PubMed] [Google Scholar]
- Tax C, Haije TD, Fuster A, Duits R, Viergever M, Calabrese E, … Leemans A. Towards quantification of the brain’s sheet structure in diffusion mri data. International basp frontiers workshop. 2015:74. [Google Scholar]
- Tax C, Haije TD, Fuster A, Duits R, Viergever M, Florack L, Leemans A. Towards quantification of the brain’s sheet structure: Evaluation of the discrete Lie bracket. International Society Magnetic Resonance in Medicine. 2014 May;:0975. [Google Scholar]
- Tax C, Haije TD, Fuster A, Viergever M, Florack L, Leemans A. Considerations on the theory of sheet structure of cerebral pathways. ISMRM Workshop on Diffusion as a Probe of Neural Tissue Microstructure; Podstrana, Croatia. 2013. [Google Scholar]
- Tax C, Haije TD, Fuster A, Westin C-F, Viergever M, Florac L, Leemans A. International Society Magnetic Resonance in Medicine. Singapore: 2016. Mapping the Brain’s Sheet Probability Index (SPI) with Diffusion MRI: Sheet Happens?! p. 791. [Google Scholar]
- Tax C, Westin C-F, Haije TD, Fuster A, Viergever M, Florac L, Leemans A. International Society Magnetic Resonance in Medicine. Singapore: 2016. Robust Assessment of the Brain’s Sheet Structure Using Normalized Convolution; p. 2073. [Google Scholar]
- Tournier JD, Calamante F, Connelly A. Robust determination of the fibre orientation distribution in diffusion MRI: non-negativity constrained super-resolved spherical deconvolution. Neuroimage. 2007 May;35(4):1459–1472. doi: 10.1016/j.neuroimage.2007.02.016. [DOI] [PubMed] [Google Scholar]
- Tuch D, Reese T, Wiegell M, Makris N, Belliveau J, Wedeen V. High angular resolution diffusion imaging reveals intravoxel white matter fiber heterogeneity. Magn Reson Med. 2002;48:577–582. doi: 10.1002/mrm.10268. [DOI] [PubMed] [Google Scholar]
- Van Essen DC, Ugurbil K, Auerbach E, Barch D, Behrens TE, Bucholz R, … Yacoub E. The Human Connectome Project: a data acquisition perspective. Neuroimage. 2012 Oct;62(4):2222–2231. doi: 10.1016/j.neuroimage.2012.02.018. [DOI] [PMC free article] [PubMed] [Google Scholar]
- Wedeen VJ, Rosene DL, Wang R, Dai G, Mortazavi F, Hagmann P, … Tseng WYI. The Geometric Structure of the Brain Fiber Pathways. Science. 2012a Mar;335:1628. doi: 10.1126/science.1215280. [DOI] [PMC free article] [PubMed] [Google Scholar]
- Wedeen VJ, Rosene DL, Wang R, Dai G, Mortazavi F, Hagmann P, … Tseng WYI. Response to Comment on “The Geometric Structure of the Brain Fiber Pathways”. Science. 2012b Sep;337:1605. doi: 10.1126/science.1223493. [DOI] [PMC free article] [PubMed] [Google Scholar]
- Wedeen VJ, Wang RP, Schmahmann JD, Benner T, Tseng WY, Dai G, … de Crespigny AJ. Diffusion spectrum magnetic resonance imaging (DSI) tractography of crossing fibers. Neuroimage. 2008 Jul;41(4):1267–1277. doi: 10.1016/j.neuroimage.2008.03.036. [DOI] [PubMed] [Google Scholar]
- Weiner S, Addadi L, Wagner HD. Materials design in biology. Materials Science and Engineering: C. 2000 Jun;11(1):1–8. [Google Scholar]
- Wen Q, Stepanyants A, Elston GN, Grosberg AY, Chklovskii DB. Maximization of the connectivity repertoire as a statistical principle governing the shapes of dendritic arbors. Proceedings of the National Academy of Sciences of the United States of America. 2009 Jul;106(30):12536–12541. doi: 10.1073/pnas.0901530106. [DOI] [PMC free article] [PubMed] [Google Scholar]
Associated Data
This section collects any data citations, data availability statements, or supplementary materials included in this article.


