Abstract
Effective and fast methods are important for distinguishing cocoa varieties in the field and in the processing industry. This work proposes the application of NIR spectroscopy as a potential analytical method to classify different varieties and predict the chemical composition of cocoa. Chemical composition and colour features were determined by traditional methods and then related with the spectral information by partial least-squares regression. Several mathematical pre-processing methods including first and second derivatives, standard normal variate and multiplicative scatter correction were applied to study the influence of spectral variations. The results of chemical composition analysis and colourimetric measurements show significant differences between varieties. NIR spectra of samples exhibited characteristic profiles for each variety and principal component analysis showed different varieties in according to spectral features.
Keywords: Chemical composition, Chocolate, Principal component analysis, Cocoa beans, NIR spectroscopy, PLS regression
Introduction
Cocoa farming has faced several challenges, including plant diseases that have harmed fruit production and quality control of cocoa beans. One of the most destructive diseases in cocoa is caused by the fungus Monilliophthora perniciosa, which induces the ‘witch broom disease’, causing ultimate plant damage. As an alternative to prevent this fungus occurrence, the use of resistant varieties of high productivity has been developed by genetic breeding programs. However, these different varieties present a wide range of diverse chemical composition, making it difficult for the processing industry to standardize parameters during processing (Leite et al. 2013). A quick and comparatively accurate method is required to assess compositional information and differentiate cocoa beans from different varieties for quality control and monitoring of post-harvest and processing activities.
Near infrared (NIR) spectroscopy has been reported as a fast and non-destructive method for determination of major chemical compounds of food (Li et al. 2015; Liu et al. 2015; Madalozzo et al. 2015; Jakubikova et al. 2016; Bazoni et al. 2017), including cocoa characterization. It has been used to determine fat, nitrogen and moisture content of cocoa powder (Kaffka et al. 1982; Veselá et al. 2007), protein, fat, starch, and proanthocyanidins in cocoa (Whitacre et al. 2003), caffeine, theobromine, and epicatechin in cocoa (Alvarez et al. 2012), biochemical quality parameters in cocoa (Krahmer et al. 2015) and sucrose in chocolate (Copikova et al. 2003), and to discriminate between fermented and unfermented cocoa beans (Teye et al. 2014).
The current work proposes the application of NIR spectroscopy as an analytical method to classify different varieties of cocoa beans and predict chemical and physical attributes of cocoa for both intact and ground samples. In addition, it was investigated the influence of spectral pre-processing methods to improve robustness of prediction models.
Materials and methods
Cocoa samples
Five different varieties of cocoa (PH16—14 fruits; BN-34—16 fruits; SR162—16 fruits; CEPC-2002—16 fruits; Pará-Parazinho (PP)—18 fruits) were used in the current study. All cocoa fruit samples were broken and beans were removed and kept for tray fermentation for 5 days. After this period cocoa beans were sun-dried for 7 days, until moisture content of approximately 6–10%. This procedure is the standard processing method for cocoa beans. Samples were packed and taken to laboratory, stored at − 18 °C and protected from light until the time of analysis. Before analysis, samples were ground in a grain grinder avoiding increase of temperature, and sieved using Tyler equivalent 20 mesh (850 μm) (ISO 2016) for standardization of particle size for further analysis.
Spectral acquisition
Spectral analyzes were performed with whole (intact with husk) and ground samples in order to establish the most adequate procedure for sample preparation. Spectral data were collected in reflectance mode and recorded as absorbance (log 1/R) using a XDS Near-Infrared model XM 1100 series—Rapid Content Analyser (Foss NIRSystems, Denmark) over the wavelength range from 400 to 2498 nm at 2 nm intervals. The interval includes visible and near infrared (vis/NIR) range, since some information in the visible range could provide enhanced prediction models.
Chemical analysis
The chemical parameters analysed were protein, fat, moisture, ash, and carbohydrates content. Protein was quantified based on total organic nitrogen of cocoa beans, determined by Kjeldahl procedure. Fat content was determined in a Soxhlet apparatus. Moisture contents of the samples were determined by the gravimetric method after drying 2 g of sample at 105 °C to constant weight. Ash contents were determined by using a muffle furnace at 550 °C for 12 h (AOAC 1995). Total carbohydrates content was obtained by difference of components, as presented in Eq. (1):
| 1 |
Final results were represented by the average of three replicates of each chemical constituent.
Colour measurement
The average of four consecutive measurements at random locations of ground samples using a Minolta colourimeter (CM-2600d, D65 illuminant and 10° observer, Konica-Minolta Sensing Inc., Osaka, Japan), calibrated using a white ceramic standard tile, were expressed in terms of values for the parameters lightness (L*), redness (a*), and yellowness (b*). Colour measurement was performed on ground samples due to its homogeneity, as intact cocoa beans were noticeably heterogeneous in colour in the external appearance.
Statistical data analysis
Differences in chemical composition in cocoa varieties were compared using analysis of variance (ANOVA), followed by the Tukey multiple-comparison test (p < 0.05). Statistical analysis was performed using Statistica software, Version 7.0 (Stat Soft, Inc., Tulsa).
As the current investigation reports on a novel application for NIR spectroscopy, there is no standard procedure to decide on which spectral pre-processing method best suits the given samples, and the only approach is trial and error. Hence, multiplicative scatter correction (MSC), standard normal variate (SNV), 1st derivative, 2nd derivative, MSC combined with 1st derivative, MSC combined with 2nd derivative, were investigated for correction of light scattering and other undesired effects in the spectral data (Pizarro et al. 2004; Windig et al. 2008; Fearn et al. 2009; Osborne et al. 1993; Nicolai et al. 2007; Barnes et al. 1989; Dhanoa et al. 1994; Martens and Naes 1989). Before applying 1st and 2nd derivatives, each spectrum was smoothed by a 9 point Savitzky–Golay smoothing operation, performing a local polynomial regression. All pre-processing methods were performed using multivariate analysis software (Unscrambler version 9.7, CAMO, Trondheim, Norway).
For spectral data, principal component analysis (PCA) was carried out with the purpose to scrutinize the major influence of the different factors of cocoa varieties in the spectral information. Partial least squares (PLS) regression was applied to the centered spectral data sets (1050 bands) to calculate independent prediction models for each compositional feature analysed. Prediction results using raw spectra were compared with those resulting from the spectral data set after treatment with different pre-processing methods (MSC, SNV, 1st and 2nd derivatives, MSC combined with 1st derivative and MSC combined with 2nd derivative).
Samples were split in two groups of forty samples each, one group for building calibration models, and another group for prediction of the compositional attributes. The optimal number of latent variables (LV) for prediction model was determined at the lowest value of predicted residual error sum of squares (PRESS) (Barbin et al. 2012, 2013). Full cross-validation (leave-one out) was used for validation of the calibration models, and the final model was used to predict the attributes in an independent set of samples. Performance of the regression models was evaluated using the coefficient of determination in calibration and prediction (R2C and R2P), root mean square error (RMSE), the root mean square error of prediction (RMSEP), and number of LV (Skibsted et al. 2004). Additionally, other parameters evaluated were the ratio of performance deviation (RPD); and the ratio of error range (RER) (Dagnew et al. 2004; Barbin et al. 2015). PLS regression was performed using multivariate analysis software (Unscrambler version 9.7, CAMO, Trondheim, Norway).
Results and discussion
Cocoa chemical composition
Chemical composition and colour attributes varies according to cocoa varieties as demonstrated in Table 1. For all cocoa varieties fat was the major component (over 40 g per 100 g of samples for all varieties), followed by carbohydrates and proteins. Moisture, protein, and fat contents showed statistical differences for all varieties. Cocoa variety SR 162 presented higher ash and moisture content in comparison to the other varieties. It was not observed any significant difference (p < 0.05) between varieties PP and PH 16, as well as BN 34 and CEPC 2002 varieties. Regarding total carbohydrates, PP and PH16 varieties showed no statistical differences among them, while CEPC 2002, SR 162 and BN 34 varieties were statistically different (p < 0.05).
Table 1.
Chemical composition (g/100 g) and colour parameters for different varieties of cocoa samples
| Cocoa variety | Moisture | Ash | Protein | Fat | Carbohydrates | L* | a* | b* |
|---|---|---|---|---|---|---|---|---|
| PH 16 | 6.56 ± 0.04e | 3.41 ± 0.03b | 15.52 ± 0.06a | 47.86 ± 0.04b | 26.65 ± 0.06d | 44.00 ± 1.21c | 14.49 ± 0.68c | 8.49 ± 0.93c |
| BN 34 | 7.74 ± 0.04d | 3.25 ± 0.02c | 14.11 ± 0.03c | 43.45 ± 0.08d | 31.45 ± 0.10a | 41.63 ± 0.99d | 14.89 ± 0.38c | 7.81 ± 0.76d |
| SR 162 | 10.28 ± 0.04a | 4.13 ± 0.03a | 14.29 ± 0.06b | 41.38 ± 0.09e | 29.92 ± 0.13b | 47.68 ± 1.22a | 16.91 ± 0.41a | 15.35 ± 1.02a |
| CEPC 2002 | 8.88 ± 0.06b | 3.25 ± 0.02c | 13.38 ± 0.04d | 46.42 ± 0.05c | 28.07 ± 0.11c | 45.19 ± 0.66b | 15.79 ± 0.35b | 11.90 ± 0.54b |
| PP | 8.40 ± 0.05c | 3.41 ± 0.07b | 12.43 ± 0.05e | 48.85 ± 0.05a | 26.91 ± 0.09d | 44.53 ± 0.93c | 14.09 ± 0.44c | 8.78 ± 0.47c |
*Same letters indicate that there is no significant difference (p > 0.05) among cocoa varieties
Variety SR 162 showed the highest values for parameters L*, a* and b*, which was characterized as a lighter sample due to the highest value for colour reflectance (L*). BN 34 sample showed the lowest values for L* and b*, which can characterize their cocoa beans as darker. Samples PP and PH 16 showed no significant differences for L*, a*, and b* parameters among them.
Spectral information of cocoa samples and principal component analysis
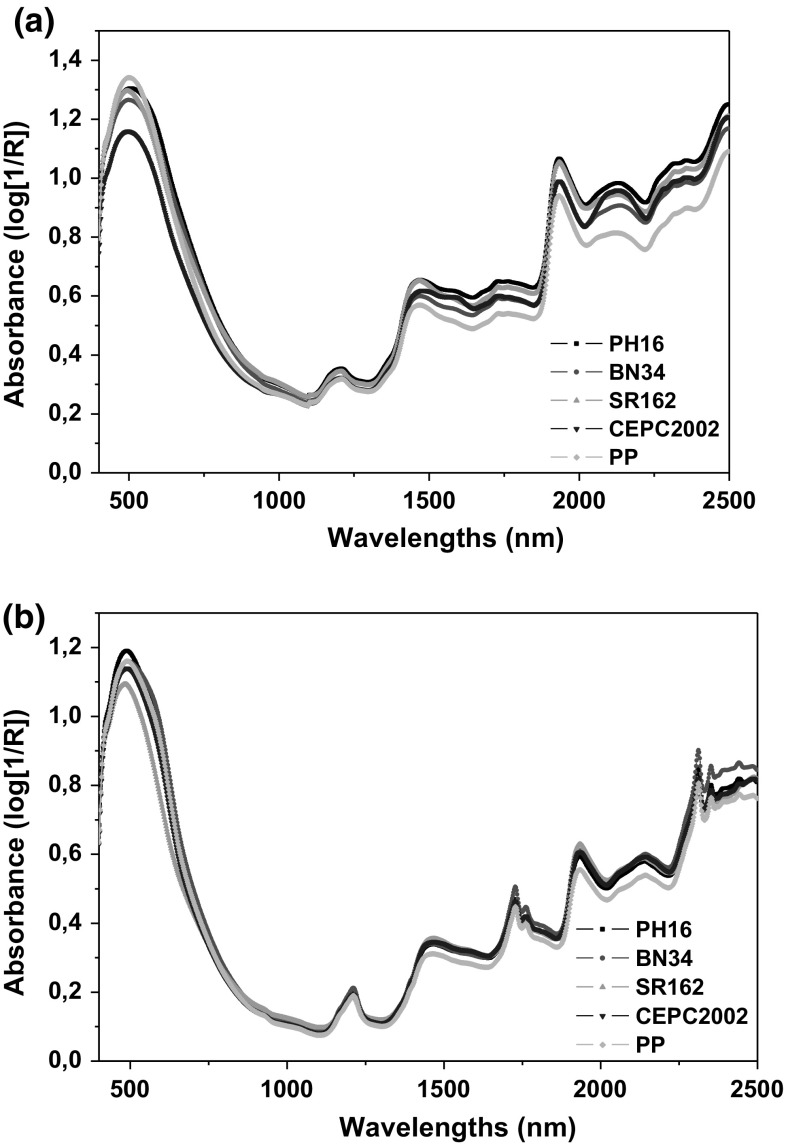
The average absorbance spectra obtained for whole and ground cocoa samples are presented in Fig. 1a, b, respectively. Each spectrum represents the average for each cocoa variety. Spectral information from different samples showed similar patterns, but differed on the absorbance absolute values mainly in the range from 500 to 700 nm and from 1500 to 2500 nm. This implies that each cocoa variety have particular features that can be detected by spectral information. A few broad local absorption maxima are noticeable around 1190, 1460 and 1950 nm; absorption at these wavelengths correspond to O–H, C–H, N–H stretch first and second overtones and combination bands that could be attributed to water absorption and protein changes (Osborne and Fearn 1986).
Fig. 1.
a Average spectra of each cocoa variety (whole beans). b Average spectra of each cocoa variety (ground beans)
It could be observed lower absorbance values for PP samples in the region between 1600 and 2500 nm. This variety was the one with the highest fat content. According to Veselá et al. (2007), the most important bands related with fat content variation are located at 1744, 2322, 2334, and 2360 nm. Moreover, PH 16 variety showed highest absorption and PP variety showed lower absorption in the range between 2000 and 2100 nm, and both varieties presented highest and lowest protein contents, respectively. According to Veselá et al. (2007), the wavelength related to protein in cocoa powder is 2078 nm.
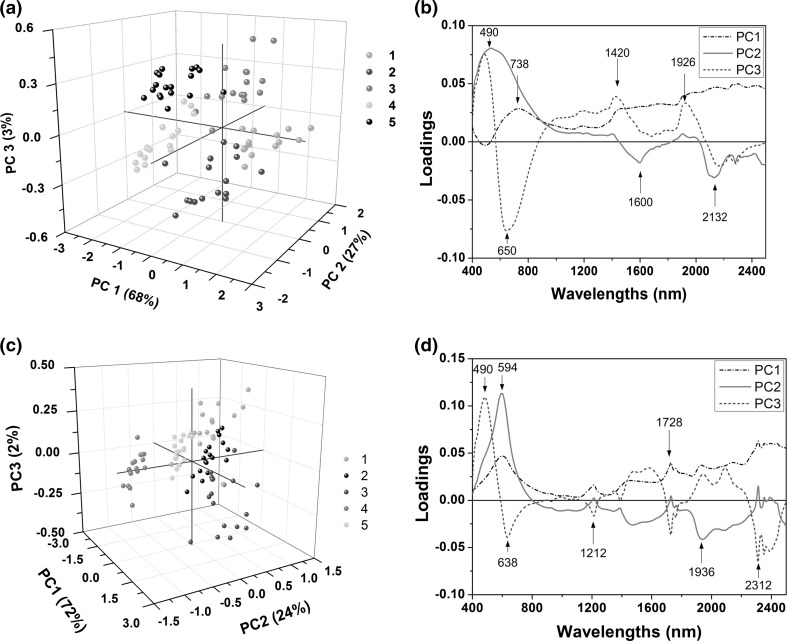
Results for PCA presented in Fig. 2a–d showed that in general there was satisfactory discrimination between the five varieties of cocoa, indicating that the data should provide enough information to develop classification models for cocoa varieties (Reis et al. 2013).
Fig. 2.
a Score plots for the first three principal components (PC) (whole samples); b loadings for the principal component analysis (PCA) carried out for the whole cocoa samples. 1. PH16, 2. BN34, 3. SR162, 4. CEPC2002, 5. PP. c score plots for the first three principal components (ground samples); d loadings for the PCA carried out for the ground cocoa samples. 1. PH16, 2. BN34, 3. SR162, 4. CEPC2002, 5. PP
For whole cocoa beans, the first three principal components were responsible for 68, 27, and 3%, of the total variance among the whole cocoa samples. The scatter plot of the first three principal components presented in Fig. 2a indicated that different classes of samples are subtly separated with five distinct groups, or clusters. Some absorption maxima were observed in the loadings (Fig. 2b) region of 490 and 650 nm, associated to blue and red colours, respectively. Peaks in the NIR range were observed at 1420 nm, associated to the O–H first overtone, C–H stretching and deformation and N–H first overtone; 1600 nm, corresponding to O–H first overtone; 1926 nm (1920–1940, influenced by C=O second overtone, O–H stretching and deformation associated to water) and 2132 nm (NH stretching and C=O stretching of amino acids) (Osborne and Fearn 1986).
Regarding ground samples, the first three principal components were responsible for 72, 24 and 2%, respectively; of the total spectral variance among the ground cocoa samples (Fig. 2c, d). In Fig. 2d it could be seen a high intensity peak of absorption in the visible range of 490 nm. In addition, bands around 1212, 1728, and 2312 nm (C–H stretching 2nd overtone, 1st overtone stretching, and deformation associated to CH2) were observed, while the wavelength region of 1936 nm is associated to O–H stretching and deformation of water (Osborn and Fearn 1986).
PLS regression models for predicting chemical composition and colour features
The large number of pre-processing trials enabled to explore the performance of the PLS regression model for the given quality attributes. PLS regression models obtained for ground samples (Table 2) presented generally similar coefficients of determination (R2) compared to the models for whole intact samples (Table 3), with reasonable accuracy.
Table 2.
Comparison of prediction ability for spectral pre-processing methods applied to prediction models of chemical composition for ground cocoa beans
| Component ground sample | Pre-processing | LV | Calibration | Prediction | RPD | RER | ||
|---|---|---|---|---|---|---|---|---|
| RMSE | R 2c | RMSE | R 2p | |||||
| Protein | NONE | 7 | 0.26 | 0.93 | 0.37 | 0.86 | 2.80 | 8.85 |
| MSC | 8 | 0.32 | 0.90 | 0.45 | 0.81 | 2.30 | 7.18 | |
| SNV | 6 | 0.36 | 0.87 | 0.46 | 0.81 | 2.25 | 7.12 | |
| 1st derivative | 8 | 0.18 | 0.97 | 0.30 | 0.91 | 3.40 | 10.79 | |
| 2nd derivative | 9 | 0.14 | 0.98 | 0.34 | 0.89 | 3.06 | 9.70 | |
| MSC + 1st derivative | 9 | 0.17 | 0.97 | 0.29 | 0.92 | 3.57 | 11.34 | |
| MSC + 2nd derivative | 8 | 0.15 | 0.98 | 0.32 | 0.91 | 3.19 | 10.13 | |
| Moisture | NONE | 8 | 0.21 | 0.97 | 0.29 | 0.95 | 4.34 | 13.33 |
| MSC | 7 | 0.22 | 0.97 | 0.31 | 0.95 | 4.06 | 12.49 | |
| SNV | 9 | 0.17 | 0.98 | 0.28 | 0.95 | 4.47 | 13.74 | |
| 1st derivative | 5 | 0.22 | 0.97 | 0.27 | 0.95 | 4.63 | 14.22 | |
| 2nd derivative | 3 | 0.27 | 0.95 | 0.31 | 0.94 | 4.05 | 12.43 | |
| MSC + 1st derivative | 4 | 0.23 | 0.97 | 0.28 | 0.95 | 4.47 | 13.72 | |
| MSC + 2nd derivative | 3 | 0.29 | 0.95 | 0.33 | 0.94 | 3.82 | 11.74 | |
| Fat | NONE | 8 | 0.52 | 0.96 | 0.76 | 0.92 | 3.64 | 10.23 |
| MSC | 9 | 0.38 | 0.98 | 0.56 | 0.96 | 4.95 | 13.89 | |
| SNV | 6 | 0.36 | 0.87 | 0.46 | 0.81 | 6.04 | 16.95 | |
| 1st derivative | 7 | 0.31 | 0.99 | 0.45 | 0.97 | 6.11 | 17.15 | |
| 2nd derivative | 8 | 0.25 | 0.99 | 0.51 | 0.96 | 5.41 | 15.18 | |
| MSC + 1st derivative | 7 | 0.35 | 0.98 | 0.53 | 0.97 | 5.22 | 14.66 | |
| MSC + 2nd derivative | 7 | 0.27 | 0.99 | 0.50 | 0.97 | 5.48 | 15.38 | |
| Ash | NONE | 4 | 0.08 | 0.94 | 0.10 | 0.92 | 3.48 | 10.20 |
| MSC | 6 | 0.07 | 0.96 | 0.08 | 0.95 | 4.06 | 11.89 | |
| SNV | 5 | 0.07 | 0.95 | 0.09 | 0.93 | 3.65 | 10.70 | |
| 1st derivative | 6 | 0.06 | 0.96 | 0.08 | 0.94 | 4.10 | 12.03 | |
| 2nd derivative | 5 | 0.06 | 0.96 | 0.08 | 0.95 | 4.24 | 12.41 | |
| MSC + 1st derivative | 5 | 0.07 | 0.95 | 0.09 | 0.92 | 3.66 | 10.71 | |
| MSC + 2nd derivative | 6 | 0.05 | 0.97 | 0.07 | 0.95 | 4.44 | 13.01 | |
| Carbohydrates | NONE | 8 | 0.44 | 0.94 | 0.60 | 0.90 | 3.09 | 8.55 |
| MSC | 8 | 0.32 | 0.97 | 0.48 | 0.93 | 3.86 | 10.69 | |
| SNV | 9 | 0.29 | 0.97 | 0.43 | 0.94 | 4.25 | 11.77 | |
| 1st derivative | 7 | 0.28 | 0.98 | 0.39 | 0.96 | 4.66 | 12.91 | |
| 2nd derivative | 6 | 0.33 | 0.97 | 0.44 | 0.95 | 4.18 | 11.58 | |
| MSC + 1st derivative | 7 | 0.28 | 0.98 | 0.39 | 0.96 | 4.78 | 13.24 | |
| MSC + 2nd derivative | 7 | 0.22 | 0.99 | 0.40 | 0.95 | 2.86 | 7.93 | |
| L* | NONE | 6 | 0.79 | 0.87 | 0.97 | 0.80 | 2.29 | 9.94 |
| MSC | 5 | 0.90 | 0.83 | 1.12 | 0.76 | 1.98 | 8.63 | |
| SNV | 5 | 0.90 | 0.83 | 1.14 | 0.74 | 1.95 | 8.49 | |
| 1st derivative | 2 | 0.99 | 0.80 | 1.13 | 0.77 | 1.97 | 8.56 | |
| 2nd derivative | 6 | 0.69 | 0.90 | 0.98 | 0.80 | 2.27 | 9.88 | |
| MSC + 1st derivative | 2 | 0.86 | 0.85 | 1.19 | 0.74 | 1.88 | 8.18 | |
| MSC + 2nd derivative | 5 | 0.79 | 0.87 | 1.09 | 0.77 | 2.05 | 8.92 | |
| a* | NONE | 6 | 0.46 | 0.81 | 0.61 | 0.69 | 1.32 | 5.09 |
| MSC | 6 | 0.46 | 0.81 | 0.60 | 0.70 | 1.79 | 6.92 | |
| SNV | 5 | 0.49 | 0.79 | 0.58 | 0.69 | 1.85 | 7.16 | |
| 1st derivative | 7 | 0.37 | 0.88 | 0.54 | 0.75 | 1.96 | 7.57 | |
| 2nd derivative | 6 | 0.42 | 0.84 | 0.62 | 0.68 | 1.72 | 6.63 | |
| MSC + 1st derivative | 7 | 0.37 | 0.87 | 0.54 | 0.73 | 1.98 | 7.65 | |
| MSC + 2nd derivative | 5 | 0.49 | 0.78 | 0.65 | 0.66 | 1.64 | 6.35 | |
| b* | NONE | 5 | 0.61 | 0.95 | 0.76 | 0.93 | 3.75 | 13.24 |
| MSC | 4 | 0.69 | 0.94 | 0.85 | 0.91 | 3.32 | 11.74 | |
| SNV | 2 | 0.93 | 0.89 | 1.00 | 0.88 | 2.82 | 9.98 | |
| 1st derivative | 4 | 0.65 | 0.95 | 0.83 | 0.91 | 3.40 | 12.01 | |
| 2nd derivative | 6 | 0.56 | 0.96 | 0.76 | 0.93 | 3.72 | 13.16 | |
| MSC + 1st derivative | 4 | 0.69 | 0.94 | 0.88 | 0.91 | 3.20 | 11.31 | |
| MSC + 2nd derivative | 5 | 0.61 | 0.95 | 0.83 | 0.92 | 3.42 | 12.07 | |
MSC multiplicative scatter correction, SNV standard normal variate, LV latent variables, RMSE root mean square error, R2c coefficient of calibration, R2p coefficient of prediction, RPD ratio of standard error of performance to standard deviation, RER range error ratio
Table 3.
Comparison of prediction ability for spectral pre-processing methods applied to prediction models of chemical composition for whole cocoa beans
| Component whole sample | Pre-processing | LV | Calibration | Prediction | RPD | RER | ||
|---|---|---|---|---|---|---|---|---|
| RMSE | R 2C | RMSE | R 2p | |||||
| Protein | NONE | 8 | 0.18 | 0.97 | 0.27 | 0.93 | 3.83 | 11.99 |
| MSC | 7 | 0.19 | 0.97 | 0.28 | 0.93 | 3.76 | 11.76 | |
| SNV | 9 | 0.14 | 0.98 | 0.24 | 0.95 | 4.35 | 13.61 | |
| 1st derivative | 7 | 0.13 | 0.99 | 0.18 | 0.97 | 5.95 | 18.64 | |
| 2nd derivative | 6 | 0.14 | 0.98 | 0.21 | 0.96 | 4.90 | 15.34 | |
| MSC + 1st derivative | 6 | 0.15 | 0.98 | 0.22 | 0.95 | 4.65 | 14.56 | |
| MSC + 2nd derivative | 5 | 0.19 | 0.97 | 0.26 | 0.94 | 4.01 | 12.57 | |
| Moisture | NONE | 8 | 0.20 | 0.97 | 0.31 | 0.94 | 4.05 | 12.57 |
| MSC | 7 | 0.19 | 0.98 | 0.31 | 0.95 | 4.14 | 12.85 | |
| SNV | 8 | 0.19 | 0.98 | 0.32 | 0.94 | 3.94 | 12.22 | |
| 1st derivative | 7 | 0.17 | 0.98 | 0.26 | 0.96 | 4.80 | 14.88 | |
| 2nd derivative | 6 | 0.18 | 0.98 | 0.28 | 0.95 | 4.45 | 13.80 | |
| MSC + 1st derivative | 6 | 0.20 | 0.98 | 0.28 | 0.95 | 4.53 | 14.07 | |
| MSC + 2nd derivative | 5 | 0.22 | 0.97 | 0.31 | 0.94 | 4.08 | 12.67 | |
| Fat | NONE | 7 | 0.58 | 0.96 | 0.90 | 0.91 | 3.20 | 8.67 |
| MSC | 6 | 0.56 | 0.96 | 0.77 | 0.92 | 3.70 | 10.04 | |
| SNV | 6 | 0.56 | 0.96 | 0.80 | 0.93 | 3.58 | 9.70 | |
| 1st derivative | 7 | 0.42 | 0.98 | 0.67 | 0.95 | 4.26 | 11.54 | |
| 2nd derivative | 6 | 0.48 | 0.97 | 0.74 | 0.93 | 3.89 | 10.55 | |
| MSC + 1st derivative | 6 | 0.48 | 0.97 | 0.73 | 0.94 | 3.94 | 10.67 | |
| MSC + 2nd derivative | 5 | 0.56 | 0.96 | 0.72 | 0.94 | 3.98 | 10.80 | |
| Ash | NONE | 6 | 0.07 | 0.96 | 0.08 | 0.94 | 4.05 | 11.58 |
| MSC | 4 | 0.07 | 0.95 | 0.09 | 0.94 | 3.98 | 11.39 | |
| SNV | 4 | 0.07 | 0.95 | 0.08 | 0.94 | 4.07 | 11.65 | |
| 1st derivative | 4 | 0.06 | 0.96 | 0.08 | 0.94 | 4.10 | 11.74 | |
| 2nd derivative | 5 | 0.06 | 0.97 | 0.08 | 0.94 | 4.08 | 11.68 | |
| MSC + 1st derivative | 4 | 0.06 | 0.96 | 0.08 | 0.95 | 4.49 | 12.85 | |
| MSC + 2nd derivative | 6 | 0.05 | 0.97 | 0.08 | 0.94 | 4.24 | 12.13 | |
| Carbohydrates | NONE | 8 | 0.49 | 0.93 | 0.69 | 0.87 | 2.67 | 7.35 |
| MSC | 7 | 0.48 | 0.93 | 0.66 | 0.86 | 2.81 | 7.75 | |
| SNV | 7 | 0.48 | 0.93 | 0.67 | 0.87 | 2.74 | 7.56 | |
| 1st derivative | 8 | 0.36 | 0.96 | 0.59 | 0.90 | 3.13 | 8.62 | |
| 2nd derivative | 6 | 0.40 | 0.95 | 0.59 | 0.90 | 3.11 | 8.58 | |
| MSC + 1st derivative | 6 | 0.43 | 0.94 | 0.59 | 0.91 | 3.16 | 8.71 | |
| MSC + 2nd derivative | 6 | 0.40 | 0.95 | 0.57 | 0.91 | 3.24 | 8.94 | |
MSC multiplicative scatter correction, SNV standard normal variate, LV latent variables, RMSE root mean square error, R2c coefficient of calibration, R2P coefficient of prediction, RPD ratio of standard error of performance to standard deviation, RER range error ratio
Most of the models required 8 latent variables or less, which could possibly be an indication of good models without occurrence of overfitting or the presence of noise interfering in the model (Faber and Rajkó 2007). Generally, including additional latent variables to the model reduced the values of RMSECV and PRESS to a position where these parameters either increased again or stabilised if more latent variables were added (Burger and Geladi 2006). These parameters varied slightly when comparing prediction models obtained from whole and ground samples. This could possibly be explained by the sampling method for whole samples, where several measurements were carried out for each sample, thus reducing light scattering effects. Since these effects are reduced in ground samples, this could possibly explain the similar accuracy of prediction models from whole and ground samples.
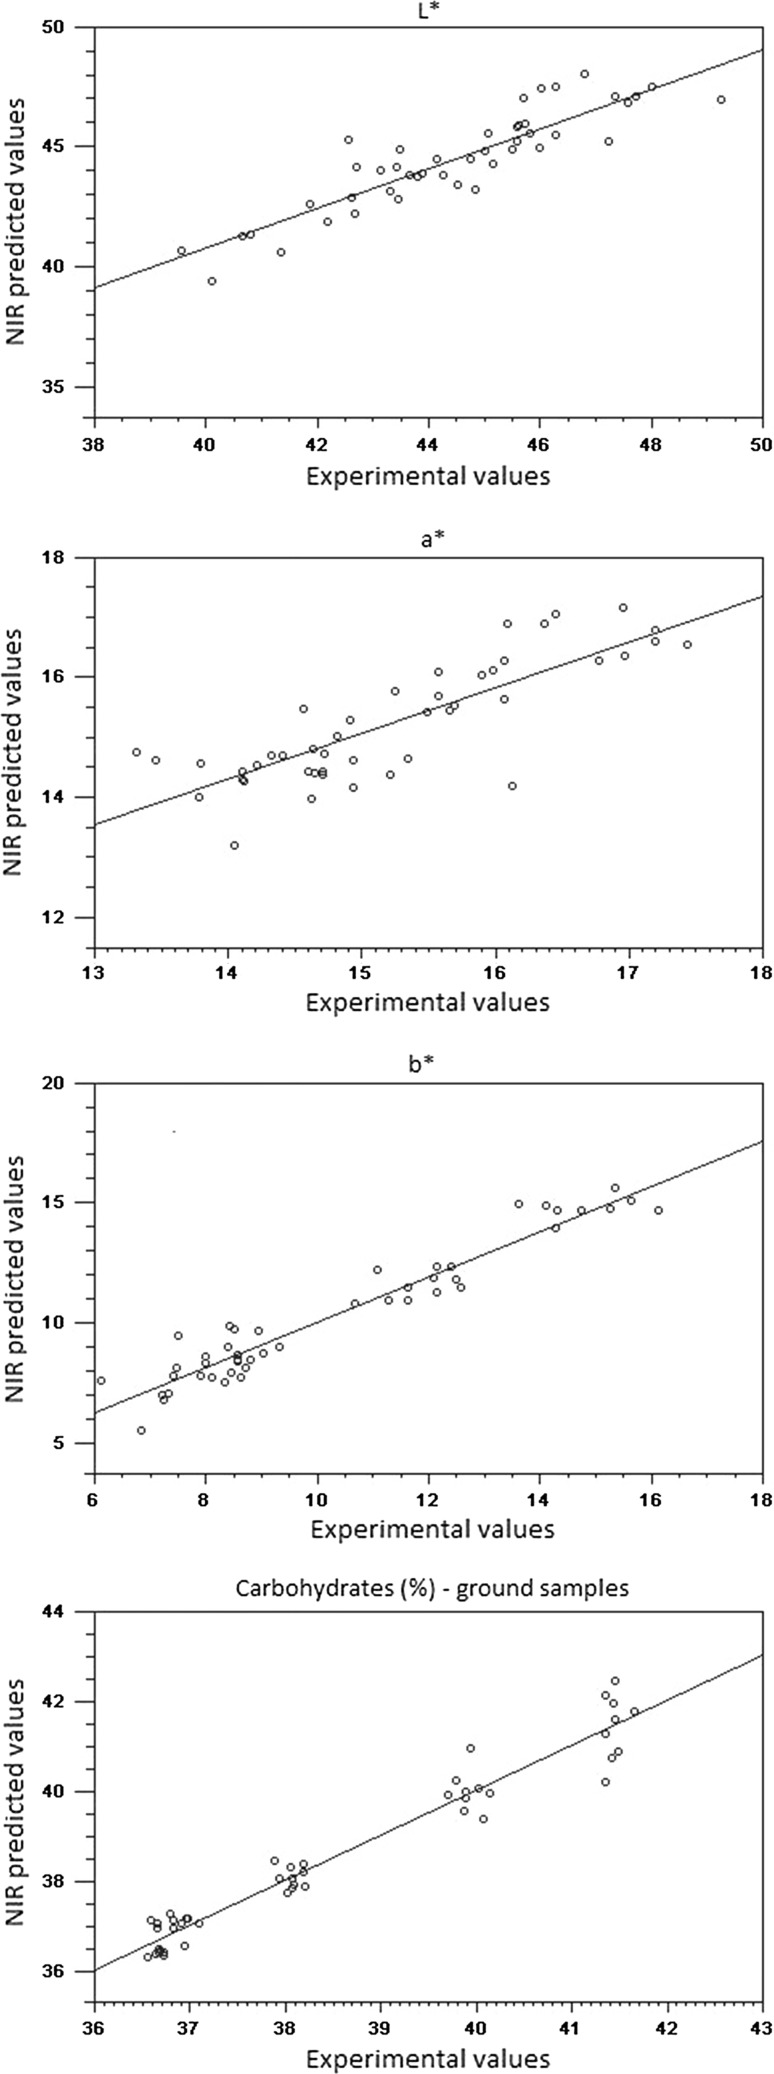
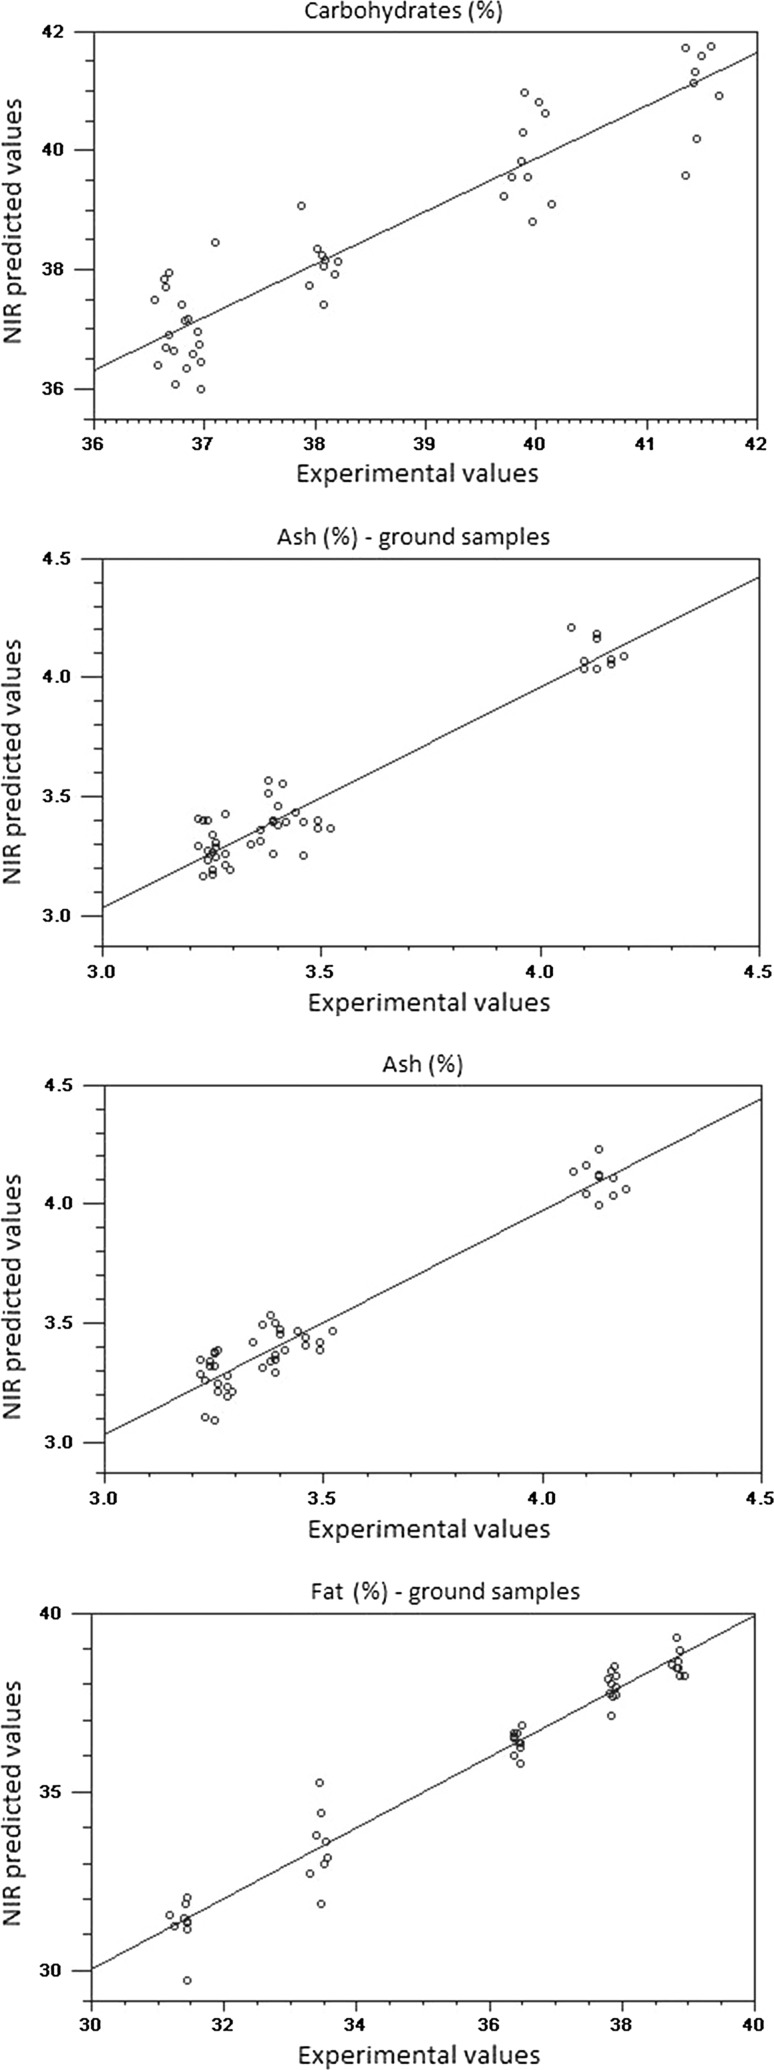
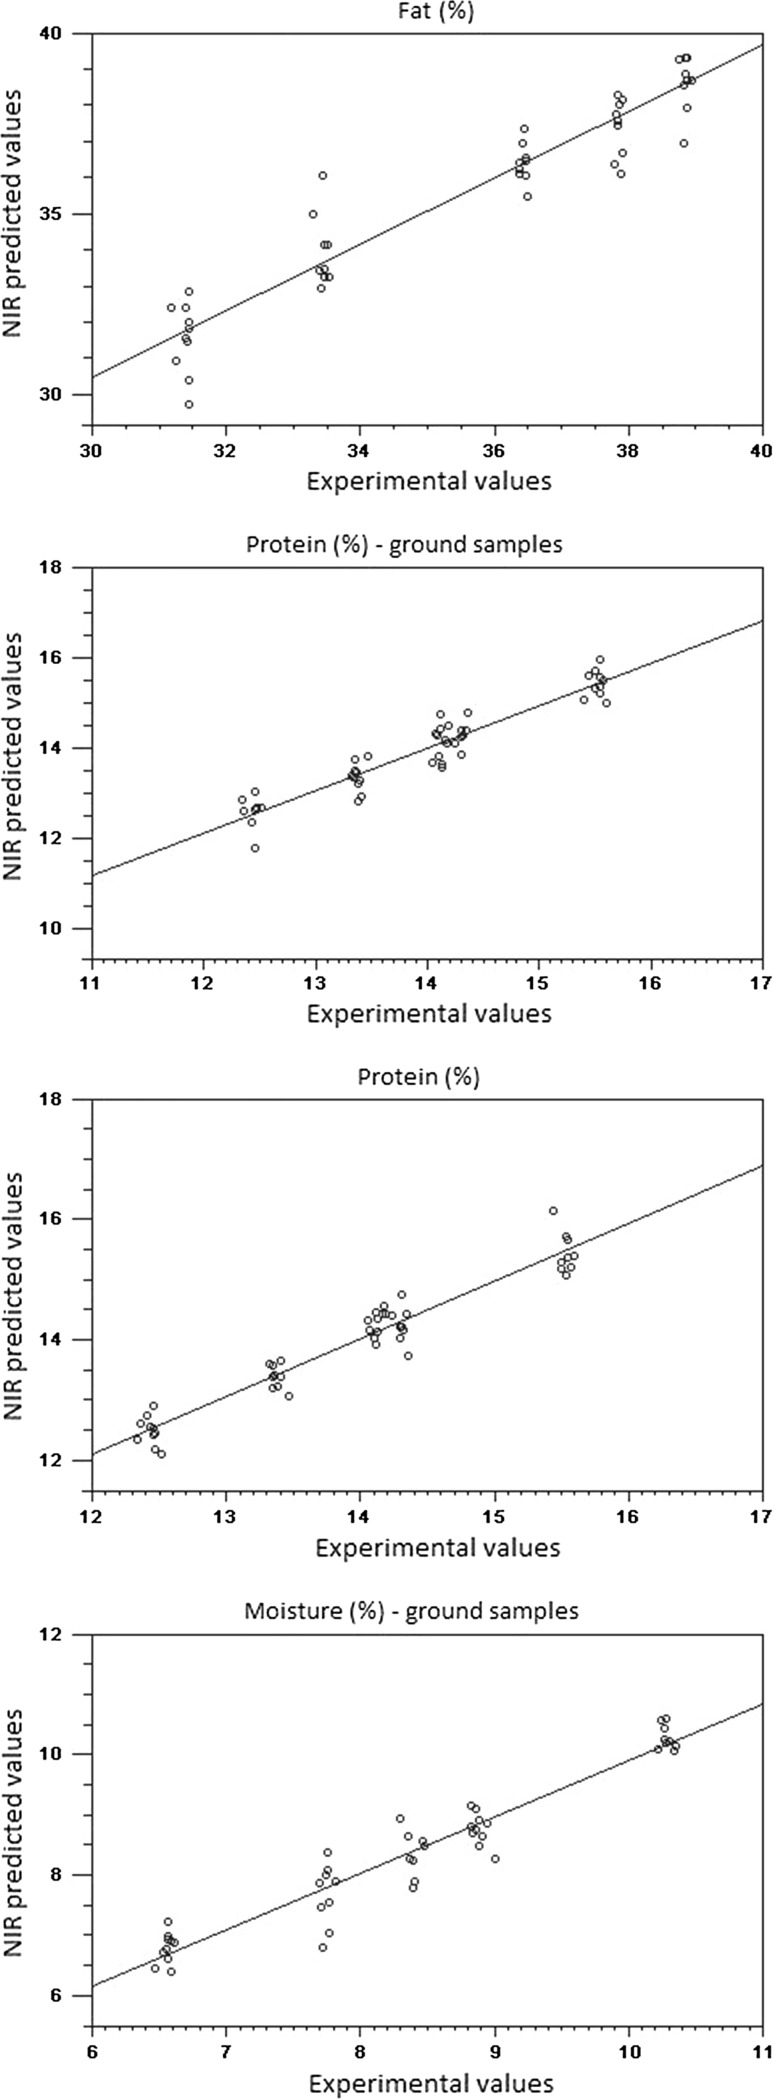
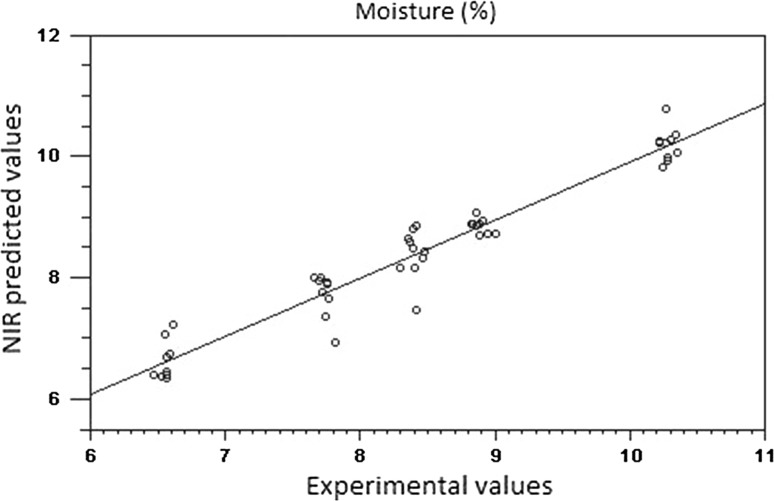
None of the spectral pre-processing methods provided considerable improvement of the predictive ability compared to the original data. Given that the complexity of the models was similar to that obtained with the original data; it is feasible to use the raw spectra to build prediction models for both whole beans and ground cocoa samples (Fig. 3). In addition, results of RER and RPD indicated good predictability for all parameters tested using the spectral information as predictors. Moisture content was the most accurately predicted parameter with RER values higher than 12. It is suggested that prediction models with R2 values greater than 0.9, RPD greater than 3, and an RER greater than 10, would result in successful models obtained from samples with a complex composition (Dagnew et al. 2004).
Fig. 3.
Linear regression plot of calibration between experimental and predicted values by NIR spectroscopy
NIR spectroscopy is based on vibrational properties of chemical bonds in organic molecules and their interactions with infrared radiation. Hence, identification of major components of samples supports NIR spectral analysis. Identification of major components of cocoa was performed in the current study, in order to support interpretation of spectral information and providing explanation for further studies on cocoa varieties. Prediction of cocoa beans quality (fermentation index, pH and total polyphenols) was previously reported using FT-NIR spectra (Sunoj et al. 2016). It was reported a coefficient of prediction (R2) of 0.88 and RMSECV of 0.26 for fermentation index, while total polyphenols were predicted with R2 of 0.84 and RMSECV of 0.93. Both parameters were associated with the wavelength range of 6904–5492 cm−1 (1660–1920 nm), which was also observed for samples investigated in the current study. These parameters are indirectly affected by samples chemical composition, thus the accuracy of prediction models for these parameters are lower than prediction models for major components.
Teye et al. (2016) applied FT-NIR spectroscopy for authentication of cocoa bean cultivars. The performance of SVM model was superior to LDA model, achieving an identification rate of 100% in both training set and prediction set. However, no further explanation was provided supporting the accuracy achieved. In the current study, it was observed significant difference in chemical composition among the different cocoa varieties investigated. This could explain the high accuracy in discrimination rate reported in previous studies on cocoa adulteration (Teye et al. 2014) and classification (Teye et al. 2016).
Conclusion
This work highlighted particular application of NIR spectroscopy for classification and differentiation of diverse cocoa varieties, in addition to the determination of their major chemical components. The application of NIR spectroscopy could facilitate the development of a relatively simple and automatic method to sort cocoa beans according to different varieties in addition to predict chemical composition of fermented and dried cocoa beans and colour features of ground cocoa samples.
Acknowledgements
The authors gratefully acknowledge the financial support from the Coordination for the Improvement of Higher Education Personnel (CAPES) strategic research initiative under the Brazilian Ministry of Education, Project Number 23038.019085/2009-14. This research was supported by Sao Paulo Research Foundation (FAPESP), Young Researchers Award, Grant Number 2015/24351-2. Professor Elisa Yoko Hirooka is a CNPq research fellow.
References
- Alvarez C, Perez E, Cros E, Lares M, Assemat S, Boulanger R, Davrieux F. The use of near infrared spectroscopy to determine the fat, caffeine, theobromine and (-)-epicatechin contents in unfermented and sun-dried beans of criollo cocoa. J Near Infrared Spectrosc. 2012;20:307–315. doi: 10.1255/jnirs.990. [DOI] [Google Scholar]
- AOAC . Official methods of analysis. 16. Washington: Association of Official Analytical Chemists; 1995. [Google Scholar]
- Barbin DF, ElMasry G, Sun D-W, Allen P. Predicting quality and sensory attributes of pork using near-infrared hyperspectral imaging. Anal Chim Acta. 2012;719:30–42. doi: 10.1016/j.aca.2012.01.004. [DOI] [PubMed] [Google Scholar]
- Barbin DF, ElMasry G, Sun D-W, Allen P. Non-destructive determination of chemical composition in intact and minced pork using near-infrared hyperspectral imaging. Food Chem. 2013;138:1162–1171. doi: 10.1016/j.foodchem.2012.11.120. [DOI] [PubMed] [Google Scholar]
- Barbin DF, Kaminishikawahara CM, Soares AL, Mizubuti IY, Grespan M, Shimokomaki M, Hirooka EY. Prediction of chicken quality attributes by near infrared spectroscopy. Food Chem. 2015;168:554–560. doi: 10.1016/j.foodchem.2014.07.101. [DOI] [PubMed] [Google Scholar]
- Barnes RJ, Dhanoa MS, Lister SJ, Susan J. Standard normal variate transformation and de-trending of near-infrared diffuse reflectance spectra. J Appl Spectrosc. 1989;43(5):772–777. doi: 10.1366/0003702894202201. [DOI] [Google Scholar]
- Bazoni CH, Ida EI, Barbin DF, Kurozawa LE. Near-infrared spectroscopy as a rapid method for evaluation physicochemical changes of stored soybeans. J Stored Prod. 2017;73:1–6. doi: 10.1016/j.jspr.2017.05.003. [DOI] [Google Scholar]
- Burger J, Geladi P. Hyperspectral NIR imaging for calibration and prediction: a comparison between image and spectrometer data for studying organic and biological samples. Analyst. 2006;131:1152–1160. doi: 10.1039/b605386f. [DOI] [PubMed] [Google Scholar]
- Copikova J, Novotna M, Smidova I, Synytsya A, Cerna M. Application of near infrared spectroscopy in chocolate analysis. Chemcké Listy. 2003;97:571–575. [Google Scholar]
- Dagnew MD, Crowe TG, Schoenau JJ. Measurement of nutrients in Saskatchewan hog manures using near-infrared spectroscopy. Can Biosyst Eng. 2004;46:33–37. [Google Scholar]
- Dhanoa MS, Lister SJ, Sanderson R, Barnes RJ. The link between multiplicative scatter correction (MSC) and standard normal variate (SNV) transformations of NIR spectra. J Near Infrared Spectrosc. 1994;2(1):43–47. doi: 10.1255/jnirs.30. [DOI] [Google Scholar]
- Faber NM, Rajkó R. How to avoid over-fitting in multivariate calibration—the conventional validation approach and an alternative. Anal Chim Acta. 2007;595:98–106. doi: 10.1016/j.aca.2007.05.030. [DOI] [PubMed] [Google Scholar]
- Fearn T, Riccioli C, Garrido-Varo A, Guerrero-Ginel JE. On the geometry of SNV and MSC. Chemometr Intell Lab. 2009;96(1):22–26. doi: 10.1016/j.chemolab.2008.11.006. [DOI] [Google Scholar]
- ISO (2016). ISO 3310-1 Test sieves—technical requirements and testing—part 1 test sieves of metal wire cloth
- Jakubıkova M, Sadecka J, Kleinova A, Majek P. Near-infrared spectroscopy for rapid classification of fruit spirits. J Food Sci Technol. 2016;53(6):2797–2803. doi: 10.1007/s13197-016-2254-4. [DOI] [PMC free article] [PubMed] [Google Scholar]
- Kaffka KJ, Norris KH, Kulcsar F, Draskovits I. Attempts to determine fat, protein and carbohydrate content in cocoa powder by the NIR technique. Acta Aliment. 1982;11:271–288. [Google Scholar]
- Krahmer A, Engel A, Kadow D, Ali N, Umaharan P, Kroh LW, Schulz H. Fast and neat—determination of biochemical quality parameters in cocoa using near infrared spectroscopy. Food Chem. 2015;181:152–159. doi: 10.1016/j.foodchem.2015.02.084. [DOI] [PubMed] [Google Scholar]
- Leite PB, Maciel LF, Opretzka LCF, Soares SE, Bispo ES. Phenolic compounds, methylxanthines and antioxidant activity in cocoa mass and chocolates produced from “witch broom disease” resistant and non resistant cocoa cultivars. Cienc e Agrotec. 2013;37(3):244–250. doi: 10.1590/S1413-70542013000300007. [DOI] [Google Scholar]
- Li G, Ren Y, Ren X, Zhang X. Non-destructive measurement of fracturability and chewiness of apple by FT-NIRS. J Food Sci Technol. 2015;52(1):258–266. doi: 10.1007/s13197-013-0990-2. [DOI] [PMC free article] [PubMed] [Google Scholar]
- Liu T, Zhou Y, Zhu Y, Song M, Li B-B, Shi Y, Gong J. Study of the rapid detection of γ-aminobutyric acid in rice wine based on chemometrics using near infrared spectroscopy. J Food Sci Technol. 2015;52(8):5347–5351. doi: 10.1007/s13197-014-1576-3. [DOI] [PMC free article] [PubMed] [Google Scholar]
- Madalozzo ES, Sauer E, Nagata N. Determination of fat, protein and moisture in ricotta cheese by near infrared spectroscopy and multivariate calibration. J Food Sci Technol. 2015;52(3):1649–1655. doi: 10.1007/s13197-013-1147-z. [DOI] [PMC free article] [PubMed] [Google Scholar]
- Martens H, Naes T. Multivariate calibration. Chichester: Wiley; 1989. [Google Scholar]
- Nicolai BM, Beullens K, Bobelyn E, Peirs A, Saeys W, Theron KI, Lammertyn J. Nondestructive measurement of fruit and vegetable quality by means of NIR spectroscopy: a review. Postharvest Biol Technol. 2007;46(2):99–118. doi: 10.1016/j.postharvbio.2007.06.024. [DOI] [Google Scholar]
- Osborne BG, Fearn T. Near infrared spectroscopy in food analysis. New York: Wiley; 1986. [Google Scholar]
- Osborne BG, Fearn T, Hindle PH. Pratical NIR spectroscopy: with applications in food and beverage analysis. Harlow: Longman Scientific & Technical; 1993. p. 227. [Google Scholar]
- Pizarro C, Esteban-Diez I, Nistal AJ, Gonzalez-Saiz JM. Influence of data pre-processing on the quantitative determination of the ash content and lipids in roasted coffee by near infrared spectroscopy. Anal Chim Acta. 2004;509(2):217–227. doi: 10.1016/j.aca.2003.11.008. [DOI] [Google Scholar]
- Reis N, França AS, Oliveira LS. Discrimination between roasted coffee, roasted corn and coffee husks by diffuse reflectance infrared fourier transform spectroscopy. Food Sci Technol. 2013;50:715–722. [Google Scholar]
- Skibsted ETS, Boelens HFM, Westerhuis JA, Witte DT, Smilde AK. New indicator for optimal preprocessing and wavelength selection of near-infrared spectra. J Appl Spectrosc. 2004;58(3):264–271. doi: 10.1366/000370204322886591. [DOI] [PubMed] [Google Scholar]
- Sunoj S, Igathinathane C, Visvanathan R. Nondestructive determination of cocoa bean quality using FT-NIR spectroscopy. Comput Electron Agric. 2016;124:234–242. doi: 10.1016/j.compag.2016.04.012. [DOI] [Google Scholar]
- Teye E, Huang XY, Lei W, Dai H. Feasibility study on the use of Fourier transform near-infrared spectroscopy together with chemometrics to discriminate and quantify adulteration in cocoa beans. Food Res Int. 2014;55:288–293. doi: 10.1016/j.foodres.2013.11.021. [DOI] [Google Scholar]
- Teye E, Uhomoibhi J, Wang H. Nondestructive authentication of cocoa bean cultivars by FT-NIR spectroscopy and multivariate techniques. Focus Sci. 2016 [Google Scholar]
- Veselá A, Barros AS, Synytsya A, Delgadillo I, Čopíková J, Coimbra MA. Infrared spectroscopy and outer product analysis for quantification of fat, nitrogen, and moisture of cocoa powder. Anal Chim Acta. 2007;601(1):77–86. doi: 10.1016/j.aca.2007.08.039. [DOI] [PubMed] [Google Scholar]
- Whitacre E, Oliver J, Van DBR, Van EP, Kremers B, Van DHB, Stewart M, Jansen-Beuvink A. Predictive analysis of cocoa procyanidins using near-infrared spectroscopy techniques. J Food Sci. 2003;68:2618–2622. doi: 10.1111/j.1365-2621.2003.tb05779.x. [DOI] [Google Scholar]
- Windig W, Shaver J, Bro R. Loopy MSC: a simple way to improve multiplicative scatter correction. J Appl Spectrosc. 2008;62(10):1153–1159. doi: 10.1366/000370208786049097. [DOI] [PubMed] [Google Scholar]


