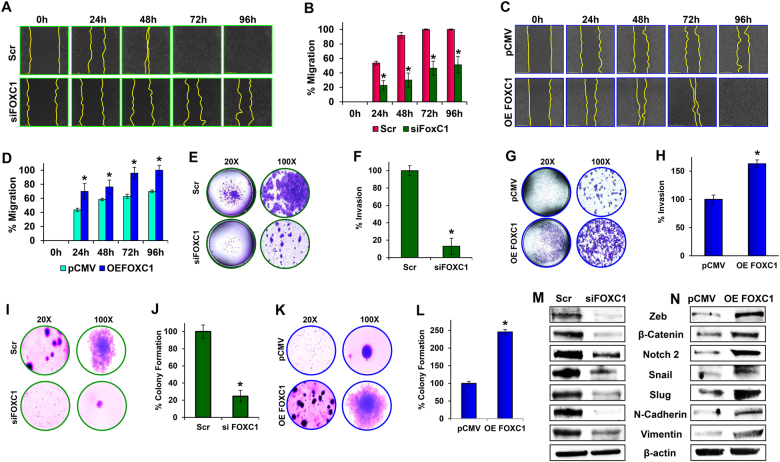
Fig. 4. Effect of FOXC1 on metastasis of pancreatic cancer cells.
a Wound-healing assay was performed in control (Scr) and FOXC1-silenced (siFOXC1) HPAC cells; migration was analyzed using an automated Nikon Biostation CT at 2 h intervals for up to 96 h at × 4 magnification. b Quantitative analysis of migration in FOXC1-silenced HPAC cells was calculated using NIS-Element AR software. c Wound-healing assay was performed in control (empty vector) and FOXC1-overexpressing (OE FOXC1) MIA PaCa-2 cells; migration was analyzed using an automated Nikon Biostation CT at 2 h intervals for up to 96 h at × 4 magnification. d Quantitative analysis of migration in FOXC1-overexpressing MIA PaCa-2 was calculated using NIS-Element AR software. e Invasiveness of FOXC1-silenced HPAC cells was observed using a Matrigel invasion assay (left: × 20 magnification; right: × 100 magnification). f Percentage invasion of control (Scr) and FOXC1-silenced (siFOXC1) HPAC cells was obtained by counting invaded cells from each group. g Invasiveness of FOXC1-overexpressing MIA PaCa-2 cells was observed using a Matrigel invasion assay (left: × 20 magnification; right: × 100 magnification). h Percentage invasion of control (pCMV) and FOXC1-overexpressing (OE FOXC1) MIA PaCa-2 cells was obtained by counting invaded cells from each group. i Colony formation assay was performed with control (Scr) and FOXC1-silenced (siFOXC1) HPAC cells (left: × 20 magnification; right: × 100 magnification). j The percentage of colonies were calculated with parental HPAC control cells serving as the baseline. k Colony formation assay was performed with control (pCMV) and FOXC1-overexpressing (OE FOXC1) MIA PaCa-2 cells (left: × 20 magnification; right: × 100 magnification). l The percentage of colonies were calculated with parental MIA PaCa-2 control cells serving as the baseline. m Western blot analysis of EMT markers in FOXC1-silenced HPAC cells and n FOXC1-overexpressing MIA PaCa-2 cells. Data shown as mean ± SEM. Experiments (n = 3) were repeated three times in triplicates. *p < 0.05

