

Abstract
The myocyte enhancer factor 2 (MEF2) regulates transcription in cardiac myocytes and adverse remodeling of adult hearts. Activators of G protein‐coupled receptors (GPCRs) have been reported to activate MEF2, but a comprehensive analysis of GPCR activators that regulate MEF2 has to our knowledge not been performed. Here, we tested several GPCR agonists regarding their ability to activate a MEF2 reporter in neonatal rat ventricular myocytes. The inflammatory mediator prostaglandin E2 (PGE 2) strongly activated MEF2. Using pharmacological and protein‐based inhibitors, we demonstrated that PGE 2 regulates MEF2 via the EP 3 receptor, the βγ subunit of Gi/o protein and two concomitantly activated downstream pathways. The first consists of Tiam1, Rac1, and its effector p21‐activated kinase 2, the second of protein kinase D. Both pathways converge on and inactivate histone deacetylase 5 (HDAC5) and thereby de‐repress MEF2. In vivo, endotoxemia in MEF2‐reporter mice induced upregulation of PGE 2 and MEF2 activation. Our findings provide an unexpected new link between inflammation and cardiac remodeling by de‐repression of MEF2 through HDAC5 inactivation, which has potential implications for new strategies to treat inflammatory cardiomyopathies.
Keywords: histone deacetylase 5, myocyte enhancer factor 2, p21‐activated kinase 2, prostaglandin E2, protein kinase D
Subject Categories: Cardiovascular System, Immunology
Introduction
Evidence has been provided that sustained stimulation of receptors on the plasma membrane of cardiac myocytes by distinct mediators including endothelin‐1 or α‐adrenergic agonists is able to trigger the development of pathological structural changes along with alterations of cardiac gene expression (Backs & Olson, 2006a). A pathognomonic change is the reactivation of the dormant embryonic isoforms of genes regulating cardiac growth, myocardial contractility and Ca2+‐handling (Backs & Olson, 2006a). In particular, the reactivation of fetal cardiac gene programs is suggested to lead to the progression of cardiac remodeling and heart failure. As those mediators play crucial roles in the activation of fetal gene programs, it seems a promising approach to identify and describe the distinct upstream signaling pathways, which may reveal new targets for therapeutic interventions.
The myocyte enhancer factor 2 (MEF2) transcription factors belong to the family of MADS (MCM1, agamous, deficiens, SRF) proteins (Potthoff & Olson, 2007). In mammals, four different MEF2 proteins exist, named MEF2A, B, C, and D. They bind a common DNA sequence and drive the expression of specific target genes (Potthoff & Olson, 2007). The MEF2 proteins have a crucial role in the proper cardiac development. Due to severe cardiac abnormalities, MEF2A‐ and MEF2C‐null mice exhibit pre‐ and perinatal lethality, respectively (Lin et al, 1997; Naya et al, 2002). In addition to their critical role in the embryonic development, the MEF2 isoforms and their splicing variants also govern the stress response in the adult heart by reactivation of fetal cardiac gene programs (van Oort et al, 2006; Kim et al, 2008; Gao et al, 2016). Whereas MEF2 transgenic mice develop ventricular dilation and contractile dysfunction, mice lacking the MEF2D gene are protected against fetal gene activation, fibrosis, and cardiac hypertrophy (van Oort et al, 2006; Kim et al, 2008). Therefore, the activity of MEF2 is tightly controlled. Whereas phosphorylation by mitogen‐activated protein (MAP) kinases and acetylation by the histone acetyltransferase p300 enhance the transcriptional activity of MEF2 (Potthoff & Olson, 2007; Wales et al, 2014; Wei et al, 2017), class IIa histone deacetylases (HDACs; HDACs 4, 5, 7, and 9) physically interact with MEF2 and recruit other repressive epigenetic factors (Backs & Olson, 2006a; Lehmann et al, 2014). A protective role of class IIa HDACs in heart failure has been suggested. For example, HDAC5 and HDAC9 prevent cardiac hypertrophy (Zhang et al, 2002; Chang et al, 2004) and HDAC4 is required for the maintenance of cardiac function during physiological exercise (Lehmann et al, 2018). Class IIa HDACs can be phosphorylated by several kinases, including the Ca2+/Calmodulin‐dependent protein kinase II (CaMKII), protein kinase D (PKD), or G protein‐coupled receptor kinase 5 (Backs & Olson, 2006a; Kreusser et al, 2014; Lehmann et al, 2014; Weeks & Avkiran, 2015). In turn, phosphorylated HDACs are guided by 14‐3‐3 chaperones from the nucleus to the cytoplasm and MEF2 is released from the inhibition and can activate downstream genes (Backs & Olson, 2006a). On the other hand, there are pathways which protect from the harmful hyper‐activation of MEF2 (Lehmann et al, 2014). For instance, activation of protein kinase A (PKA) has been shown to inhibit MEF2 activity and moreover to counteract CaMKII‐mediated activation of MEF2 (Backs et al, 2011; Weeks et al, 2017; Lehmann et al, 2018).
The upstream activation signal of the HDAC‐MEF2 axis often originates from G protein‐coupled receptors (GPCRs). The divergent pathways resulting from GPCRs could have antagonistic effects on MEF2 activation; therefore, it is difficult to predict the net effect on MEF2 activation by different mediators. The aim of this study was to identify new mediators that signal via GPCRs in cardiac myocytes and which were not known to activate the HDAC‐MEF2 axis before. Furthermore, we sought to explore the detailed resulting downstream signaling pathway. We found that prostaglandin E2 (PGE2), which is one of the main inflammatory mediators, strongly activates MEF2. PGE2 binds to the Gi/o‐coupled EP3 receptor, which activates divergent, parallel operating signaling pathways; one involving Tiam1‐, Rac1‐, and p21‐activated kinases (PAK) and another involving PKD and HDAC5. We found that full MEF2 activation depends on participation of both pathways and that MEF2 is activated in vivo in inflamed hearts.
Results
PGE2 activates MEF2 through the EP3 receptor
To identify unknown GPCR‐dependent signaling pathways that regulate MEF2 activity, we conducted a screening experiment using neonatal rat ventricular myocytes (NRVMs). NRVMs were infected with an adenovirus harboring a MEF2‐reporter (3xMEF2‐Luc), which responds to endogenous MEF2. Thereafter, the cells were stimulated with different GPCR agonists for 24 h in serum‐free medium. Similar to previous reports, endothelin‐1 (100 nM) activated MEF2 to a high extent (Backs et al, 2011). On the other hand, the β‐adrenergic receptor agonist isoproterenol (1 μM) significantly decreased the basal level of MEF2 activity. We identified several mediators, which slightly elevated the activity of MEF2, such as sphingosine‐1‐phosphate (1 μM) or lysophosphatidic acid (10 μM). Strikingly, we observed a 20‐fold activation by two related compounds, namely prostaglandin E1 (PGE1; 10 μM) and prostaglandin E2 (PGE2; 10 μM; Fig 1A). In contrast, analogs of other prostaglandins (fluprostenol and treprostinil, agonists of prostaglandin F and prostacyclin receptors, respectively) had no significant effect. In the following experiments, we focused on PGE2 because of its higher abundance in the heart in vivo (Herman et al, 1987). The PGE2 effect on MEF2 activity was concentration‐dependent (Fig EV1A). In good agreement with the ability to activate MEF2, PGE2 triggered the expression of known specific MEF2 target genes (Potthoff & Olson, 2007; Lehmann et al, 2018), such as Nur77, Myomaxin, or Adamts1 (Fig 1B). MEF2 activation is commonly associated with the induction of hypertrophic gene programs. Likewise, PGE2 increased the mRNA levels of the hypertrophy marker BNP (Fig 1B) and induced cellular hypertrophy of NRVMs, which correlated with the induction of MEF2 activity (Fig 1C). In addition, we observed a similar extent of protein synthesis induction after PGE2 stimulation as with the well‐known hypertrophic α‐adrenoceptor agonist phenylephrine (Fig EV1B). Next, we aimed to determine the receptor involved in PGE2‐mediated MEF2 activation. The four different isoforms of PGE2 receptors (EP1, EP2, EP3, EP4) show a different degree of G protein coupling and expression patterns (Woodward et al, 2011). Each of the four types is expressed in cardiac myocytes, but EP3 and EP4 receptors are the most abundant isoforms (Di Benedetto et al, 2008). The EP3 receptor antagonist L798106 inhibited PGE2‐dependent MEF2 activation (Figs 1D and EV1C), while neither the EP4 receptor antagonist L‐161,982 (2 μM) nor the EP1/EP2 receptor antagonist AH6809 (10 μM) led to an alteration of MEF2 activity, suggesting the EP3 receptor as the underlying receptor to activate MEF2 by PGE2 in NRVMs.
Figure 1. Screening the effect of different GPCR agonists on MEF2 activity.
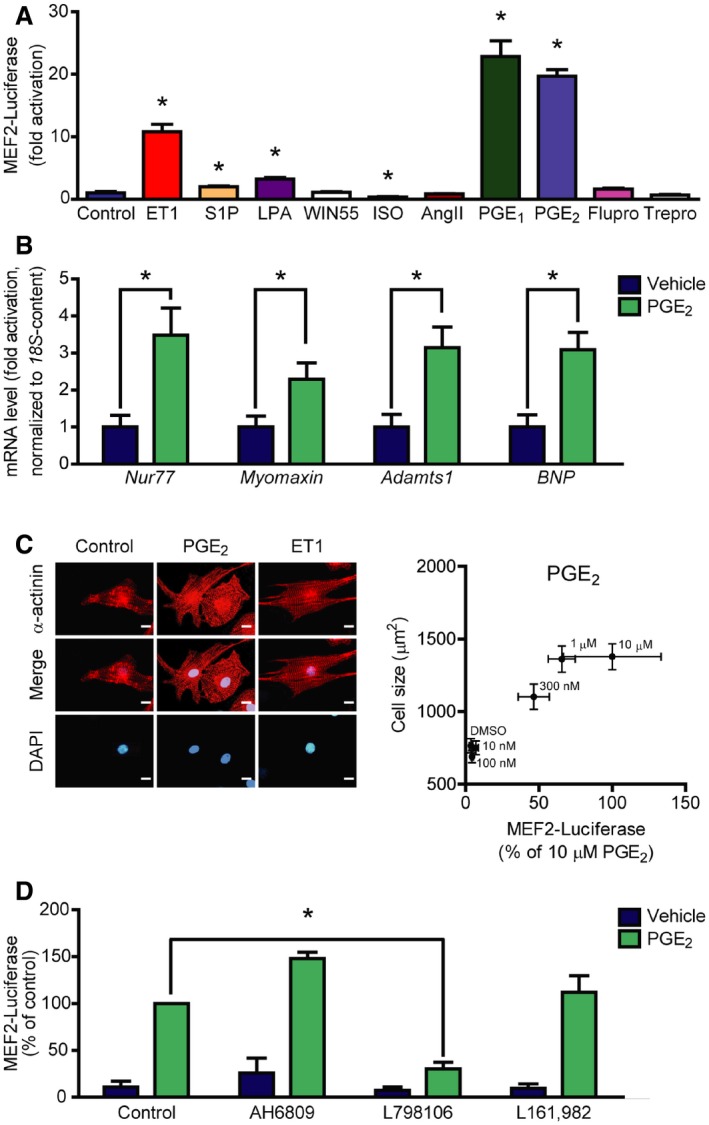
- Neonatal rat ventricular myocytes (NRVMs) were infected with the 3xMEF2‐Luc reporter, serum starved for 20 h, and stimulated for 24 h with different agonists: 100 nM endothelin‐1 (ET1), 1 μM sphingosine‐1‐phosphate (S1P), 10 μM lysophosphatidic acid (LPA), 1 μM WIN55,212‐2 (WIN55, cannabinoid receptor agonist), 1 μM isoproterenol (ISO, β‐adrenergic receptor agonist), 100 nM angiotensin II (AngII), 10 μM prostaglandin E1 (PGE1), 10 μM prostaglandin E2 (PGE2) or 100 nM prostanoid F receptor agonist fluprostenol (Flupro), 100 nM treprostinil (Trepro, prostacyclin receptor agonist).
- PGE2 induces the expression of MEF2 target genes. NRVMs were serum starved for 24 h, then were stimulated with 1 μM PGE2 for 2 h, and mRNA levels of the indicated genes were determined.
- Correlation between MEF2 activation and NRVM hypertrophy. MEF2 activity was measured as in (A) upon increasing concentration of PGE2. Cell size of NRVMs was determined after 48‐h stimulation with the indicated concentrations of PGE2. Left: Representative images of α‐actinin stained NRVMs stimulated with DMSO, 300 nM PGE2, or 1 nM ET1. Scale bar is 10 μm.
- PGE2 activates MEF2 via EP3 receptor. NRVMs were infected with the 3xMEF2‐Luc reporter and serum starved for 20 h. The cells were stimulated with DMSO or 1 μM PGE2 for 24 h in the presence or absence of different EP receptor antagonists: AH6809 (10 μM, EP1‐ and EP2‐antagonist) or 798106 (200 nM, EP3‐antagonist) or L161,982 (2 μM, EP4‐antagonist).
Figure EV1. PGE 2 activates MEF2 via the Gi/o protein‐coupled EP 3 receptor.
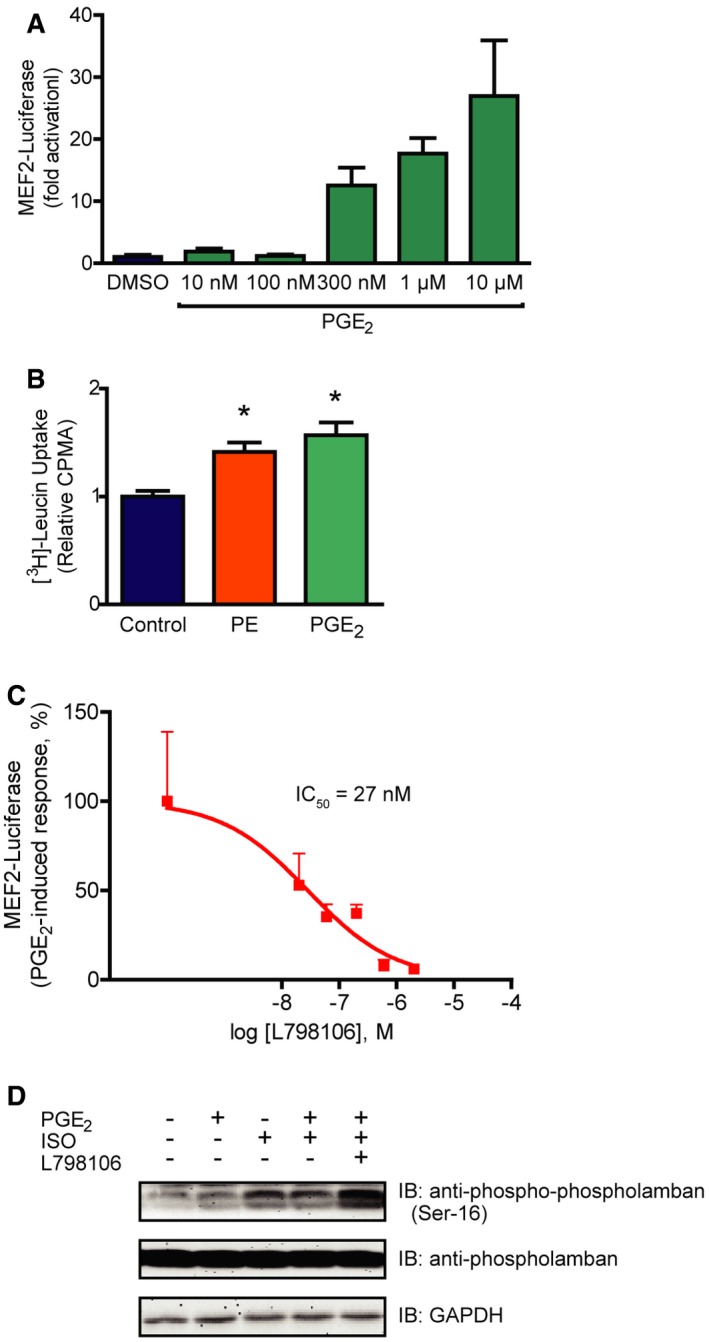
- Concentration dependency of the PGE2‐triggered MEF2 activity. MEF2 activity was assessed in 3xMEF2‐Luc‐infected NRVMs upon 24‐h stimulation with increasing concentration of PGE2.
- PGE2 induces protein synthesis in NRVMs. After serum starvation, NRVMs were treated with media containing 1 μCi/ml [3H]‐leucine and 100 μM PE or 10 μM PGE2 for 24 h. Thereafter, the cellular [3H]‐content was detected.
- Concentration‐dependent effect of L798106 on the PGE2‐induced MEF2 activation. MEF2 activity was determined in 3xMEF2‐Luc‐expressing NRVMs pretreated with increasing concentration of L798106 for 20 min and treated with DMSO or 1 μM PGE2 for 24 h. The PGE2‐induced response was calculated by subtracting the MEF2‐luciferase activity measured in vehicle‐treated cells from the PGE2‐induced response in the case of all 798106 concentrations.
- L798106 inhibits the Gi/o protein‐coupled receptor of PGE2. To prove that 798106 inhibits EP3 receptor, a cAMP signal‐decreasing receptor, we assessed the phosphorylation of phospholamban at a target site (Ser‐16) of protein kinase A, a well‐known cAMP‐regulated kinase. NRVMs were pretreated with 200 nM L798106 for 20 min, then with 100 nM PGE2 for 2 min. The β‐adrenergic receptor agonist isoproterenol (ISO, 10 nM) was used to induce a cAMP signal. Phosphorylation of phospholamban was detected by immunoblot. In the presence of the EP3 receptor inhibitor, PGE2 elevated the ISO‐induced phosphorylation of phospholamban, showing that L798106 inhibits the cAMP‐decreasing effect of PGE2.
PGE2 activates MEF2 through Gi/o proteins
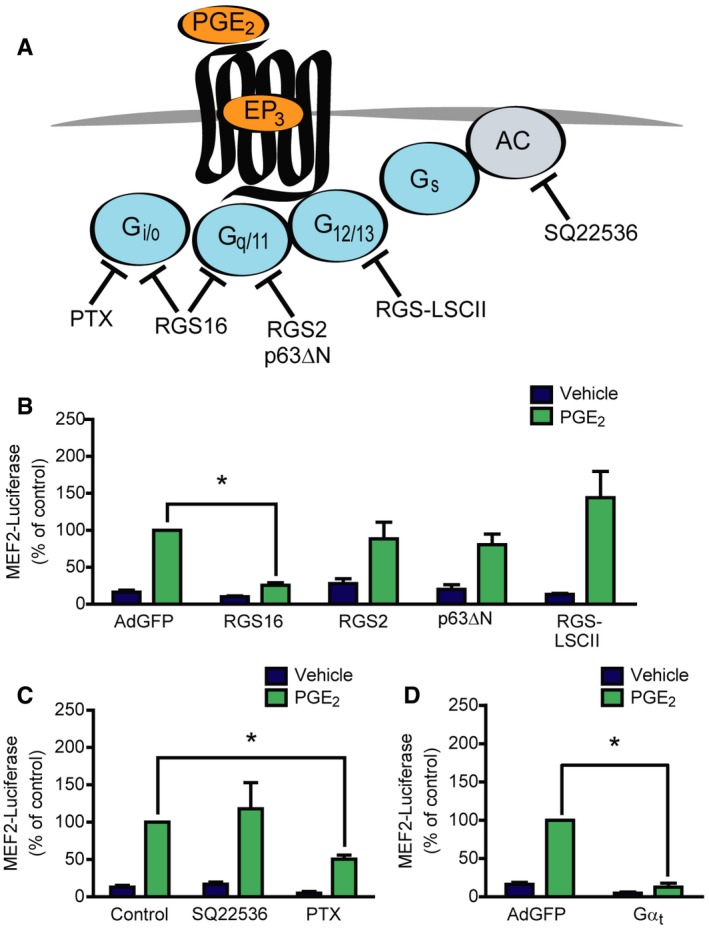
The EP3 receptor is generally considered to couple to pertussis toxin (PTX)‐sensitive Gi/o proteins, thereby decreasing intracellular cAMP levels. In accordance, EP3 receptor inhibition by L798106 increased the isoproterenol‐induced phosphorylation of phospholamban, a known cAMP‐regulated protein (Cuello et al, 2007; Fig EV1D). However, the EP3 receptor has several splice variants, which differ in the G protein‐coupling properties (Woodward et al, 2011). Therefore, we examined which heterotrimeric G protein types are essential for the PGE2‐mediated MEF2 activation by a pharmacological and molecular approach (Fig 2A). Regulator of G protein signaling (RGS) proteins are GTPase activating proteins (GAPs) and specifically block different classes of G proteins. RGS16 is a GAP for Gi/o and Gq/11 proteins, RGS2 suppresses Gq/11, while RGS‐LSCII inhibits the G12/13 signaling pathway (Vettel et al, 2012). Like RGS2, p63∆N, a specific scavenger of activated Gαq/11 proteins did not affect the PGE2‐induced activity of MEF2. In contrast, the Gi/o and Gq/11 inhibitor RGS16 (Fig 2B), as well as pretreatment with pertussis toxin (PTX, 100 ng/ml) attenuated the PGE2 response (Fig 2C). We did not observe any significant effect of RGS‐LSCII overexpression in this setting (Fig 2B). These data suggest that neither Gq/11‐ nor G12/13‐, but the PTX‐sensitive Gi/o protein activation is required for the PGE2 response. To rule out an involvement of Gs proteins, we inhibited adenylyl cyclase, the effector enzyme of Gs proteins. The adenylyl cyclase inhibitor SQ22536 (100 μM) did not affect MEF2 activity (Fig 2C). In addition, since the adenylyl cyclase inhibition also mimics the effect of Gαi/o, the absence of alteration suggested that not the α, but the βγ subunit of Gi/o is the transducer in the PGE2‐mediated MEF2 activation. In accordance, overexpression of Gαt to scavenge the free Gβγ subunits abolished the PGE2 effect (Fig 2D). Similar results were obtained with the overexpression of long isoform of RGS3 (RGS3L), another Gβγ scavenger (Vogt et al, 2007; Fig EV2). Taken together, these data indicate that the PGE2‐induced MEF2 activation is mediated by the βγ subunit of Gi/o proteins.
Figure 2. PGE 2‐mediated MEF2 activation is Gi/o‐βγ dependent.
-
AIllustration of the target points of the used pharmacological and protein‐based inhibitors.
-
B–D(B, D) NRVMs were infected with the 3xMEF2‐Luciferase reporter and with recombinant adenoviruses encoding EGFP (AdGFP), RGS16, RGS2, p63ΔN, RGS‐LSCII, or Gαt, as indicated. The cells were serum starved for 20 h and stimulated with DMSO or 1 μM PGE2 for 24 h. (C) NRVMs were infected with the 3xMEF2‐Luciferase reporter and pretreated with the adenylyl cyclase inhibitor SQ22536 (100 μM) for 20 min or the Gi/o protein inhibitor pertussis toxin (PTX, 100 ng/ml) for 20 h in serum‐starved conditions and treated with DMSO or 1 μM PGE2 for 24 h.
Figure EV2. The PGE 2‐induced MEF2 activity and protein synthesis is abolished by overexpression of the βγ‐scavenger RGS3L.
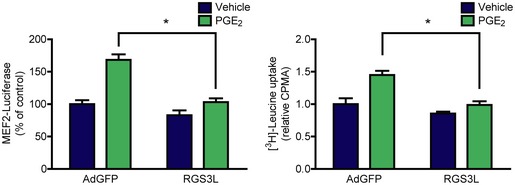
Left panel: NRVMs were infected on the first day with 3xMEF2‐Luc, on the next day with adenovirus encoding EGFP or RGS3L, then were serum starved. 24‐h vehicle or 1 μM PGE2 stimuli were used. Overexpression RGS3L prevented the PGE2‐induced response. Right panel: After infection with adenovirus encoding EGFP or RGS3L, NRVMs were starved, then treated with vehicle or 1 μM PGE2 in media containing 1 μCi/ml [3H]‐leucine for 24 h. Thereafter, [3H]‐leucine uptake was assessed. RGS3L counteracted the effect of PGE2. Values are mean + s.e.m., n = 3–4, technical replicates, two‐way ANOVA, *means significant interaction between RGS3L overexpression and the effect of PGE2, P < 0.05 (MEF2 activity: P = 0.007, [3H]‐leucine uptake: P = 0.0393). The exact n and P‐values can also be found in the Source Data Excel file for Fig EV2.Source data are available online for this figure.
PGE2 induces HDAC5 hyperphosphorylation and de‐repression of MEF2 via PKD
Among critical regulators of MEF2 are class IIa HDACs. A well‐known mechanism of de‐repression of MEF2 activity is HDAC phosphorylation followed by its concomitant nucleo‐cytoplasmic shuttling. Therefore, we analyzed the phosphorylation status of HDAC5 by Western blot. We overexpressed FLAG‐tagged HDAC5 in NRVMs. After stimulation with PGE2, we observed a high extent of hyperphosphorylation of HDAC5 at Ser‐498 (Fig 3A), similarly to endothelin‐1 (ET1, 100 nM) or phenylephrine (PE, 100 μM). Since Ser‐498 is a specific phosphorylation site of protein kinase D (PKD; Haworth et al, 2011), we examined whether PKD is responsible for the phosphorylation of HDAC5. Indeed, pretreatment with the specific PKD‐inhibitor BPKDi (3 μM; Meredith et al, 2010; Monovich et al, 2010) diminished the PGE2‐induced HDAC5 phosphorylation. In accordance, phosphorylation of PKD was increased at Ser‐744/Ser‐748 and Ser‐916 sites upon PGE2 treatment in NRVMs (Fig 3B), which was partly (phosphorylation at Ser‐744/Ser‐748) observed in adult mouse ventricular myocytes as well (Fig EV3). Different mechanisms of PKD activation exist. It is known that PKD can be activated in a protein kinase C (PKC)‐dependent way, e.g., by PE. In contrast, ET1 stimulates PKD activity in a PKC‐independent manner in NRVMs (Vega et al, 2004; Harrison et al, 2006; Haworth et al, 2007; Guo et al, 2011). Thus, the involvement of PKC in the PGE2‐mediated PKD and HDAC5 phosphorylation was examined. Phosphorylation of PKD at Ser‐744/Ser‐748, a well‐known PKC‐target site, was diminished upon pretreatment with the PKC‐inhibitor bisindolylmaleimide I (BIM, 2 μM). However, phosphorylation of the autophosphorylation site (Ser‐916) was only slightly decreased (Fig 3B), and HDAC5 phosphorylation at Ser‐498 was not altered (Fig 3A) by BIM, suggesting that the activation of PKD by PGE2 occurs both PKC dependently and PKC independently. Nevertheless, BPKDi prevented MEF2 activation by PGE2 (Fig 3C). In contrast, inhibition of another HDAC kinase, CaMKII, by autocamtide‐2‐related inhibitory peptide II (AIP, 1 μM) did not affect PGE2‐mediated MEF2 activity. We therefore conclude that PGE2 promotes HDAC5 hyperphosphorylation and de‐repression of MEF2 activity via PKD.
Figure 3. PGE 2 induces HDAC5 hyperphosphorylation and concomitant MEF2 activation via PKD .
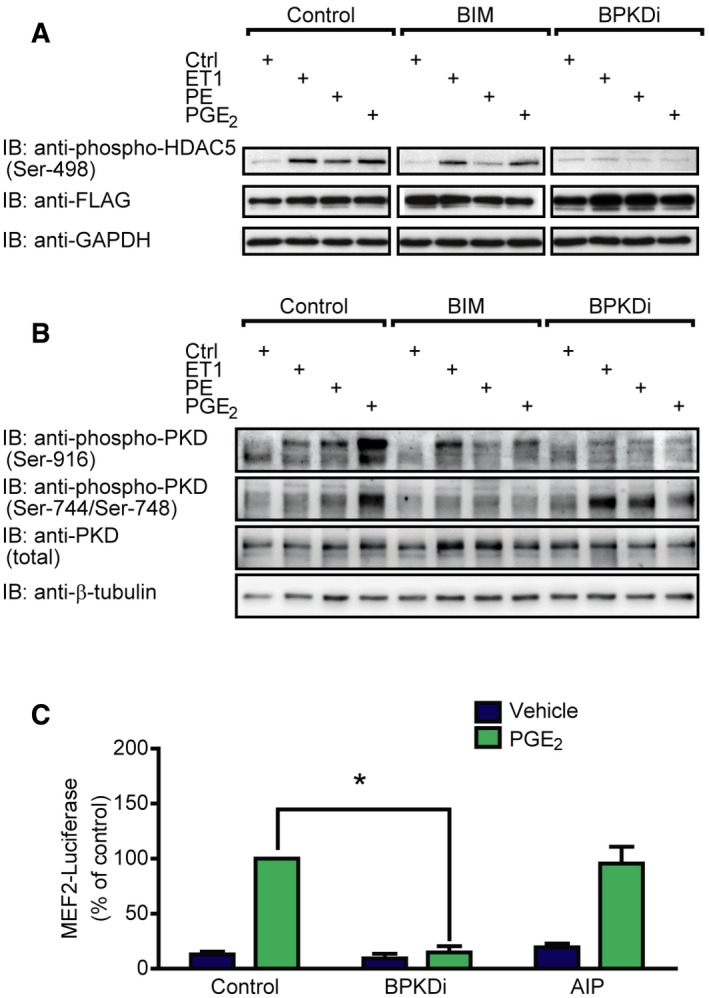
-
A, BNRVMs were infected with recombinant adenovirus encoding Flag‐HDAC5 (A) or not infected (B) and serum starved for 20 h. The cells were pretreated with the PKC‐inhibitor bisindolylmaleimide I (2 μM) or the PKD‐inhibitor BPKDi (3 μM) for 20 min and stimulated with 100 nM endothelin‐1 (ET1) or 100 μM phenylephrine (PE) or 1 μM PGE2 for 4 h, as indicated. HDAC phosphorylation was detected by immunoblotting with the anti‐HDAC5 phospho‐Ser‐498 antibody, phosphorylation of PKD was assessed using anti‐phospho‐PKD antibodies (Ser‐744/Ser‐748 and Ser‐916), and representative images are shown from three independent experiments.
-
CNRVMs were infected with the 3xMEF2‐Luc reporter and serum starved for 20 h. The cells were pretreated with the PKD‐inhibitor BPKDi (3 μM) or the CamKII‐inhibitor AIP (1 μM) for 20 min and stimulated with DMSO or 1 μM PGE2 for 24 h. N = 3, *represents significant interaction between the two treatments (P < 0.05, two‐way ANOVA, BPKDi, P < 0.0001; AIP, P = 0.2197). Values are mean ± s.e.m. The exact n and P‐values can also be found in the Source Data Excel file for Fig 3.
Source data are available online for this figure.
Figure EV3. PGE 2 triggers phosphorylation of PKD in adult mouse ventricular myocytes.
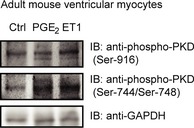
Adult mouse ventricular myocytes were serum starved for 4 h and treated with 1 μM PGE2 or 100 nM ET1 for 4 h. Phosphorylation of PKD was assessed by immunoblot. Representative images are shown.Source data are available online for this figure.
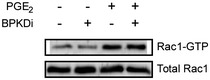
PGE2 triggers Rac1 activation via Tiam1
Several effector partners of Gi/o‐βγ have been described, among others the small G protein Rac1 and RhoA (Vogt et al, 2007). To test whether these small G proteins are activated by PGE2 in NRVMs, we performed effector pull‐down assays and we found, that exclusively Rac1, but not RhoA is activated after PGE2 stimulation (Fig 4A). To examine whether Rac1 activation is Gi/o‐dependent, we used PTX treatment and overexpression of RGS16. Both manipulations suppressed the PGE2‐induced Rac1 activation (Fig 4B and C). Earlier studies have shown that the Gi/o‐mediated Rac1 activation in NRVM can occur in a Gi/o‐βγ‐, phosphatidyl‐inositol‐3‐kinase (PI3K)‐, and the guanine nucleotide exchange factor Tiam1‐dependent manner and that the interaction between Tiam1 and Rac1 can be inhibited by NSC23766 (Vettel et al, 2012). Treatment with 50 μM NSC23766 (NSC) diminished the PGE2‐induced Rac1 activation (Fig 4C), suggesting that PGE2 triggers Rac1 activation via Gi/o and Tiam1.
Figure 4. PGE 2 induces Rac1 and MEF2 activation via Gi/o and the RacGEF Tiam1.
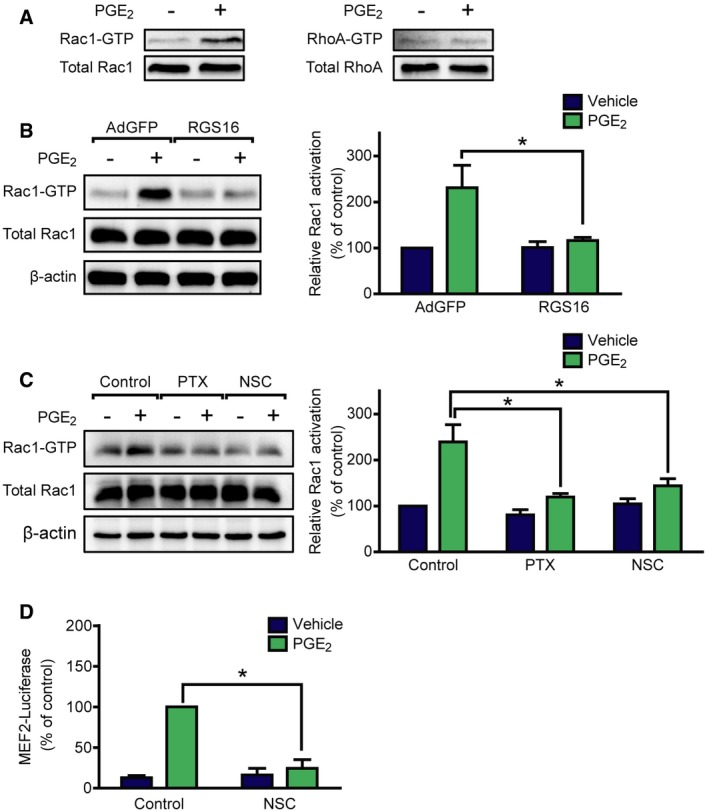
- NRVMs were serum starved for 24 h and stimulated for 2 min with 10 μM PGE2. Rac1 and RhoA GTPase activation was determined by effector pull‐down assay and analyzed by immunoblot.
- NRVMs were infected with recombinant adenoviruses encoding EGFP (AdGFP) or RGS16 24 h prior to stimulation, and then, Rac1 activity was measured.
- Cells were pretreated with 100 ng/ml pertussis toxin (PTX, Gi/o‐inhibitor) for 24 h or with 50 μM NSC23766 (NSC, Tiam1–Rac1 interaction inhibitor) for 2 h. Thereafter, Rac1 activation was determined by effector pull‐down assay.
- NRVMs were transduced with the 3xMEF2‐Luc reporter and were serum starved for 20 h. After 2 h of 50 μM NSC23766 (A) pretreatments, the cells were stimulated with DMSO or 1 μM PGE2 for 24 h, and then, MEF2 activity was determined. NSC abolished the MEF2 activation by PGE2.
PGE2‐induced MEF2 but not PKD activation requires Tiam1‐dependent Rac1 activation
We hypothesized that MEF2 activation by PGE2 may thus occur downstream of Tiam1 and Rac1. For verification, we treated NRVMs with NSC (Fig 4D). The Tiam1–Rac1 interaction inhibitor diminished the MEF2 activation after PGE2 stimulation, indicating that the PGE2‐induced signaling pathway toward MEF2 includes Tiam1 and Rac1. To investigate the theoretical possibility that Rac1 exerts its effect on MEF2 through PKD, we measured PKD phosphorylation after treatment with NSC (Fig 5A). However, PGE2‐induced PKD phosphorylation at Ser‐744/Ser‐748 and Ser‐916 was not affected by NSC treatment. Likewise, NSC could not prevent PGE2‐induced HDAC5 phosphorylation at Ser‐498 (Fig 5B). Moreover, inhibition of PKD did not block the Rac1 activation (Fig EV4). p21‐activated kinases (PAKs) are well‐characterized effector proteins of Rac1 (Vettel et al, 2012). In accordance, the phosphorylation of the isoform 2 of PAK (PAK2) was increased upon PGE2 at Ser‐192/Ser‐197 and Thr‐402 sites in NRVMs in a partly EP3 receptor‐dependent manner but not in cardiac fibroblasts, similar to the phosphorylation of PKD (Fig 5C). Thus, we examined their role in MEF2 regulation, as possible participants in the Rac1‐induced MEF2 activator pathway. Indeed, the PAK inhibitor IPA‐3 (30 μM) significantly attenuated the activation of MEF2 upon stimulation with PGE2 (Fig 5D). We then tested whether the Tiam1–Rac1–PAK2 pathway regulates the cellular localization of HDAC5. Like ET1, PGE2 induced the nucleo‐cytoplasmic shuttling of HDAC5 (Fig 6). Strikingly, IPA‐3 decreased the cytosolic translocation of HDAC5, similar to the PKD‐inhibitor BPKDi, which was even stronger through a combined pretreatment with both compounds. These findings suggest that PGE2 promotes more likely two parallel pathways regulating nucleo‐cytoplasmic shuttling of HDAC5. The first is dependent on PKD activation and HDAC phosphorylation, and the other involves the Tiam1–Rac1‐mediated activation of PAK2 affecting nucleo‐cytoplasmic shuttling of HDAC5 by a mechanism that remains to be identified. Thus, two pathways converge on HDAC5 and may promote MEF2 activation synergistically.
Figure 5. PGE 2 activates MEF2 through PAK2 in NRVMs.
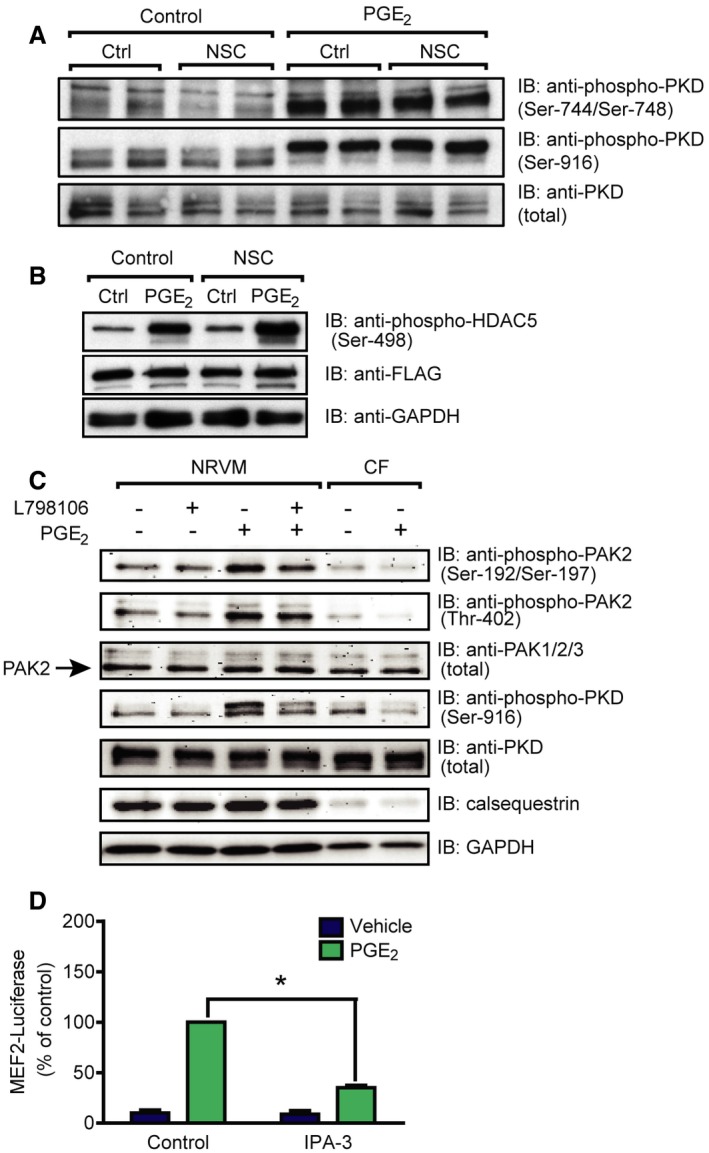
- After serum starvation, NRVMs were pretreated with or without 50 μM NSC23766 for 2 h and stimulated with 1 μM PGE2 for 1 h. Total and phosphorylated PKD levels were analyzed by immunoblot. PKD was activated by PGE2, but it was not affected by NSC.
- After infection with Flag‐HDAC5 and serum starvation, NRVMs were treated with 50 μM NSC23766 for 2 h prior to stimulation. The cells were stimulated with 1 μM PGE2 for 1 h. HDAC5 phosphorylation at Ser‐498 was detected by immunoblot. The phosphorylation of HDAC5 at this site was not prevented by NSC.
- NRVMs and neonatal cardiac fibroblasts (CFs) were serum starved, pretreated with vehicle or 200 nM L798106 (EP3 receptor antagonist) for 20 min, and were stimulated with 1 μM PGE2 for 10 min. PAK2 and PKD phosphorylation were assessed by immunoblot. Calsequestrin was used as a myocyte marker.
- MEF2 activity was determined in cells infected with the 3xMEF2‐Luc reporter after serum starvation. Cells were stimulated with vehicle or 1 μM PGE2 for 24 h after 1‐h of 30 μM IPA‐3 pretreatment. IPA‐3 inhibited the MEF2 activation by PGE2.
Figure EV4. PGE 2‐induced Rac1 activation does not involve PKD .
Serum‐starved NRVMs were treated with 3 μM BPKDi prior to stimulation. After treatment with 10 μM PGE2 for 2 min, Rac1 activation was determined by effector pull‐down assay. Representative image from three independent experiments.Source data are available online for this figure.
Figure 6. PGE2‐induced nuclear export of HDAC5 is regulated by both PKD and PAK2.
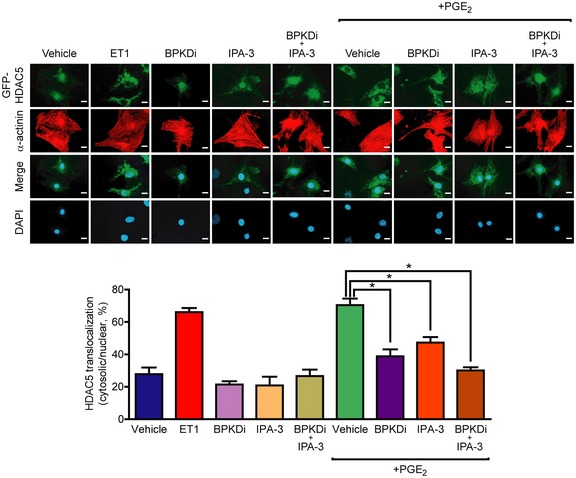
Top: GFP‐HDAC5‐infected NRVMs were serum starved for a day, pretreated for 2 h with the indicated compounds (BPKDi, 3 μM, IPA‐3, 30 μM) alone or in combination, then were stimulated for 4 h. Representative images. Scale bar is 10 μm. Bottom: Statistical analysis of cellular localization of HDAC5. GFP‐HDAC5 localization (nuclear or cytosolic) was assessed in > 100 cells of each sample (n = 3, technical replicates). *P < 0.05 (one‐way ANOVA with Bonferroni post hoc test, vehicle vs. ET1 or vs. PGE2, P < 0.0001; PGE2 vs. PGE2 + BPKDi, P = 0.0004; PGE2 vs. PGE2 + BPKDi, P = 0.0114; PGE2 vs. PGE2 + BPKDi + IPA‐3, P < 0.0001). The exact n and P‐values can also be found in the Source Data Excel file for Fig 6.Source data are available online for this figure.
Cardiac inflammation leads to increased myocardial PGE2 levels and MEF2 activation in vivo
To confirm the in vivo relevance of these results, we used the LPS‐induced endotoxemia model to induce myocardial inflammation. The inflammatory effect in this model was confirmed by increased mRNA levels of pro‐inflammatory cytokines including interleukin 6 (IL6) and tumor necrosis factor α (TNFα; Fig 7A). Importantly, the LPS‐treated mice displayed more than twofold higher levels of PGE2 in the myocardium (Fig 7B). Histological and “whole organ” staining of β‐galactosidase activity in MEF2‐lacZ reporter mice showed a lacZ‐positive myocardium and in particular cardiac myocytes as sign for MEF2 activation in cardiac myocytes, which was not observed in sham‐treated mice (Fig 7C). Moreover, we found increased activity of the in vitro identified pathways upstream to MEF2 in inflammation. Phosphorylation of PKD at Ser‐744/Ser‐748 and of HDAC5 was significantly elevated, and we observed a slight but statistically significant increase of PAK2 phosphorylation at Thr‐402 (Fig 7D).
Figure 7. LPS‐induced endotoxemia leads to myocardial inflammation, increased myocardial PGE 2 levels, and MEF2 activation.
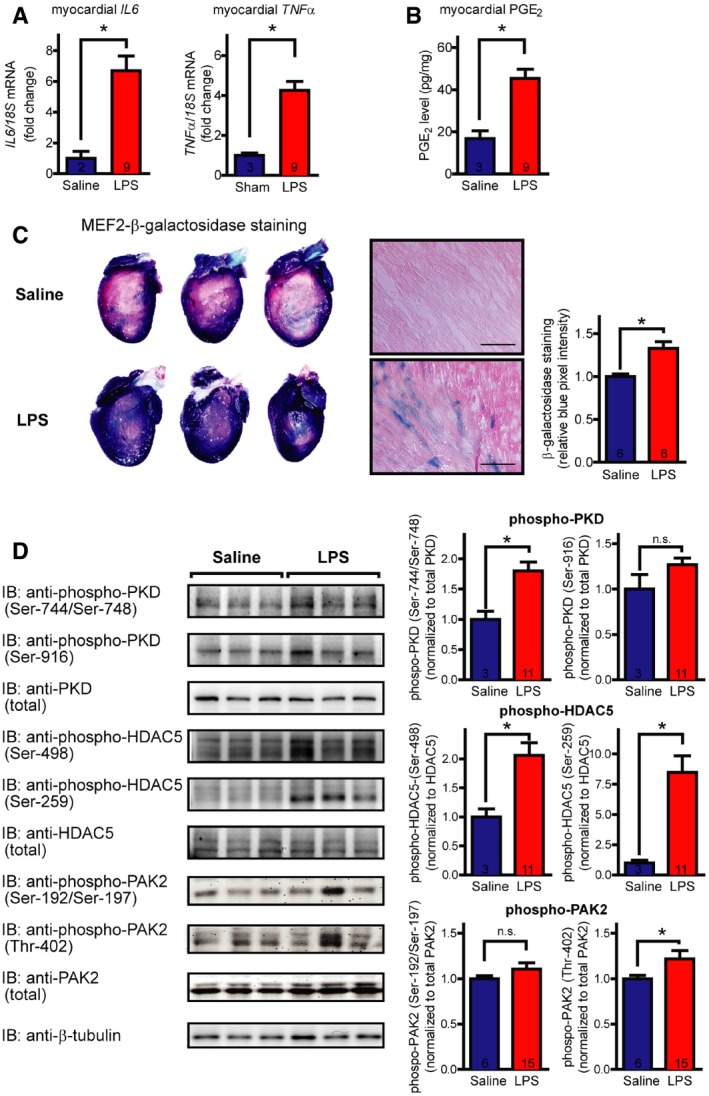
- mRNA levels of different inflammatory cytokines, as indicated. The graphs show relative mRNA levels, fold increase compared to saline‐treated controls, normalized to 18s content.
- PGE2 was quantified after mechanical homogenization of deeply frozen hearts using nano‐liquid chromatography‐tandem mass spectrometry.
- Histologic and macroscopic stainings of β‐galactosidase activity in MEF2‐lacZ reporter mice show MEF2 activation (blue cells and precipitates, respectively) in the myocardium upon LPS treatment. Saline‐treated littermates served as control. Scale bar of histological stainings is 100 μm. Quantification of whole‐heart stainings is shown in the right panel (pixel intensity in blue channel normalized to total intensity).
- Induction of PKD, HDAC5, and PAK2 in myocardial inflammations. Immunoblots were performed on extracts of hearts of saline‐ and LPS‐treated mice. Representative blots are shown in the left panel, and the quantification is in the right panel.
Discussion
Our results identify PGE2 as a powerful activator of the MEF2 transcription factor in cardiac myocytes. PGE2 is one of the main mediators of inflammation (Woodward et al, 2011). Several studies linked chronic inflammation with the progression of cardiac remodeling and heart failure but the exact mechanism how signals are transduced toward cardiac gene expression are not understood (Hofmann & Frantz, 2013). Since the role of MEF2 is well established in transcriptional activation that drives adverse cardiac remodeling, our findings reveal a yet unrecognized link between myocardial inflammation and adverse remodeling leading to heart failure and unmask potential new drug targets in the setting of inflammatory cardiomyopathies. Accordingly, several groups have shown that PGE2 induces cardiomyocyte hypertrophy but could not link their results to a distinct transcriptional pathway (Mendez & LaPointe, 2005; Frias et al, 2007; He et al, 2010). In these studies, pro‐hypertrophic effects of the Gi/o‐coupled EP3 and the Gs‐coupled EP4 receptors were reported. Here, we show that the EP3, but not EP4 receptor is responsible for the induction of MEF2 activity, suggesting that EP4 signals to another transcriptional pathway that still needs to be identified.
Phosphorylation of class IIa HDACs is a critical signaling event for their nucleo‐cytoplasmic shuttling and de‐repression of MEF2 activity (Vega et al, 2004). Here, we show that PGE2 leads to activation of PKD and HDAC5 phosphorylation at its 14‐3‐3 binding site that induces nucleo‐cytoplasmic shuttling. HDAC5 phosphorylation was not influenced by CaMKII inhibition, which is consistent with our previous results that CaMKII selectively phosphorylates HDAC4 but not HDAC5 (Backs et al, 2006b, 2008). On the other hand, data of our group suggested a role of CaMKII for leukocyte recruitment via a newly identified cardiac myocyte‐intrinsic immune response (Weinreuter et al, 2014), suggesting the existence of another CaMKII‐HDAC4‐dependent pathway in cardiac inflammation that is independent of the here described PGE2‐EP3‐PKD‐HDAC5 axis.
Protein kinase D is considered as a powerful mediator of myocardial contraction, cardiac hypertrophy, and remodeling (Cuello et al, 2007; Avkiran et al, 2008; Fielitz et al, 2008). Interestingly, the properties of PKD activation originating from different GPCRs can show distinct characteristics in cardiac myocytes. For example, the α1‐adrenergic receptor agonist phenylephrine only activates PKD in a PKC‐dependent manner and the activated form rapidly shuttles from the sarcolemma to the nucleus. In contrast, ET1 can activate PKD via PKC‐dependent and PKC‐independent signaling pathways and promotes more sustained activation of PKD at the sarcolemma (Bossuyt et al, 2011). We found that PGE2, like ET1, can activate PKD also through a PKC‐independent mechanism. Thus, we propose that PGE2 stimulates PKD via Gi/o‐βγ. Gβγ was demonstrated to activate PKD directly by interaction with its pleckstrin homology domain (Jamora et al, 1999). In addition, Gβγ was also shown to hinder HDAC5 activity through direct binding, which might add to the effects described in this study (Spiegelberg & Hamm, 2005).
Monomeric GTPases of the Rho family have been associated with regulation of HDAC function. For example, activation of RhoA leads to HDAC5 phosphorylation (Harrison et al, 2006). Gi/o‐coupled receptors are able to activate several RhoGTPases, including RhoA and Rac1 in cardiac myocytes (Vogt et al, 2007). However, we only could detect increased Rac1 activity after PGE2 stimulation. Rac1 is apparently indispensable for the hypertrophic response of cardiac myocytes (Pracyk et al, 1998; Vettel et al, 2012). Moreover, Rac1 activation also promotes oxidative stress by activation of NADPH oxidase and contributes to cardiac injury and malfunction (Maack et al, 2003; Ma et al, 2013). Rac1 signaling was also shown to lower class I HDAC activity in cardiac myocytes (Ma et al, 2013). Earlier, we reported that stimulation of α1A‐adrenergic receptors promotes Rac1 activation, which is required for myocyte hypertrophy. This Rac1 activation was mediated by Gi/o‐βγ/PI3K signaling and by the widely expressed RacGEF Tiam1 (Vettel et al, 2012). Similarly, we found that the PGE2‐mediated Rac1 activation depends on Tiam1 and the Tiam1–Rac1–PAK pathway was essential for MEF2 activation. We found that, similar to PKD, PAK2 activation contributes to nucleo‐cytoplasmic shuttling of HDAC5 upon PGE2 stimulation. These findings suggest that simultaneous activation of at least two different pathways converge on HDAC5 and subsequently MEF2. Whether and where PAK2 phosphorylates HDAC5 directly or indirectly remains however to be determined. Thus, we propose a model, in which PGE2‐dependent MEF2 activation requires nucleo‐cytoplasmic shuttling of HDAC5 by PKD and Rac1‐PAK2 in parallel (Fig 8). The necessity of multiple signaling pathways for the complete activation of MEF2 is in good agreement with the results of previous studies. For instance, nuclear export of HDACs can be blocked without altering their phosphorylation, and acetylation of MEF2 was shown to be essential for its complete activation (Wei et al, 2017). In earlier studies, PGE2 has also been shown to elevate the intracellular cAMP level in cardiac myocytes through the EP4 receptor (Liu et al, 2012). We and others have demonstrated before that increased cAMP levels after β‐adrenergic receptor stimulation counteracts MEF2 activation (Backs et al, 2011; Haworth et al, 2012; Chang et al, 2013; Lehmann et al, 2014, 2018). Interestingly, PGE2 increases cAMP concentration in different cellular compartments than β‐adrenergic receptors (Liu et al, 2012). We speculate that the β‐adrenergic receptor‐induced cAMP pool may be more efficient to repress MEF2 than the PGE2‐induced pool. Since PKA activation was associated with both beneficial and deleterious outcomes in cardiac myocytes (Lehmann et al, 2014), it would be valuable to determine the exact cAMP compartment responsible for MEF2 repression because its pharmacological manipulation may offer advantageous impact.
Figure 8. Divergent pathways promoted by PGE 2 synergistically activate the transcription factor MEF2.
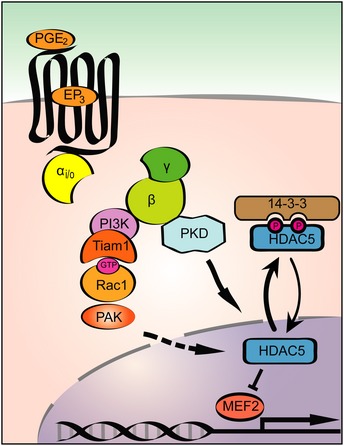
Schematic representation of the PGE2 triggered signal transduction pathways converging on HDAC5 and subsequently MEF2. PGE2 activates MEF2 through EP3 receptor and the βγ subunit of Gi/o proteins. One pathway implicates activation of PKD and concomitant phosphorylation of HDAC5. The phosphorylated HDAC5 is exported from the nucleus, which results in de‐repression of MEF2 and activation of the embryonic gene programs. In addition, hand in hand activation of Tiam1, Rac1, and PAK2 kinase occurs, which pathway also contributes to the nuclear export of HDAC5 and is responsible for synergistic activation of MEF2.
Therapeutic implications
Besides the in vitro data, we provide in vivo evidence that cardiac inflammation in a sepsis model induces activation of MEF2. Thus, the unmasked upstream signaling pathway consisting of PGE2, EP3, Rac1, and PKD may provide a number of new drug target candidates for the treatment of heart failure in the specific setting of inflammatory causes. Cyclooxygenase inhibitors, such as acetylsalicylic acid, are generally used as anti‐inflammatory, anti‐nociceptive, and anti‐thrombotic agents (Woodward et al, 2011). However, these drugs inhibit the synthesis of all prostaglandin types, and some of them, besides others prostacyclin, were shown to have beneficial effects in cardiovascular homeostasis (Woodward et al, 2011). A more specific approach could be the inhibition of microsomal prostaglandin E synthases (mPGES), the responsible enzymes for PGE2 production. However, mice lacking mPGES show worse cardiac function after angiotensin II infusion and develop adverse cardiac remodeling in an experimental model of myocardial infarction (Degousee et al, 2008; Harding et al, 2011). Cardiac‐specific EP4 −/− mice suffer from reduced cardiac function after MI and dilated cardiomyopathy develops with aging in EP4 −/− male mice (Qian et al, 2008; Harding et al, 2010). These results indicate that PGE2 may play an important role in maintaining the cardiac homeostasis partly through EP4 signaling. On the other hand, overexpression of EP3 receptors induces cardiac hypertrophy in the murine heart (Meyer‐Kirchrath et al, 2009). A role of EP3 receptor was also demonstrated in the promotion of vascular neointimal hyperplasia and formation of thrombocyte aggregation (Woodward et al, 2011; Zhang et al, 2013). In patients with severe heart failure, PGE2 levels are significantly higher, indicating the hyper‐activation of the prostaglandin system (Dzau et al, 1984). Thus, our findings imply that EP3 receptors represent a potential target in the treatment of inflammatory cardiomyopathy. Moreover, the identified downstream molecules of EP3 such as PKD or Rac1/PAK2 could also represent novel drug targets for inflammatory cardiomyopathies, for which no specific therapeutic strategies are available yet (Heymans et al, 2009; Suthahar et al, 2017). Further in vivo investigations using, e.g., EP3‐, PKD‐, or MEF2D‐deficient mice in the context of inflammatory cardiomyopathies are warranted to determine a critical role of the above mentioned signaling pathways and may facilitate translational studies toward personalized strategies to combat inflammatory cardiomyopathies.
Materials and Methods
Chemical reagents
Phenylephrine (PE), endothelin‐1 (ET1), dibutyryl‐cAMP, AH6809, L‐798106, isoproterenol, and bicinchoninic acid protein assay kit were purchased from Sigma‐Aldrich. Prostaglandin E1, prostaglandin E2, SQ 22536, and treprostinil were purchased from Santa Cruz, autocamtide‐2‐related inhibitory peptide II, L‐161,982, bisindolylmaleimide, and pertussis toxin from Calbiochem. Sphingosine‐1‐phosphate, lysophosphatidic acid, IPA‐3, and NSC23766 were from Tocris. Fluprostenol was from Cayman, and WIN55,212‐2 was from Enzo. Angiotensin II was bought from American Peptide, and the Luciferase Assay Kit was purchased from Promega. BPKDi was custom‐synthesized (Haworth et al, 2012). [4,5‐3H]‐leucine was from Perkin‐Elmer. Cell culture reagents were from Invitrogen.
Cell culture and adenoviral infection
Neonatal rat ventricular myocytes (NRVMs) were isolated from 1‐ to 2‐day‐old Sprague Dawley rats as previously described (Backs et al, 2006b). After isolation, NRVMs were maintained in DME/199 medium (4:1) with 10% FBS, 2 mM l‐glutamine, 100 U/ml penicillin, and 100 μg/ml streptomycin. NRVMs were infected 48 h after plating, grown 24 h in serum‐free media. Adenoviruses (Ad) harboring FLAG‐HDAC4, FLAG‐HDAC5, 3xMEF2‐Luc, GFP, RGS2, RGS16, p63ΔN, RGS‐LSCII, RGS3L, and transducin α were described before and used with 10 MOI (Fahimi‐Vahid et al, 2002; Vogt et al, 2007; Backs et al, 2008, 2011; Zhou et al, 2008; Wuertz et al, 2010; Carbajo‐Lozoya et al, 2012; Vidal et al, 2012). The adenovirus encoding GFP‐HDAC5 was a kind gift from Eric N. Olson. Neonatal cardiac fibroblasts (CFs) were separated from cardiomyocytes by pre‐plating. A cell suspension equal to two neonatal rat hearts was seeded per well of a 6‐well plate. After 1 h, the supernatant was removed, and the surface was rinsed with culture media to remove cell debris and suspended cells. The attached cells were cultured for 2–3 days to confluence and subsequently deprived of serum 24 h prior to stimulation. Adult mouse ventricular myocytes were isolated as previously described (Kreusser et al, 2014). Briefly, hearts of 6‐ to 12‐week‐old wild‐type BALB/c mice were excised after isoflurane anesthesia, which were then retrogradely perfused and digested. The cells were plated and incubated on laminin‐coated plates for 16 h, then were serum starved for 4 h prior to stimulation.
Pharmacological characteristics of the used inhibitors
Detailed description of the compounds and their use can be found in Appendix Table S1.
MEF2 reporter assay
NRVMs were infected with Ad–3xMEF2‐Luc to measure endogenous MEF2 activity. 4 h after infection, the cells were serum starved for 20 h. After starvation, cells were stimulated for 24 h. Thereafter, the cells were harvested, and luciferase activity was detected by Promega Luciferase Assay Kit and BMG Labtech FLUOstar OPTIMA luminometer. For standardization, the samples’ protein content was determined by Bicinchoninic Acid Protein Assay Kit according to manufacturer's instruction.
Immunoblotting
After infection and/or stimulation, NRVMs and adult mouse ventricular myocytes were washed and harvested in a solution containing 150 mM NaCl, 50 mM Tris, pH 7.4, 1 mM EDTA, 1% Triton X‐100, 1 mM PMSF, and protease inhibitors (Complete; Roche). To determine PAK and phospholamban phosphorylation, NRVMs and neonatal cardiac fibroblasts were harvested in Kranias buffer (30 mM Tris–HCl, pH 8.8, 5 mM EDTA, 30 mM NaF, 3% SDS, 10% glycerol supplemented with protease inhibitor cocktail and phosphatase inhibitor cocktail). Extracts from cardiac tissue were obtained as previously described (Kreusser et al, 2014). The lysates were denaturated, solved in Laemmli buffer, and electrophoresed with SDS–PAGE, then transferred to a PVDF membrane using wet transfer. The membrane was blocked in a 5% skim milk/PBS solution containing 0.1% Tween‐20 (PBST) or Roti‐Block (Carl Roth) solution (for detection of phosphorylated proteins) for 30 min. The membrane was then probed with the primary antibody overnight at 4°C. After washing three times with PBST, the membrane was incubated with the secondary antibody for 1 h at room temperature, followed by washing with PBST again. The signal was detected using ECL Advance Western Blotting System (GE Healthcare). The antibodies used for immunoblotting were as follows: rabbit anti‐phospho‐HDAC5 (Ser‐498; ab47283, 1:1,000, Abcam), rabbit anti‐phospho‐HDAC5 (Ser‐259; produced and provided by Timothy A. McKinsey, 1:1,000), rabbit anti‐HDAC5 (#20458, 1:1,000, Cell Signaling), mouse anti‐Flag M2‐peroxidase (HRP, 1:5,000, Sigma), mouse anti‐GAPDH (MAB374, 1:5,000, Chemicon, Millipore), mouse anti‐RhoA, (26 C4, 1:200, Santa Cruz), mouse anti‐Rac1 (610650, 1:1,000, BD Transduction), rabbit anti‐PKD/PKCμ [#90039, 1:1,000, Cell Signaling (Huynh & McKinsey, 2006)], rabbit anti‐phospho‐PKD/PKCμ (Ser‐744/748; #2054, 1:1,000, Cell Signaling), rabbit anti‐phospho‐PKD/PKCμ (Ser‐916; #2051, 1:1,000, Cell Signaling), rabbit anti‐calsequestrin (#PA1‐913, 1:2,000, ThermoScientific), rabbit anti‐PAK1/2/3 (#2604, 1:1,000, Cell Signaling, used in NRVM and CF experiments), rabbit anti‐PAK2 (#2615, 1:1,000, Cell Signaling, used for mouse heart lysates), rabbit anti‐phosho‐PAK1/2 (Ser‐199/Ser‐204/Ser‐192/Ser‐197; #2605, 1:1,000, Cell Signaling), rabbit anti‐phospho‐PAK1/2 (Thr‐423/Thr‐402; #2601, 1:1,000, Cell Signaling), rabbit anti‐phospholamban (Ser‐16; #A010‐12, 1:5,000, Badrilla), mouse anti‐phospholamban (#A010‐14, 1:5,000, Badrilla). HRP‐conjugated secondary antibodies (goat anti‐rabbit and goat anti‐mouse, 1:5,000) were from Bio‐Rad.
RhoGTPase activation assay
NRVMs were adenovirally infected or pretreated with the indicated inhibitors before the RhoGTPase activation assay. The cells were lysed in GST‐Fish buffer. GTP‐bound RhoA was precipitated with the Rho‐binding domain of Rhotekin, and the GTP‐bound Rac1 was precipitated with the Rac‐binding domain of PAK1 coupled to glutathione sepharose, as previously described (Vettel et al, 2012). To determine the quantity of GTP‐bound and total GTPases, immunoblot analysis was performed.
[3H]‐Leucine incorporation assay
NRVMs were serum starved and treated 1 μCi/ml [4,5‐3H]‐leucine containing media. The [3H]‐incorporation was determined as previously described (Vettel et al, 2012). Briefly, after thorough washing with ice‐cold PBS, the proteins were precipitated with 10% trichloroacetic acid for 4 h at 4°C. Following repeated washing with ice‐cold PBS, the pellet was dissolved with 0.1 M NaOH and 0.01% SDS for 2 h at 37°C. Thereafter, the samples were mixed scintillation liquid from Carl Roth GmbH. [3H]‐scintillation was measured with a Tri‐Carb 2100TR Packard scintillation counter.
Immunostaining and analysis of HDAC5 cellular localization
NRVMs were grown on collagen‐coated coverslips. For cell size measurements, the cells were serum starved for 24 h and were stimulated with the indicated stimuli for 48 h; the stimulation was repeated after first 24 h. To determine the cellular localization of HDAC5, NRVMs were transduced with GFP‐HDAC5, and the medium was changed the next day to starvation medium for 24 h. The cells were pretreated for 2 h and stimulated for 4 h with the indicated compounds. After stimulation, the cells were washed, fixed in 4% paraformaldehyde, permeabilized using 0.3% Triton X‐100, and blocked in 5% goat serum‐containing PBS solution. The cells were stained with mouse anti‐α‐actinin (sarcomeric) primary antibody (clone EA‐53, 1:400, Sigma) and Alexa Fluor 594‐conjugated goat anti‐mouse IgG secondary antibody (#A‐11005, 1:1,000, Molecular Probes). DAPI was added in 1:10,000 dilution. Images were taken with an Olympus BX‐51 fluorescence microscope using 20× or 63× objectives. Cell size was analyzed with ImageJ software. Intracellular (i.e., nuclear or cytosolic) localization of GFP‐HDAC5 was determined in more than 100 cells in each sample. The investigator was blinded.
Induction of endotoxemia
Six‐ to twelve‐week‐old male and female BALB/c mice, harboring a MEF2‐lacZ reporter, were treated with 7 mg/kg bacterial lipopolysaccharide (LPS) from Escherichia coli (O111:B4, Sigma‐Aldrich), as described by others (Rudyk et al, 2013). Littermates received saline and served as a control, and the mice were randomly allocated. Sacrificing and organ harvesting was performed after 24 h. The MEF2‐lacZ reporter consists of a lacZ transgene linked to the hsp68 basal promoter and three tandem copies of the MEF2 site from the desmin enhancer and the MEF2‐lacZ reporter mice were a kind gift of Eric N. Olson (Naya et al, 1999; Passier et al, 2000). Animals were kept in a 12‐h/12‐h light/dark cycle at 21–23°C and fed with a standard chow diet ad libitum before experiments. All experimental procedures were reviewed and approved by the Institutional Animal Care and Use Committee at the Regierungspräsidium Karlsruhe, Germany.
Analysis of myocardial PGE2 levels
Directly after harvest, murine hearts were frozen in liquid nitrogen and mechanically homogenized without intermittent thawing. Concentrations of PGE2 were determined using liquid chromatography‐tandem mass spectrometry (LC‐MS/MS) as described previously (Sisignano et al, 2016). In brief, PGE2 was extracted from homogenized tissue samples (ca. 25 mg) using liquid–liquid extraction. PGE2 was analyzed using a Synergi Hydro column (150 × 2 mm, 4 μm, Phenomenex) coupled to a hybrid triple quadrupole‐ion trap mass spectrometer QTRAP 5500 (Sciex, Darmstadt, Germany) equipped with a Turbo‐V‐source operating in negative ESI mode. The concentrations of the calibration standards, quality controls, and tissue samples were evaluated by Analyst software 1.6 and MultiQuant software 3.0 (Sciex) using the internal standard method (isotope dilution mass spectrometry). The calibration curve was calculated by quadratic regression with 1/x2 weighting (calibration range 0.002–25 ng/sample).
RNA analysis
RNA was isolated from mouse ventricular tissue or from NRVMs using Trizol (Invitrogen). Total RNA was digested with DNase, and cDNA synthesis from 1,000 ng of RNA was carried out using a SuperScript first‐strand synthesis system for RT–PCR (Invitrogen). Quantitative real‐time PCR (qPCR) was performed with Universal ProbeLibrary (Roche) by using TaqMan Universal PCR Mastermix (Applied Biosystems) and detection on a 7500 Fast Cycler (Applied Biosystems). Primer sequences are shown in Appendix Table S2.
In vivo assay for MEF2 activity
In vivo transcriptional activity of MEF2 was monitored using MEF2‐LacZ reporter mice, as described previously (Naya et al, 1999; Passier et al, 2000). Briefly, the MEF2‐driven β‐galactosidase expression was determined by measuring the β‐galactosidase activity. After LPS or saline treatment, β‐galactosidase staining was performed on cardiac sections and whole organs, respectively, from MEF2‐lacZ reporter mice. After fixation, β‐galactosidase activity was detected by addition of the chromogenic substrate 5‐bromo‐4‐chloro‐3‐indolyl‐β‐D‐galactoside (X‐gal), which results in creation of bright blue precipitates. Images were acquired with an Olympus SZH zoom stereo dissection scope with an Optronics DEI‐750 CCD digital camera (using a 20× objective for histological slides); whole‐heart stainings were quantified using ImageJ software by measuring the blue pixel intensity normalized to the total intensity.
Statistics
Results are expressed as mean ± s.e.m. No statistical methods were used to predetermine the sample size. Sample size was chosen based on our own experience and other publications studying similar processes. Mice were randomly and blindly allocated to the sham‐treated group and the LPS‐treated group. Besides that, no randomization was used. Animals, which died in the first 24 h after treatment, were not further examined. Besides that, no animals or samples were excluded. To assess β‐galactosidase expression and cell size of NRVMs, the investigator was blinded during both the image acquisition and the analysis. Analysis of HDAC5 cellular localization was blinded as well. For statistical analysis Student's or Welch's unpaired two‐tailed tests, Pearson's correlation test, one‐way or two‐way ANOVA with Bonferroni post hoc tests were performed. D'Agostino‐Pearson test was used to assess normal distribution. We considered P‐values < 0.05 statistically significant.
Author contributions
ADT, RS, TW, and JB designed the study and analyzed the results; RS, CV, PT, CH, and FA performed animal experiments; ADT, RS, ML, CV, CH, SW, LF, and JK‐H made cell culture experiments, DT performed mass spectrometric analysis; H‐JG performed and analyzed histological stainings; MA provided important reagents; ADT, RS, ML, CV, PT, CH, FA, SW, LF, JK‐H, DT, H‐JG, MA, HAK, TW, and JB wrote the manuscript.
Conflict of interest
The authors declare that they have no conflict of interest.
The paper explained.
Problem
The underlying mechanisms responsible for the development of cardiac remodeling and myocardial dysfunction are still poorly understood. The aim of the study was to identify and describe new signaling pathways, leading to an activation of the transcription factor myocyte enhancer factor 2 (MEF2), a central regulator of adverse cardiac remodeling, and thereby potentially contributing to the pathogenesis of heart failure.
Results
We found that the inflammatory mediator prostaglandin E2 (PGE2) is a powerful activator of MEF2 in neonatal rat ventricular cardiomyocytes. In accordance with that, the levels of PGE2 are increased and MEF2 is strongly activated in a murine model of sepsis in vivo. We provide evidence that the effects of PGE2 are transmitted by the EP3 receptor subtype and the βγ subunit of the heterotrimeric Gi/o protein, which initiate at least two parallel signaling pathways. One consists of the guanine exchange factor Tiam1, the monomeric GTPase Rac1, and the p21‐activated kinase 2. In addition, the other pathway results in the activation of protein kinase D, which relieves the histone deacetylase 5‐mediated repression of MEF2 activity. Inhibition of either of the participating pathway members prevented the MEF2 activation by PGE2.
Impact
Our findings reveal an unexpected new link between inflammation and adverse cardiac remodeling via MEF2 activation. The unmasked upstream signaling pathway consisting of PGE2, EP3, Rac1, and PKD may provide a number of new drug target candidates for the treatment of heart failure, in particular of inflammatory cardiomyopathies.
Supporting information
Appendix
Expanded View Figures PDF
Source Data for Expanded View
Review Process File
Source Data for Figure 1
Source Data for Figure 2
Source Data for Figure 3
Source Data for Figure 4
Source Data for Figure 5
Source Data for Figure 6
Source Data for Figure 7
Acknowledgements
We thank Claudia Heft, Michaela Oestringer, and Ulrike Oehl for technical assistance. GFP‐HDAC5 adenovirus and MEF2‐lacZ reporter mice were kindly provided by Eric N. Olson (University of Texas Southwestern Medical Center, Dallas, USA). An antibody against Ser259‐phosphorylated HDAC5 was kindly provided by Timothy A. McKinsey (University of Colorado, Denver, USA). Furthermore, we thank Philip Eaton (University College London, London, UK) for providing advice concerning the LPS‐induced endotoxemia. J.B. was supported by grants from the Deutsche Forschungsgemeinschaft (SFB 1118) and the Ministerium für Wissenschaft, Forschung, und Kunst Baden‐Württemberg (Inflamyocard). J.B., T.W., M.L., and H.A.K were supported by the DZHK (Deutsches Zentrum für Herz‐Kreislauf‐Forschung—German Centre for Cardiovascular Research) and by the BMBF (German Ministry of Education and Research). A.D.T. was supported by the Jellinek Harry Scholarship (partnership between Heidelberg, Freiburg, and Semmelweis Universities). R.S. was supported by the DGK (Deutsche Gesellschaft für Kardiologie—German Cardiac Society) and the DZHK (Deutsches Zentrum für Herz‐Kreislauf‐Forschung—German Centre for Cardiovascular Research).
EMBO Mol Med (2018) 10: e8536
References
- Avkiran M, Rowland AJ, Cuello F, Haworth RS (2008) Protein kinase D in the cardiovascular system: emerging roles in health and disease. Circ Res 102: 157–163 [DOI] [PubMed] [Google Scholar]
- Backs J, Olson EN (2006a) Control of cardiac growth by histone acetylation/deacetylation. Circ Res 98: 15–24 [DOI] [PubMed] [Google Scholar]
- Backs J, Song K, Bezprozvannaya S, Chang S, Olson EN (2006b) CaM kinase II selectively signals to histone deacetylase 4 during cardiomyocyte hypertrophy. J Clin Invest 116: 1853–1864 [DOI] [PMC free article] [PubMed] [Google Scholar]
- Backs J, Backs T, Bezprozvannaya S, McKinsey TA, Olson EN (2008) Histone deacetylase 5 acquires calcium/calmodulin‐dependent kinase II responsiveness by oligomerization with histone deacetylase 4. Mol Cell Biol 28: 3437–3445 [DOI] [PMC free article] [PubMed] [Google Scholar]
- Backs J, Worst BC, Lehmann LH, Patrick DM, Jebessa Z, Kreusser MM, Sun Q, Chen L, Heft C, Katus HA et al (2011) Selective repression of MEF2 activity by PKA‐dependent proteolysis of HDAC4. J Cell Biol 195: 403–415 [DOI] [PMC free article] [PubMed] [Google Scholar]
- Bossuyt J, Chang CW, Helmstadter K, Kunkel MT, Newton AC, Campbell KS, Martin JL, Bossuyt S, Robia SL, Bers DM (2011) Spatiotemporally distinct protein kinase D activation in adult cardiomyocytes in response to phenylephrine and endothelin. J Biol Chem 286: 33390–33400 [DOI] [PMC free article] [PubMed] [Google Scholar]
- Carbajo‐Lozoya J, Lutz S, Feng Y, Kroll J, Hammes HP, Wieland T (2012) Angiotensin II modulates VEGF‐driven angiogenesis by opposing effects of type 1 and type 2 receptor stimulation in the microvascular endothelium. Cell Signal 24: 1261–1269 [DOI] [PubMed] [Google Scholar]
- Chang S, McKinsey TA, Zhang CL, Richardson JA, Hill JA, Olson EN (2004) Histone deacetylases 5 and 9 govern responsiveness of the heart to a subset of stress signals and play redundant roles in heart development. Mol Cell Biol 24: 8467–8476 [DOI] [PMC free article] [PubMed] [Google Scholar]
- Chang CW, Lee L, Yu D, Dao K, Bossuyt J, Bers DM (2013) Acute beta‐adrenergic activation triggers nuclear import of histone deacetylase 5 and delays G(q)‐induced transcriptional activation. J Biol Chem 288: 192–204 [DOI] [PMC free article] [PubMed] [Google Scholar]
- Cuello F, Bardswell SC, Haworth RS, Yin X, Lutz S, Wieland T, Mayr M, Kentish JC, Avkiran M (2007) Protein kinase D selectively targets cardiac troponin I and regulates myofilament Ca2+ sensitivity in ventricular myocytes. Circ Res 100: 864–873 [DOI] [PubMed] [Google Scholar]
- Degousee N, Fazel S, Angoulvant D, Stefanski E, Pawelzik SC, Korotkova M, Arab S, Liu P, Lindsay TF, Zhuo S et al (2008) Microsomal prostaglandin E2 synthase‐1 deletion leads to adverse left ventricular remodeling after myocardial infarction. Circulation 117: 1701–1710 [DOI] [PubMed] [Google Scholar]
- Di Benedetto G, Zoccarato A, Lissandron V, Terrin A, Li X, Houslay MD, Baillie GS, Zaccolo M (2008) Protein kinase A type I and type II define distinct intracellular signaling compartments. Circ Res 103: 836–844 [DOI] [PubMed] [Google Scholar]
- Dzau VJ, Packer M, Lilly LS, Swartz SL, Hollenberg NK, Williams GH (1984) Prostaglandins in severe congestive heart failure. Relation to activation of the renin–angiotensin system and hyponatremia. N Engl J Med 310: 347–352 [DOI] [PubMed] [Google Scholar]
- Fahimi‐Vahid M, Gosau N, Michalek C, Han L, Jakobs KH, Schmidt M, Roberts N, Avkiran M, Wieland T (2002) Distinct signaling pathways mediate cardiomyocyte phospholipase D stimulation by endothelin‐1 and thrombin. J Mol Cell Cardiol 34: 441–453 [DOI] [PubMed] [Google Scholar]
- Fielitz J, Kim MS, Shelton JM, Qi X, Hill JA, Richardson JA, Bassel‐Duby R, Olson EN (2008) Requirement of protein kinase D1 for pathological cardiac remodeling. Proc Natl Acad Sci USA 105: 3059–3063 [DOI] [PMC free article] [PubMed] [Google Scholar]
- Frias MA, Rebsamen MC, Gerber‐Wicht C, Lang U (2007) Prostaglandin E2 activates Stat3 in neonatal rat ventricular cardiomyocytes: a role in cardiac hypertrophy. Cardiovasc Res 73: 57–65 [DOI] [PubMed] [Google Scholar]
- Gao C, Ren S, Lee JH, Qiu J, Chapski DJ, Rau CD, Zhou Y, Abdellatif M, Nakano A, Vondriska TM et al (2016) RBFox1‐mediated RNA splicing regulates cardiac hypertrophy and heart failure. J Clin Invest 126: 195–206 [DOI] [PMC free article] [PubMed] [Google Scholar]
- Guo J, Gertsberg Z, Ozgen N, Sabri A, Steinberg SF (2011) Protein kinase D isoforms are activated in an agonist‐specific manner in cardiomyocytes. J Biol Chem 286: 6500–6509 [DOI] [PMC free article] [PubMed] [Google Scholar]
- Harding P, Yang XP, Yang J, Shesely E, He Q, LaPointe MC (2010) Gene expression profiling of dilated cardiomyopathy in older male EP4 knockout mice. Am J Physiol Heart Circ Physiol 298: H623–H632 [DOI] [PMC free article] [PubMed] [Google Scholar]
- Harding P, Yang XP, He Q, Lapointe MC (2011) Lack of microsomal prostaglandin E synthase‐1 reduces cardiac function following angiotensin II infusion. Am J Physiol Heart Circ Physiol 300: H1053–H1061 [DOI] [PMC free article] [PubMed] [Google Scholar]
- Harrison BC, Kim MS, van Rooij E, Plato CF, Papst PJ, Vega RB, McAnally JA, Richardson JA, Bassel‐Duby R, Olson EN et al (2006) Regulation of cardiac stress signaling by protein kinase d1. Mol Cell Biol 26: 3875–3888 [DOI] [PMC free article] [PubMed] [Google Scholar]
- Haworth RS, Roberts NA, Cuello F, Avkiran M (2007) Regulation of protein kinase D activity in adult myocardium: novel counter‐regulatory roles for protein kinase Cepsilon and protein kinase A. J Mol Cell Cardiol 43: 686–695 [DOI] [PubMed] [Google Scholar]
- Haworth RS, Cuello F, Avkiran M (2011) Regulation by phosphodiesterase isoforms of protein kinase A‐mediated attenuation of myocardial protein kinase D activation. Basic Res Cardiol 106: 51–63 [DOI] [PMC free article] [PubMed] [Google Scholar]
- Haworth RS, Stathopoulou K, Candasamy AJ, Avkiran M (2012) Neurohormonal regulation of cardiac histone deacetylase 5 nuclear localization by phosphorylation‐dependent and phosphorylation‐independent mechanisms. Circ Res 110: 1585–1595 [DOI] [PubMed] [Google Scholar]
- He Q, Harding P, LaPointe MC (2010) PKA, Rap1, ERK1/2, and p90RSK mediate PGE2 and EP4 signaling in neonatal ventricular myocytes. Am J Physiol Heart Circ Physiol 298: H136–H143 [DOI] [PMC free article] [PubMed] [Google Scholar]
- Herman CA, Hamberg M, Granstrom E (1987) Quantitative determination of prostaglandins E1, E2 and E3 in frog tissue. J Chromatogr 394: 353–362 [DOI] [PubMed] [Google Scholar]
- Heymans S, Hirsch E, Anker SD, Aukrust P, Balligand JL, Cohen‐Tervaert JW, Drexler H, Filippatos G, Felix SB, Gullestad L et al (2009) Inflammation as a therapeutic target in heart failure? A scientific statement from the Translational Research Committee of the Heart Failure Association of the European Society of Cardiology. Eur J Heart Fail 11: 119–129 [DOI] [PMC free article] [PubMed] [Google Scholar]
- Hofmann U, Frantz S (2013) How can we cure a heart “in flame”? A translational view on inflammation in heart failure. Basic Res Cardiol 108: 356 [DOI] [PMC free article] [PubMed] [Google Scholar]
- Huynh QK, McKinsey TA (2006) Protein kinase D directly phosphorylates histone deacetylase 5 via a random sequential kinetic mechanism. Arch Biochem Biophys 450: 141–148 [DOI] [PubMed] [Google Scholar]
- Jamora C, Yamanouye N, Van Lint J, Laudenslager J, Vandenheede JR, Faulkner DJ, Malhotra V (1999) Gbetagamma‐mediated regulation of Golgi organization is through the direct activation of protein kinase D. Cell 98: 59–68 [DOI] [PubMed] [Google Scholar]
- Kim Y, Phan D, van Rooij E, Wang DZ, McAnally J, Qi X, Richardson JA, Hill JA, Bassel‐Duby R, Olson EN (2008) The MEF2D transcription factor mediates stress‐dependent cardiac remodeling in mice. J Clin Invest 118: 124–132 [DOI] [PMC free article] [PubMed] [Google Scholar]
- Kreusser MM, Lehmann LH, Keranov S, Hoting MO, Oehl U, Kohlhaas M, Reil JC, Neumann K, Schneider MD, Hill JA et al (2014) Cardiac CaM Kinase II genes delta and gamma contribute to adverse remodeling but redundantly inhibit calcineurin‐induced myocardial hypertrophy. Circulation 130: 1262–1273 [DOI] [PMC free article] [PubMed] [Google Scholar]
- Lehmann LH, Worst BC, Stanmore DA, Backs J (2014) Histone deacetylase signaling in cardioprotection. Cell Mol Life Sci 71: 1673–1690 [DOI] [PMC free article] [PubMed] [Google Scholar]
- Lehmann LH, Jebessa ZH, Kreusser MM, Horsch A, He T, Kronlage M, Dewenter M, Sramek V, Oehl U, Krebs‐Haupenthal J et al (2018) A proteolytic fragment of histone deacetylase 4 protects the heart from failure by regulating the hexosamine biosynthetic pathway. Nat Med 24: 62–72 [DOI] [PubMed] [Google Scholar]
- Lin Q, Schwarz J, Bucana C, Olson EN (1997) Control of mouse cardiac morphogenesis and myogenesis by transcription factor MEF2C. Science 276: 1404–1407 [DOI] [PMC free article] [PubMed] [Google Scholar]
- Liu S, Li Y, Kim S, Fu Q, Parikh D, Sridhar B, Shi Q, Zhang X, Guan Y, Chen X et al (2012) Phosphodiesterases coordinate cAMP propagation induced by two stimulatory G protein‐coupled receptors in hearts. Proc Natl Acad Sci USA 109: 6578–6583 [DOI] [PMC free article] [PubMed] [Google Scholar]
- Ma J, Wang Y, Zheng D, Wei M, Xu H, Peng T (2013) Rac1 signalling mediates doxorubicin‐induced cardiotoxicity through both reactive oxygen species‐dependent and ‐independent pathways. Cardiovasc Res 97: 77–87 [DOI] [PubMed] [Google Scholar]
- Maack C, Kartes T, Kilter H, Schafers HJ, Nickenig G, Bohm M, Laufs U (2003) Oxygen free radical release in human failing myocardium is associated with increased activity of rac1‐GTPase and represents a target for statin treatment. Circulation 108: 1567–1574 [DOI] [PubMed] [Google Scholar]
- Mendez M, LaPointe MC (2005) PGE2‐induced hypertrophy of cardiac myocytes involves EP4 receptor‐dependent activation of p42/44 MAPK and EGFR transactivation. Am J Physiol Heart Circ Physiol 288: H2111–H2117 [DOI] [PubMed] [Google Scholar]
- Meredith EL, Beattie K, Burgis R, Capparelli M, Chapo J, Dipietro L, Gamber G, Enyedy I, Hood DB, Hosagrahara V et al (2010) Identification of potent and selective amidobipyridyl inhibitors of protein kinase D. J Med Chem 53: 5422–5438 [DOI] [PubMed] [Google Scholar]
- Meyer‐Kirchrath J, Martin M, Schooss C, Jacoby C, Flogel U, Marzoll A, Fischer JW, Schrader J, Schror K, Hohlfeld T (2009) Overexpression of prostaglandin EP3 receptors activates calcineurin and promotes hypertrophy in the murine heart. Cardiovasc Res 81: 310–318 [DOI] [PubMed] [Google Scholar]
- Monovich L, Vega RB, Meredith E, Miranda K, Rao C, Capparelli M, Lemon DD, Phan D, Koch KA, Chapo JA et al (2010) A novel kinase inhibitor establishes a predominant role for protein kinase D as a cardiac class IIa histone deacetylase kinase. FEBS Lett 584: 631–637 [DOI] [PubMed] [Google Scholar]
- Naya FJ, Wu C, Richardson JA, Overbeek P, Olson EN (1999) Transcriptional activity of MEF2 during mouse embryogenesis monitored with a MEF2‐dependent transgene. Development 126: 2045–2052 [DOI] [PubMed] [Google Scholar]
- Naya FJ, Black BL, Wu H, Bassel‐Duby R, Richardson JA, Hill JA, Olson EN (2002) Mitochondrial deficiency and cardiac sudden death in mice lacking the MEF2A transcription factor. Nat Med 8: 1303–1309 [DOI] [PubMed] [Google Scholar]
- van Oort RJ, van Rooij E, Bourajjaj M, Schimmel J, Jansen MA, van der Nagel R, Doevendans PA, Schneider MD, van Echteld CJ, De Windt LJ (2006) MEF2 activates a genetic program promoting chamber dilation and contractile dysfunction in calcineurin‐induced heart failure. Circulation 114: 298–308 [DOI] [PubMed] [Google Scholar]
- Passier R, Zeng H, Frey N, Naya FJ, Nicol RL, McKinsey TA, Overbeek P, Richardson JA, Grant SR, Olson EN (2000) CaM kinase signaling induces cardiac hypertrophy and activates the MEF2 transcription factor in vivo . J Clin Invest 105: 1395–1406 [DOI] [PMC free article] [PubMed] [Google Scholar]
- Potthoff MJ, Olson EN (2007) MEF2: a central regulator of diverse developmental programs. Development 134: 4131–4140 [DOI] [PubMed] [Google Scholar]
- Pracyk JB, Tanaka K, Hegland DD, Kim KS, Sethi R, Rovira II, Blazina DR, Lee L, Bruder JT, Kovesdi I et al (1998) A requirement for the rac1 GTPase in the signal transduction pathway leading to cardiac myocyte hypertrophy. J Clin Invest 102: 929–937 [DOI] [PMC free article] [PubMed] [Google Scholar]
- Qian JY, Harding P, Liu Y, Shesely E, Yang XP, LaPointe MC (2008) Reduced cardiac remodeling and function in cardiac‐specific EP4 receptor knockout mice with myocardial infarction. Hypertension 51: 560–566 [DOI] [PMC free article] [PubMed] [Google Scholar]
- Rudyk O, Phinikaridou A, Prysyazhna O, Burgoyne JR, Botnar RM, Eaton P (2013) Protein kinase G oxidation is a major cause of injury during sepsis. Proc Natl Acad Sci USA 110: 9909–9913 [DOI] [PMC free article] [PubMed] [Google Scholar]
- Sisignano M, Angioni C, Park CK, Meyer Dos Santos S, Jordan H, Kuzikov M, Liu D, Zinn S, Hohman SW, Schreiber Y et al (2016) Targeting CYP2J to reduce paclitaxel‐induced peripheral neuropathic pain. Proc Natl Acad Sci USA 113: 12544–12549 [DOI] [PMC free article] [PubMed] [Google Scholar]
- Spiegelberg BD, Hamm HE (2005) G betagamma binds histone deacetylase 5 (HDAC5) and inhibits its transcriptional co‐repression activity. J Biol Chem 280: 41769–41776 [DOI] [PubMed] [Google Scholar]
- Suthahar N, Meijers WC, Sillje HHW, de Boer RA (2017) From Inflammation to fibrosis‐molecular and cellular mechanisms of myocardial tissue remodelling and perspectives on differential treatment opportunities. Curr Heart Fail Rep 14: 235–250 [DOI] [PMC free article] [PubMed] [Google Scholar]
- Vega RB, Harrison BC, Meadows E, Roberts CR, Papst PJ, Olson EN, McKinsey TA (2004) Protein kinases C and D mediate agonist‐dependent cardiac hypertrophy through nuclear export of histone deacetylase 5. Mol Cell Biol 24: 8374–8385 [DOI] [PMC free article] [PubMed] [Google Scholar]
- Vettel C, Wittig K, Vogt A, Wuertz CM, El‐Armouche A, Lutz S, Wieland T (2012) A novel player in cellular hypertrophy: Gibetagamma/PI3K‐dependent activation of the RacGEF TIAM‐1 is required for alpha(1)‐adrenoceptor induced hypertrophy in neonatal rat cardiomyocytes. J Mol Cell Cardiol 53: 165–175 [DOI] [PubMed] [Google Scholar]
- Vidal M, Wieland T, Lohse MJ, Lorenz K (2012) beta‐Adrenergic receptor stimulation causes cardiac hypertrophy via a Gbetagamma/Erk‐dependent pathway. Cardiovasc Res 96: 255–264 [DOI] [PubMed] [Google Scholar]
- Vogt A, Lutz S, Rumenapp U, Han L, Jakobs KH, Schmidt M, Wieland T (2007) Regulator of G‐protein signalling 3 redirects prototypical Gi‐coupled receptors from Rac1 to RhoA activation. Cell Signal 19: 1229–1237 [DOI] [PubMed] [Google Scholar]
- Wales S, Hashemi S, Blais A, McDermott JC (2014) Global MEF2 target gene analysis in cardiac and skeletal muscle reveals novel regulation of DUSP6 by p38MAPK‐MEF2 signaling. Nucleic Acids Res 42: 11349–11362 [DOI] [PMC free article] [PubMed] [Google Scholar]
- Weeks KL, Avkiran M (2015) Roles and post‐translational regulation of cardiac class IIa histone deacetylase isoforms. J Physiol 593: 1785–1797 [DOI] [PMC free article] [PubMed] [Google Scholar]
- Weeks KL, Ranieri A, Karas A, Bernardo BC, Ashcroft AS, Molenaar C, McMullen JR, Avkiran M (2017) Beta‐adrenergic stimulation induces histone deacetylase 5 (HDAC5) nuclear accumulation in cardiomyocytes by B55alpha‐PP2A‐mediated dephosphorylation. J Am Heart Assoc 6: e004861 [DOI] [PMC free article] [PubMed] [Google Scholar]
- Wei J, Joshi S, Speransky S, Crowley C, Jayathilaka N, Lei X, Wu Y, Gai D, Jain S, Hoosien M et al (2017) Reversal of pathological cardiac hypertrophy via the MEF2‐coregulator interface. JCI Insight 2: 91068 [DOI] [PMC free article] [PubMed] [Google Scholar]
- Weinreuter M, Kreusser MM, Beckendorf J, Schreiter FC, Leuschner F, Lehmann LH, Hofmann KP, Rostosky JS, Diemert N, Xu C et al (2014) CaM Kinase II mediates maladaptive post‐infarct remodeling and pro‐inflammatory chemoattractant signaling but not acute myocardial ischemia/reperfusion injury. EMBO Mol Med 6: 1231–1245 [DOI] [PMC free article] [PubMed] [Google Scholar]
- Woodward DF, Jones RL, Narumiya S (2011) International Union of Basic and Clinical Pharmacology. LXXXIII: classification of prostanoid receptors, updating 15 years of progress. Pharmacol Rev 63: 471–538 [DOI] [PubMed] [Google Scholar]
- Wuertz CM, Lorincz A, Vettel C, Thomas MA, Wieland T, Lutz S (2010) p63RhoGEF–a key mediator of angiotensin II‐dependent signaling and processes in vascular smooth muscle cells. FASEB J 24: 4865–4876 [DOI] [PubMed] [Google Scholar]
- Zhang CL, McKinsey TA, Chang S, Antos CL, Hill JA, Olson EN (2002) Class II histone deacetylases act as signal‐responsive repressors of cardiac hypertrophy. Cell 110: 479–488 [DOI] [PMC free article] [PubMed] [Google Scholar]
- Zhang J, Zou F, Tang J, Zhang Q, Gong Y, Wang Q, Shen Y, Xiong L, Breyer RM, Lazarus M et al (2013) Cyclooxygenase‐2‐derived prostaglandin E2 promotes injury‐induced vascular neointimal hyperplasia through the E‐prostanoid 3 receptor. Circ Res 113: 104–114 [DOI] [PMC free article] [PubMed] [Google Scholar]
- Zhou XB, Wulfsen I, Lutz S, Utku E, Sausbier U, Ruth P, Wieland T, Korth M (2008) M2 muscarinic receptors induce airway smooth muscle activation via a dual, Gbetagamma‐mediated inhibition of large conductance Ca2+‐activated K+ channel activity. J Biol Chem 283: 21036–21044 [DOI] [PMC free article] [PubMed] [Google Scholar]
Associated Data
This section collects any data citations, data availability statements, or supplementary materials included in this article.
Supplementary Materials
Appendix
Expanded View Figures PDF
Source Data for Expanded View
Review Process File
Source Data for Figure 1
Source Data for Figure 2
Source Data for Figure 3
Source Data for Figure 4
Source Data for Figure 5
Source Data for Figure 6
Source Data for Figure 7